Delineating the rice crop activities in Northeast China through regional parametric synthesis using satellite remote sensing timeseries data from 2000 to 2015
2021-01-18CAODanFENGJianzhongBAlLinyanXUNLanJlNGHaitaoSUNJinkeZHANGJiahua
CAO Dan ,FENG Jian-zhong,BAl Lin-yan ,XUN Lan ,JlNG Hai-tao,SUN Jin-ke,ZHANG Jia-hua
1 Key Laboratory of Digital Earth Science,Aerospace Information Research Institute,Chinese Academy of Sciences,Beijing 100094,P.R.China
2 University of Chinese Academy of Sciences,Beijing 100094,P.R.China
3 Agricultural Information Institute,Chinese Academy of Agricultural Sciences,Beijing 100081,P.R.China
4 School of Surveying and Land Information Engineering,Henan Polytechnic University,Jiaozuo 454000,P.R.China
Abstract Accurate rice area extraction and yield simulations are important for understanding how national agricultural policies and environmental issues affect regional spatial changes in rice farming. In this study,an improved regional parametric syntheses approach,that is,the rice zoning adaptability criteria and dynamic harvest index (RZAC-DHI),was established,which can effectively simulate the rice cultivation area and yield at the municipal level. The RZAC was used to extract the rice area using Moderate Resolution Imaging Spectroradiometer time-series data and phenological information. The DHI was calculated independently,and then yield was obtained based on the DHI and net primary productivity (NPP). Based on the above results,we analyzed the spatial–temporal patterns of the rice cultivation area and yield in Northeast China(NEC) during 2000–2015. The results revealed that the methods established in this study can effectively support the yearly mapping of the rice area and yield in NEC,the average precisions of which exceed 90 and 80%,respectively. The rice planting areas are mainly located on the Sanjiang,Songnen and Liaohe plains,China,which are distributed along the Songhua and Liaohe rivers. The rice cultivation area and yield in this region increased significantly from 2000 to 2015,with increases of nearly 58 and 90%,respectively. The rice crop area and yield increased the fastest in Heilongjiang Province,China,whereas small changes occurred in Jilin and Liaoning provinces,China. Their gravity centers exhibited evident northward and eastward shifts,with offset distances of 107 and 358 km,respectively. Moreover,Heilongjiang Province has gradually become the new main rice production region. The methodologies used in this study provide a valuable reference for other related studies,and the spatial-temporal variation characteristics of the rice activities have raised new attention as to how these shifts affect national food security and resource allocation.
Keywords:RZAC,dynamic HI,rice cultivation area,yield,spatial-temporal change
1.lntroduction
Rice is a major food staple for almost 50% of the world’s population (Kuenzer and Knauer 2013),and it plays an important role in greenhouse gas emissions (Sass and Cicerone 2002),irrigation consumption (Zhang Get al.2015)and avian influenza virus transmission since it provides considerable habitat area for wild ducks and waterfowl(Gilbertet al.2008). Northeast China (NEC) is the most important rice production area in China,and it accounted for 26.66 and 33.51% of the total rice cultivation area and yield,respectively,in 2015. Thus,it plays a pivotal role in national food security and resource management. However,due to climate warming and an increased demand for food,rice farming has been expanding rapidly in high latitude areas in the last decade (Dong and Xiao 2016). The changes in the rice planting structure in NEC will inevitably lead to tremendous changes in the spatial distribution of the rice yield in China,which may affect national food security and cause environmental issues related to water,climate and resource allocation. Thus,it is essential to track the spatialtemporal changes in rice activities in NEC.
Numerous previous efforts have been made to delineate the rice agriculture in the world,including the rice cultivation and yield (Penget al.2014; Zhang Jet al.2015; Zhanget al.2017; Wanget al.2018). In terms of rice cultivation,previous mapping of the rice planting distribution has mainly included(1) traditional supervised and unsupervised object-oriented image classification methods,(2) vegetation indices (VIs)data and enhanced image statistics-based approaches and (3) phenology-based approaches through remotesensing recognition of key growth phases (Dong and Xiao 2016). However,earlier studies used traditional methods such as the maximum likelihood classifier and the vector classifier,which require a significant amount of a priori crop knowledge,are time-consuming,and are difficult to apply to large-scale rice area monitoring. The second method uses new classifiers such as neural networks (NN),support vector machines (SVM) based on new input data (e.g.,MODIS)and vegetation indices. For example,normalized difference vegetation index (NDVI) time-series data (Penget al.2011;Busettoet al.2019),enhanced vegetation index (EVI) timeseries data,the normalized difference water index (NDWI),and the land surface water index (LSWI) (Xiaoet al.2002;Zhanget al.2017) provide a theoretical basis for capturing the characteristics of a crop. However,these input data and methods do not consider the phenological variations,profile information and remain at large scales,so they may result in significant errors due to sub-pixel heterogeneity.Recent studies have increasingly revealed the importance of the phenological characteristics,and the key rice growth phase has been taken into account when extracting rice cultivation fields. For example,Xiaoet al.(2002) found that rice characteristics can be more easily distinguished using VIs in the transplanting phase because rice fields (excluding upland rice) need to maintain a certain depth of water during the early part of the growing season. In particular,the threshold values in the formula (LSWI+0.05≥EVI) are widely used to identify rice in the transplanting phase. This robust phenology-based method has received increasing amounts of attention in terms of its application to rice cultivation. Dong and Xiao (2016) also processed all the available Landsat 8 imagery combined phenology-based methods using the Google Earth engine (GEE) to support the yearly mapping of paddy rice in Northeast Asia,revealing that the combination of phenology and VI can satisfactorily reflect crop activities during crop growth periods.
For rice yield estimations,crop models based on growth process and remote sensing techniques have been combined and applied to rice yield estimations on a regional scale or worldwide (Huanget al.2018; Jinet al.2018). For example,process-based models,including ORYZA,CERES-RICE,DNDC-Rice,and ORYZA2000,have been applied to determine the rice growth status and simulate rice yield (Jinet al.2018). However,process-based crop models need to account for the spatial variations in the growth factors,such as the soil properties (Bach and Mauser 2003; Chakrabartiet al.2014),meteorological data and canopy state variables (e.g.,leaf area index (Fanget al.2011; Jianget al.2014),simulation setting (Liet al.2013),biomass (Jinet al.2013,2015),evapotranspiration(Huanget al.2015),and fertilizer (Huanget al.2013)).The influence of these factors on crop growth simulation process is always uncertain,which leads to large errors when simulating the crop yield. Thus,this method is only suitable for local scale yield estimations due to the complex parameters and spatial heterogeneities (Jinet al.2018).Remote sensing techniques have been demonstrated to be useful for interpreting crop production processes and for determining how crop production responds to climate factors. Recent studies have revealed that the crop yield can be estimated from the net primary productivity(NPP),following which the NPP is converted into the biological yield using the harvest index (HI) (Huanget al.2018). Remote sensing techniques provide an alternative means of estimating the broader scale crop yield due to their theoretical soundness and practical convenience compared with process-based crop simulations (Zhanget al.2016; Ganget al.2018). However,many studies integrate the HI as a constant in large-scale estimations of crop yield (Krisnawati and Adie 2015; Daiet al.2016;Walteret al.2018). The results are characterized by overestimates and underestimates in different study areas (Yuanet al.2015). The HI is one of the important indicators used to evaluate crop yield,and it represents the economic coefficient of the crops,which refers to the percentage of the grain yield to the aboveground biomass of the crop (Walteret al.2018). It exhibits some stability in large areas,but certain differences exist in small areas(Echarte and Andrade 2003). Therefore,identifying the proper size of the study area is important for ensuring the accurate assessment of the HI.
Moreover,none of the aforementioned studies have used simultaneously spatially continuous and explicit information for both the rice area and yield,but instead they determine only the rice area extraction or yield estimation. Therefore,simultaneously delineating rice activities,including the cultivation area and yield,is a priority. To solve the abovedescribed issues,an improved regional parametric synthesis approach,that is,the rice zoning adaptability criteria and dynamic harvest index (RZAC-DHI),was established to delineate the spatial and temporal patterns of rice farming in NEC from 2000 to 2015. First,we developed and validated a robust quantitative approach at the municipal scale,namely,the RZAC,to extract the rice cultivation area based on NDVI,EVI and LSWI data. Then,the rice yield was calculated using the Light Use Efficiency (LUE) Model (Carnegie-Ames-Stanford Approach,CASA) and the dynamic harvest index(DHI) at the municipal scale.
2.Materials and methods
2.1.Study area
The study area consists of three provinces in NEC,that is,Heilongjiang,Jilin and Liaoning. The total area is about 787 300 km2,accounting for 8.2% of the total land area of China. NEC is one of the most important rice yield areas in China,accounting for approximately 15% of total national rice yield. The region has a typical cold and wet natural environment with fertile,deep soil and abundant water resources (Zhang Jet al.2015; Okamoto and Kawashima 2016; Liet al.2017; Wanget al.2018). Furthermore,it is one of the three black soil belts in the world and is representative of the “japonica” rice cultivation region in China. The annual average precipitation is 400–1 000 mm,and the average annual temperature is 5.4°C in the main farming areas.The heat conditions meet the requirements for crop growth.These regions are dominated by a single cropping system,which is predominantly composed of rice,maize,wheat,and soybean. The unique geographical characteristics provide important physical and geographical conditions for crop growth,rendering this region one of the most important agricultural production bases in China.
2.2.Data and processing
Remote sensing dataThe moderate resolution imaging spectroradiometer (MODIS) data products used in this study were derived from https://lpdaac.usgs.gov/data_access/.MODIS NDVI and EVI were obtained from MOD13Q1 with a 250 m/16 d spatiotemporal resolution,and the LSWI was calculated by MOD09A1. A total of eight years of data from 2000,2005 and 2010–2015 were obtained,which provides a remote sensing data source for studying rice planting changes in the research area from 2000 to 2015. All of the available MODIS NDVI,EVI,and LSWI data used in this study comprise 6 629 rows and 4 326 columns of data. The original MODIS data were mosaicked and reprojected onto the Albers Conic Equal Area coordinate system using the MODIS reprojection tools (MRT).
Meteorological dataThe meteorological data for 2000 to 2015,including daily temperature,daily precipitation and daily solar radiation,were used in this study. All of the data were obtained from the China Meteorological Administration(http://cdc.nmic.cn/home.do),and 88 meteorological stations were selected within the study area. These meteorological data were used to drive the CASA Model and included the growing-season monthly average temperatures,monthly precipitation and monthly solar radiation. Therefore,we integrated the daily scale data into the monthly scale data.These data were interpolated using the ANUSPLIN Software(version 4.2) (Hutchinson 2001) and the cross-validation method was used to create regular monthly data layers with the same spatial resolution as the NDVI data.
The phenological data from 38 rice agrometeorological stations in NEC were obtained from the National Meteorological Information Center (http://data.cma.cn/site/index.html). The observed phenological stages included transplanting,seedlings,tillering,heading,and maturity. The rice characteristics in the transplanting period were mainly used to extract the rice area.
Land-use data and other dataThe land-use maps for 2000,2005,2010,and 2015 were obtained from the Resource and Environment Science Data Center of the Chinese Academy of Sciences (http://www.resdc.cn). As a continuous annual land cover dataset was not available for the entire study area,we applied the 2010 land cover data for the period of 2010–2012 and the 2015 land cover data for the period of 2013–2015.
Farming data obtained from the Ministry Agriculture and Rural Affairs (http://www.zzys.moa.gov.cn/) were also used in this study. The farming data and the agricultural statistics fromChina Statistical Yearbook(http://www.stats.gov.cn/tjsj/ndsj/) were included (due to missing data,only 35 cities were included). These data included municipal-level and province-level data,which were used to verify the accuracy of the area and yield estimations.
2.3.Methods
The overall process used to extract the rice cultivation area and yield estimation in NEC is illustrated in Fig.1. The main process is as follows:(1) Based on the data for the reference year (2015),the RZAC method was established using a combination of remote sensing data (NDVI,EVI and LSWI),climate factors and phenological data,and then,the rice cultivation area was extracted. (2) Using the methods of the CASA Model and the DHI,we obtained the rice yield in the research years. (3) Based on the results of steps (1)and (2),we analyzed the spatial and temporal dynamics of the rice area and yield.
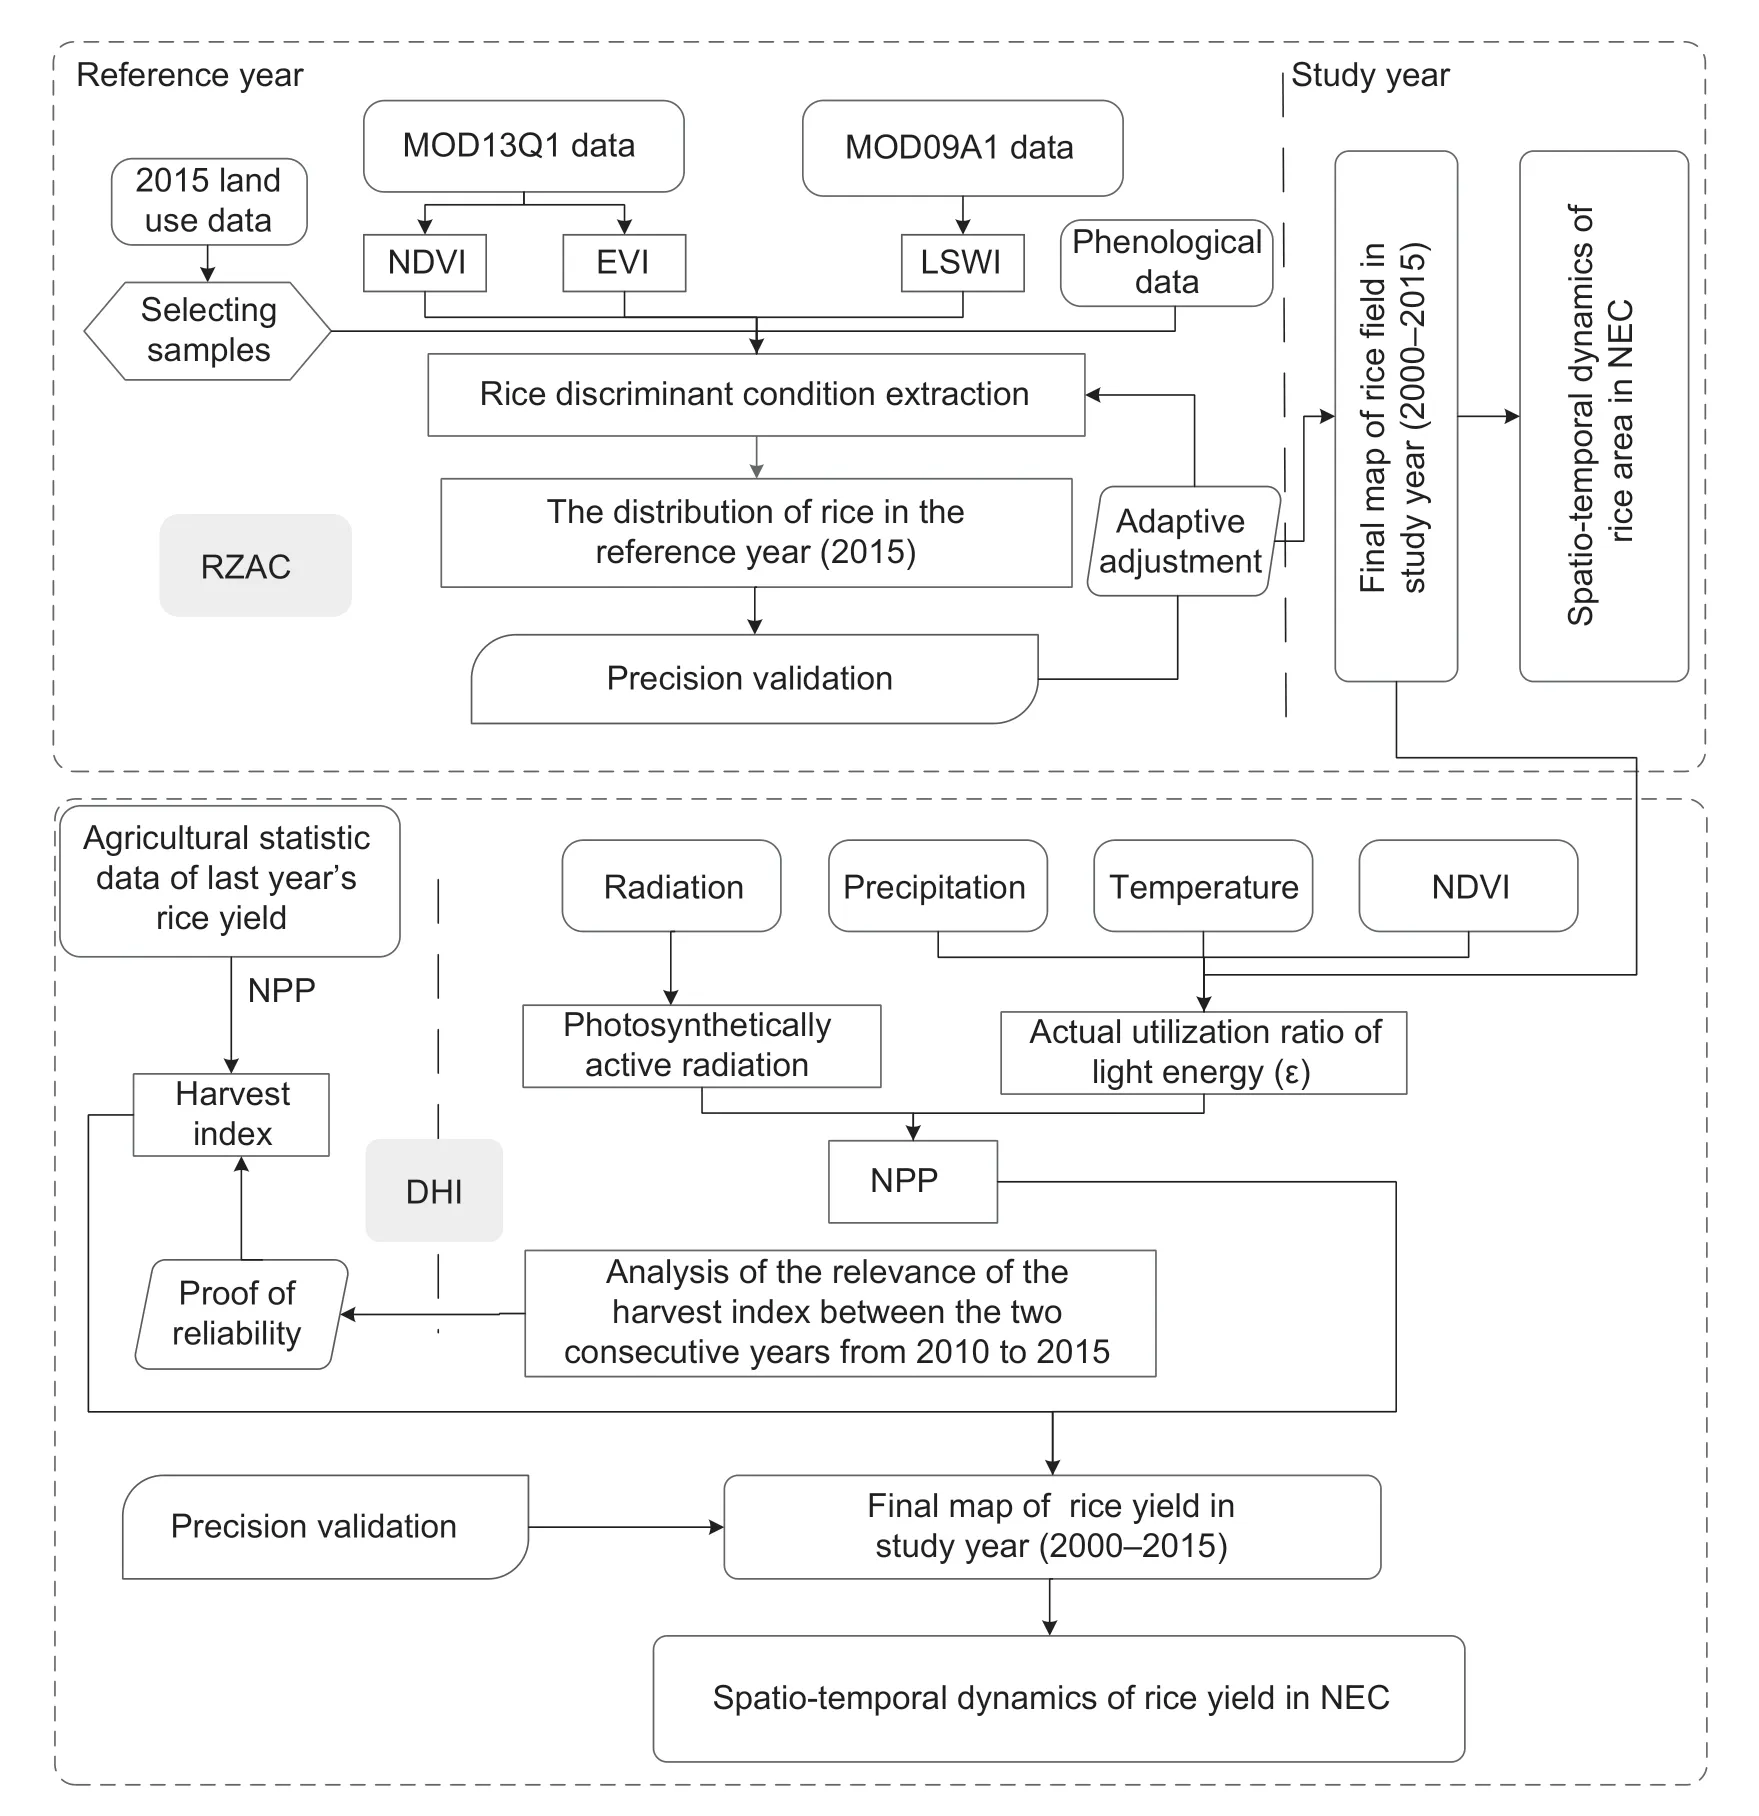
Fig.1 Flowchart of the methodology employed in this study. RZAC,rice zoning adaptability criteria; NDVI,normalized difference vegetation index; EVI,enhanced vegetation index; LSWI,land surface water index; NPP,net primary productivity; DHI,dynamic harvest index; NEC,Northeast China.
Extraction of the rice area based on the MODlS time series indexBased on the land-use data and Google Earth images for 2015,750 samples (rice,150; dry land,150; forest,150; construction land,150; waterbodies,150) were selected through visual interpretation and were individually verified. The NDVI time series curve (Fig.2-A)was constructed using the IDL program after some data processing,such as interpolation and Savitzky-Golay filtering. The rice fields,construction land,forests,and water bodies were easily distinguished using the NDVI.The forests had an annual average NDVI of greater than 0.6,that of the water bodies was less than 0,and that of the construction land was less than 0.2. However,the NDVI could not be used to distinguish between rice fields and dry land (Fig.2-A). Therefore,considering the particular growth characteristics of rice,the EVI and LSWI in the transplanting stage were used to distinguish rice paddies from dry land. Sixteen-day MOD09A1 datasets were used to calculate the LSWI of the rice fields and dry land in this study. The formula is:
whereb2is the near-infrared band (841–876 nm); andb6is the shortwave-infrared band (760–1 000 nm). Xiaoet al.(2006) found that the rice pixels followed the relationship(LSWI+0.05)>EVI in the transplanting stage. Therefore,EVI,LSWI and (LSWI+0.05–EVI) scatter plots were made for the rice and dryland samples (Fig.2-B). The statistical analysis revealed that the rice met the following conditions(95% confidence interval) in the transplanting stage in NEC:
However,the results may include other land-use types,such as permanent water bodies and wetlands,which require further screening and exclusion. The eventual results will be masked by the land-use data that do not include marshes,beaches and permanent water bodies.By combining the specific conditions of the provinces and municipalities in the region,suitable discriminant conditions for each province and municipality were selected as the final extraction results and were extended for the other research years (2000–2014).
Yield estimation using the CASA Model and the DHlThe yield results were mainly obtained by multiplying two factors(eq.(3)):

where NPP was obtained from the CASA Model; HI,harvest index. In this study,the CASA Model was used to estimate the NPP,and the details of the CASA Model can be found in Potteret al.(1993) and Ganget al.(2018). In this study,the HI was calculated based on the ratio of the previous year’s yield to the NPP:
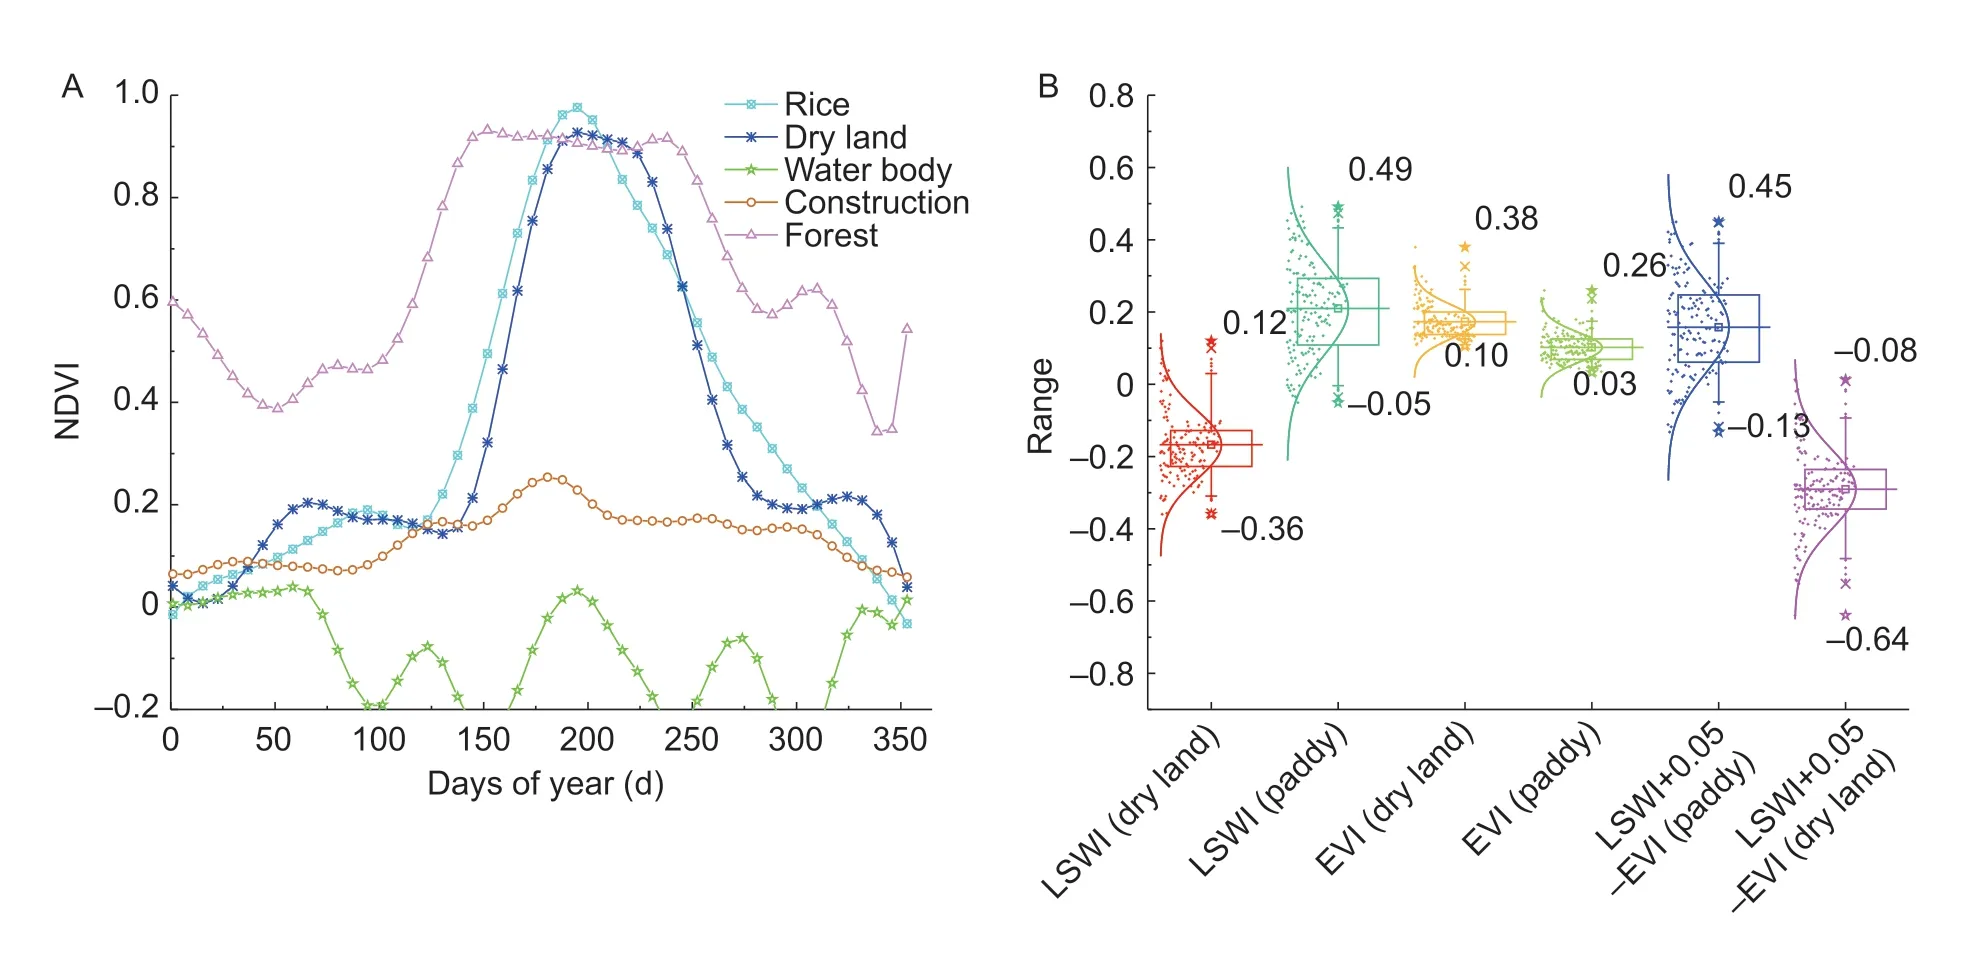
Fig.2 Extraction of the time series normalized difference vegetation index (NDVI) curve and the discriminant conditions for rice.A,NDVI smooth curve. B,ranges of the enhanced vegetation index (EVI) and land surface water index (LSWI) values for dry land and rice sample points. Stars in B represent the maximum and minimum values; cycles represent the 75 and 25% confidence intervals,respectively; lines mean the average values.

whereYieldpreis the rice yield per unit area in the previous year,which was obtained fromChina Statistical Yearbookat the municipal level (http://www.stats.gov.cn/tjsj/ndsj/).
Spatial-temporal analysis methodsThe gravity center of the rice activities is the geographical position where the indices of the rice activity factors (measured for area or yield) reach equilibrium during a certain period. When the rice cultivation area (yield) changes in each period,the rice cultivation (yield) gravity center will shift. When the rice gravity center moves in a certain direction,this indicates that the rice cultivation area (yield) is increasing rapidly in this direction,which contributes to the rice cultivation area(yield) system. The formulas are as follows:

whereXandYrepresent the position of the rice cultivation area (yield) gravity center in yeart;XiandYiare the longitude and latitude coordinates of each rice field pixel,respectively;Aitis the rice cultivation area (yield) of every pixel in yeart;andnis the number of pixels.
3.Results and discussion
3.1.Validation of the methods
Validation of the rice area extractionTable 1 shows that the relative accuracy of the rice cultivation area obtained using the RZAC method reaches 92.92% on average.The relative extraction accuracies for Heilongjiang,Jilin,and Liaoning provinces are 90.26,92.18 and 92.32%,respectively. These findings demonstrate that the results of this study are consistent with the statistical data,which further verifies the high reliability of crop area extraction using remote sensing. We also compared our results with the results of previous studies. The numerical results were similar to those obtained by Zhanget al.(2013) (C*in Table 1) for 2010. Additionally,the spatial distribution of the extraction using MODIS corroborates that obtained by Liet al.(2017) and Zhang Get al.(2015),as well as the rice distribution status of the land-use data. In summary,the RZAC method based on the data for the reference year (2015) can be used to extend to other research years(2000–2014) for the extraction of the rice cultivation area,and the relative accuracy of each province still maintains a high level. Thus,the RZAC method established in this study meets the requirements for the large-scale extraction of the rice cultivation area.
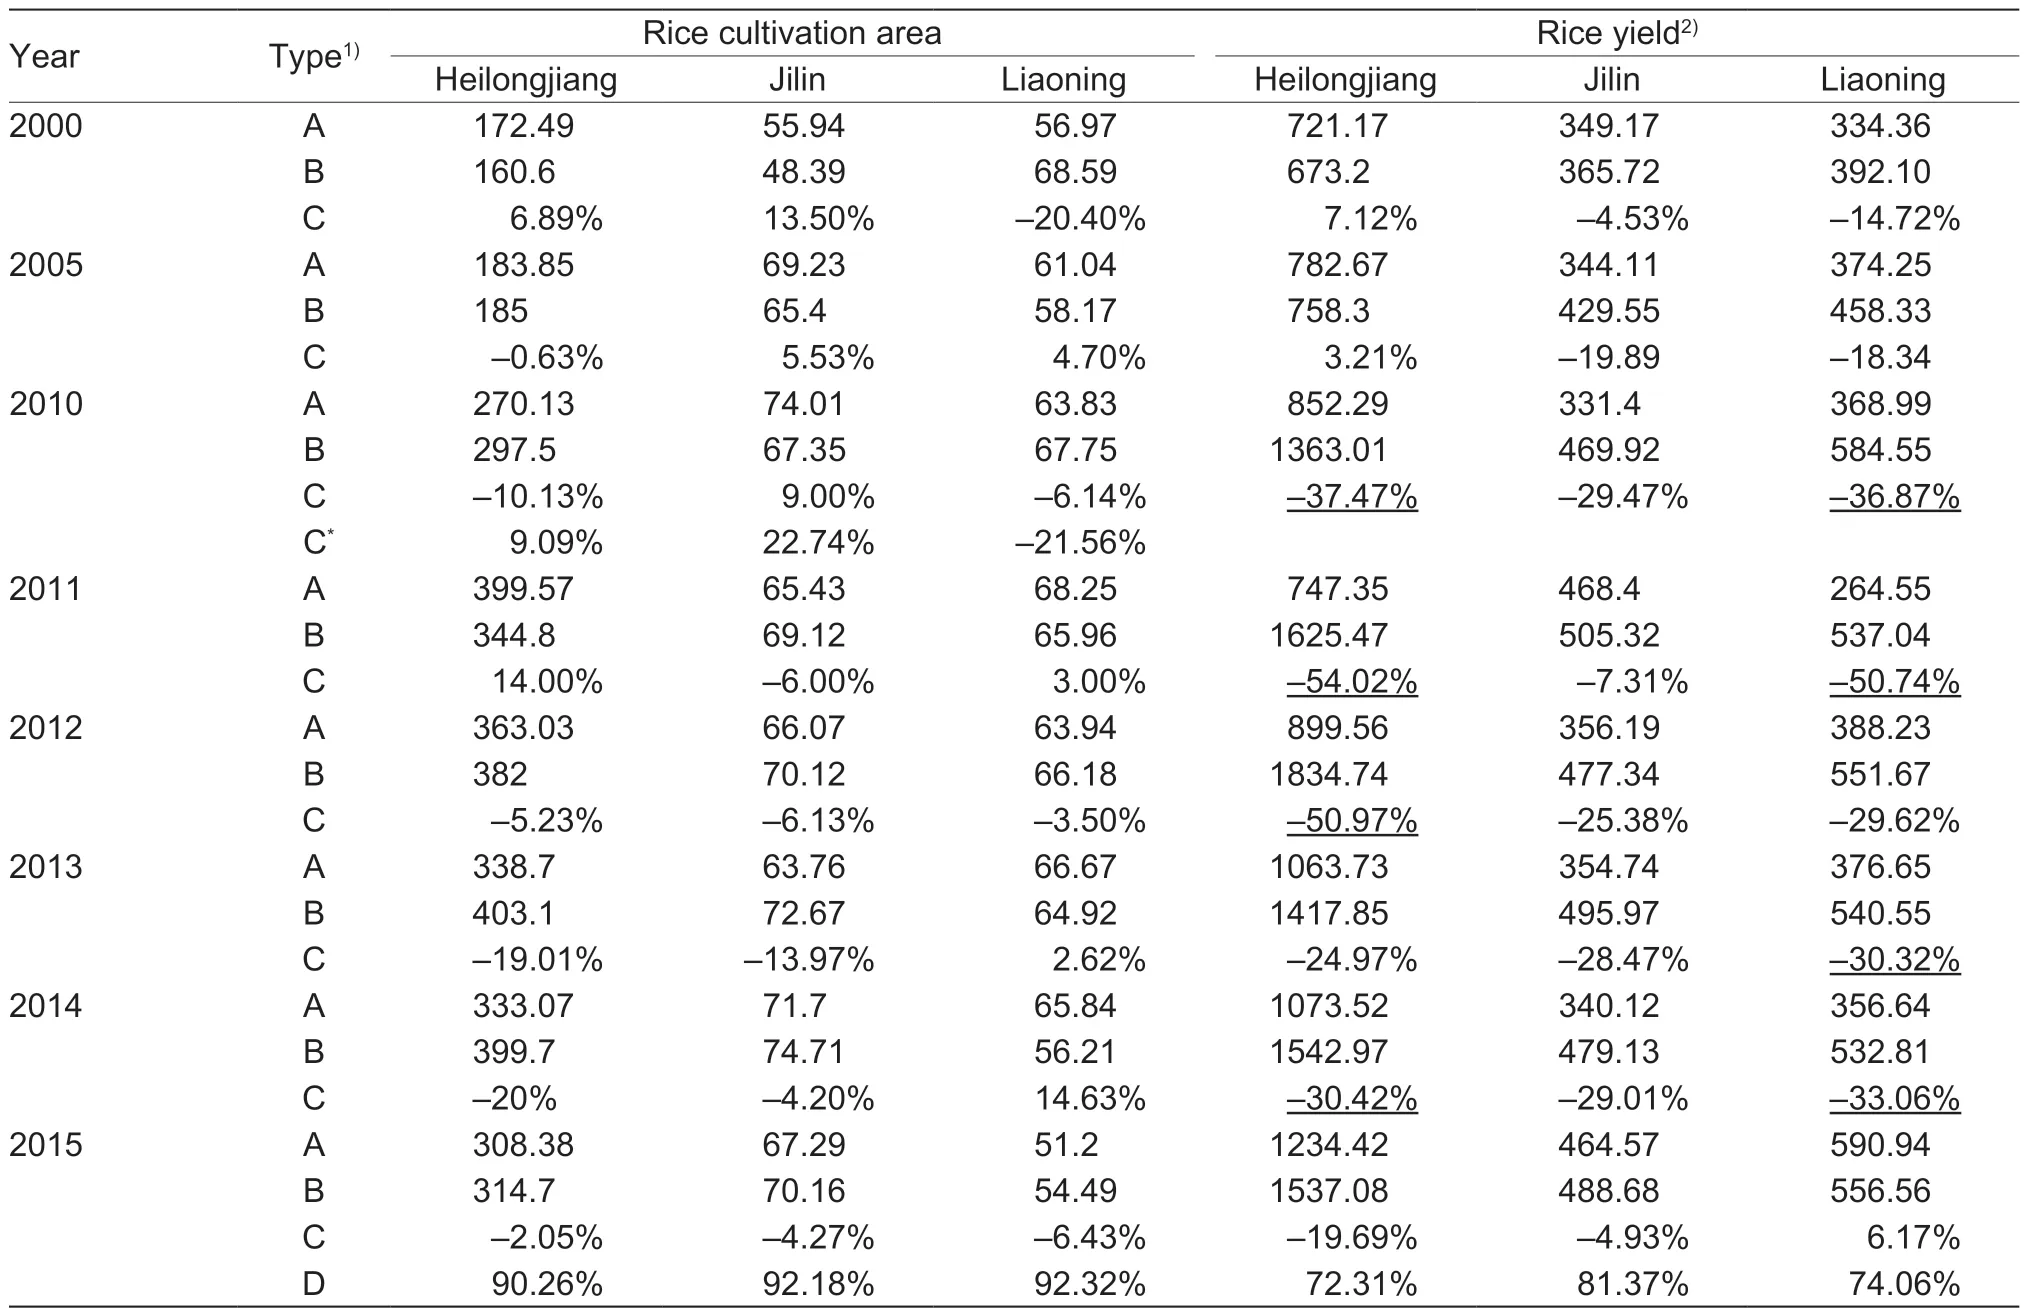
Table 1 Validation of rice area and yield from 2000 to 2015
Validation of the rice yield estimationThe rice yield in NEC was estimated based on the DHI combined with the CASA Model,and the results of this study were verified. The precision verification of theStatistical Yearbookdata and the estimated rice yield results during the research years (Table 2)reveal that the relative error of the rice yield estimation was less than 25% across the entire region. The provincial yield error was greater than 30% in Liaoning Province in 2010,2011 and 2014 and in Heilongjiang Province in 2010,2011 and 2012. The accuracy of 75% of the estimated results exceeds 80% on average,33.3% of which have an accuracy of over 90%. The yield analysis of 35 cities (only 35 cities cultivated rice) in NEC and their accuracy verification (Fig.3;Table 1) shows that the correlation between the estimated yields at the municipal-level and theChina Statistical Yearbookdata is relatively high (R2=0.75). Thus,the yield estimation requirements can be met using the DHI combined with the CASA Model.
Validation of the DHlThe HI indicates the weight of the harvested product as a percentage of the total plant weight. Studies have shown that the HI is consistent across years if the field management is similar. With the development of agricultural technology,large-scale sowing,cultivation techniques,and new crop varieties,the crop HI has increased from 0.3–0.4 to 0.5–0.6 (Hay 1995; Daiet al.2016). However,due to the existence of regional differences,management measures often vary as the region changes. Therefore,the range of the study area is important for ensuring the appropriate use of the HI. In this study,the average rice HI values were 0.54,0.55 and 0.55 for Heilongjiang,Jilin and Liaoning provinces,respectively,which shows that the variation in the HI on the provincial scale was not significant. Therefore,we calculated and validated the rice HI at the municipal scale. The results show that the rice HI at the municipal scale varies and can reflect the differences in field management measures in the different regions. The range of the HI values (0.45–0.65)reveals that the rice HI in NEC did not change significantlyfrom 2000 to 2015 at the municipal scale. Moreover,the correlation between the rice HI across two adjacent years from 2010 to 2015 was very high (Table 2; Fig.4). The average value of the linear Pearson’s correlation coefficient was 0.91,and theR2value was 0.87,which indicates that it is feasible to approximately simulate the HI of this year by using the ratio of the previous year’s yield from theChina Statistical Yearbookand NPP. The results also indicate that the rice tillage system in NEC has not greatly changed in recent years.
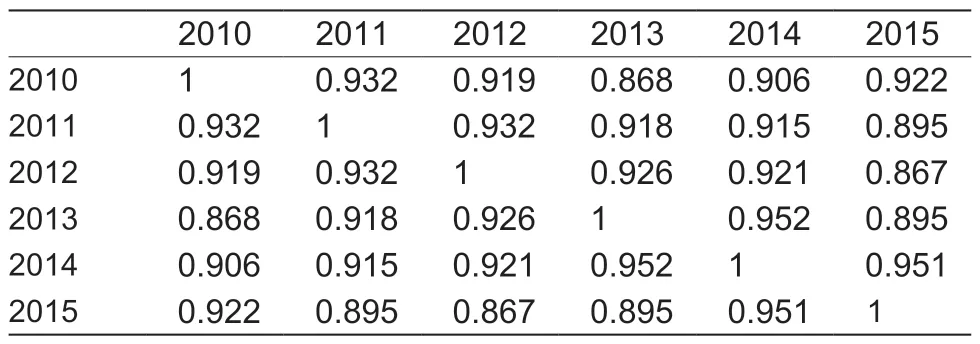
Table 2 Pearson correlation analysis of the harvest index during 2010–2015
3.2.Spatial distribution of the rice activities
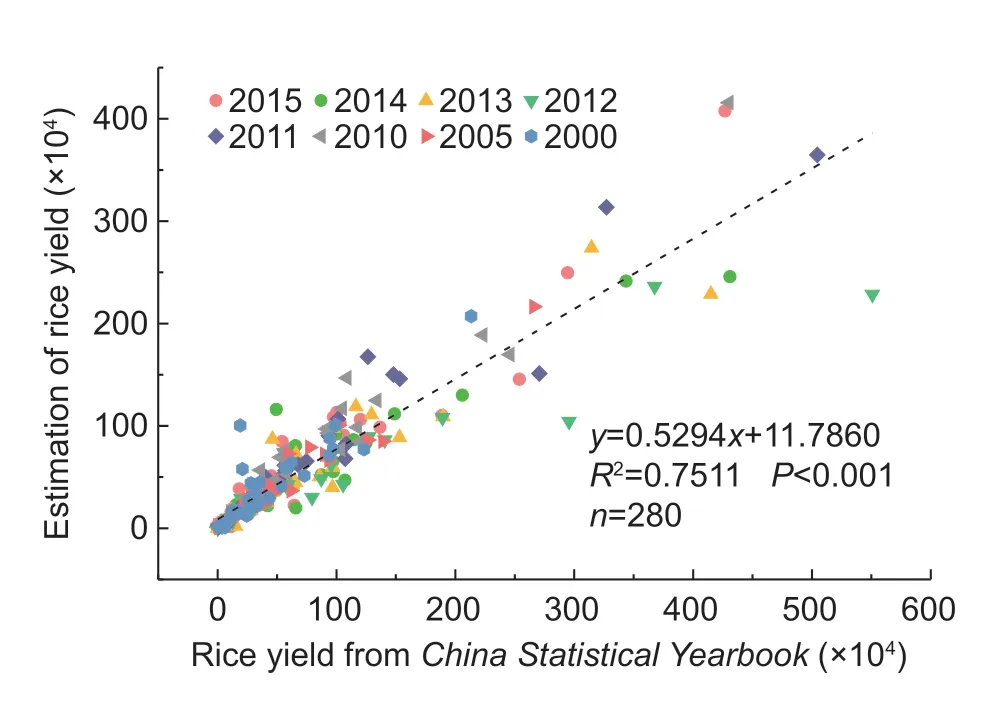
Fig.3 Comparison and verification of the estimated total rice yield and China Statistical Yearbook ((http://www.stats.gov.cn/tjsj/ndsj/)) yield for 35 cities,China.
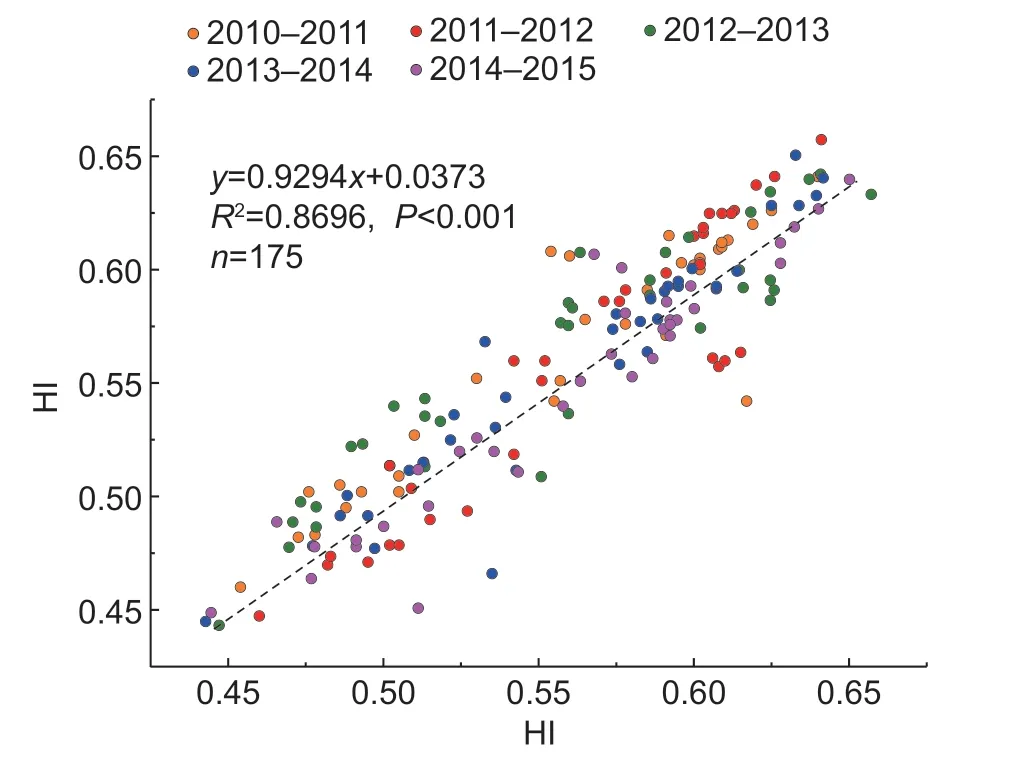
Fig.4 Harvest index (HI) correlation across two adjacent years from 2010 to 2015.
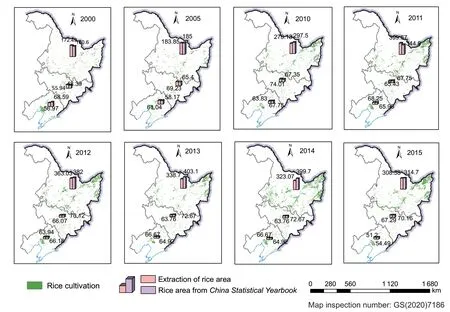
Fig.5 Rice cultivation distribution in Northeast China (NEC) from 2000 to 2015.
Spatial distribution of rice cultivation areaThe spatial pattern of the rice cultivation during 2000–2015 (Fig.5)shows that rice cultivation in NEC has been concentrated on three alluvial plains (the Sanjiang,Songnen and Liaohe plains),which are located along rivers,including the Songhua,Liaohe and Wusuli rivers. Heilongjiang Province has the largest rice field area. The rice cultivation in Liaoning Province is mainly distributed along the Liaohe and Yalu rivers and is concentrated in Panjin,Liaoyang and southeastern Dandong. Most of the rice fields are distributed in regions with elevations of less than 200 m,except for the mountainous regions in the southern part of Jilin Province.These main planting areas have abundant water resources and relatively flat terrain,which is suitable for mechanized farming operations.
Spatial distribution of the rice yieldThe rice yield in NEC exhibited an increasing trend during 2000–2015 (Fig.6).The main high-yield regions have the same distribution of rice cultivation,that is,mainly along rivers. The reasons why the rice yield is higher in Sanjiang,Songnen and Liaohe plains than in other regions is that these regions are rich in water resources and fertile black soil and are managed well.These regions are important yield bases for high-yield and high-quality rice in China. The rice yield in Yichun,Suihua,Jiamusi,Qiqihar,Shuangyashan,and Jixi in Heilongjiang Province is relatively high,with an average yield of 8 000 kg ha–1. This is mainly attributed to the fertile black soil,abundant water and heat,and flat terrain,which is suitable for mechanized farming operations. However,Heihe,the main city in Heilongjiang Province,has a relatively low yield per unit area due to insufficient heat,with an average yield of 6 500 kg ha–1. The cities of Baicheng,Songyuan,Siping,and Changchun in Jilin Province have higher yields,with an average of 8 500 kg ha–1. These areas are located on the Songnen Plain,which is characterized by flat and open terrain,numerous rivers,and good water and heat conditions. The average yield is 6 500 kg ha–1in Yanji and Baishan mainly because the topography and soil conditions are slightly worse than that in the plain areas. The yield in Panjin,Yingkou and Shenyang in Liaoning Province is 8 500 kg ha–1,while Chaoyang,Fuxin,Huludao,and Dandong,which are mountainous areas with poor climatic conditions,have an average yield of 6 500 kg ha–1.
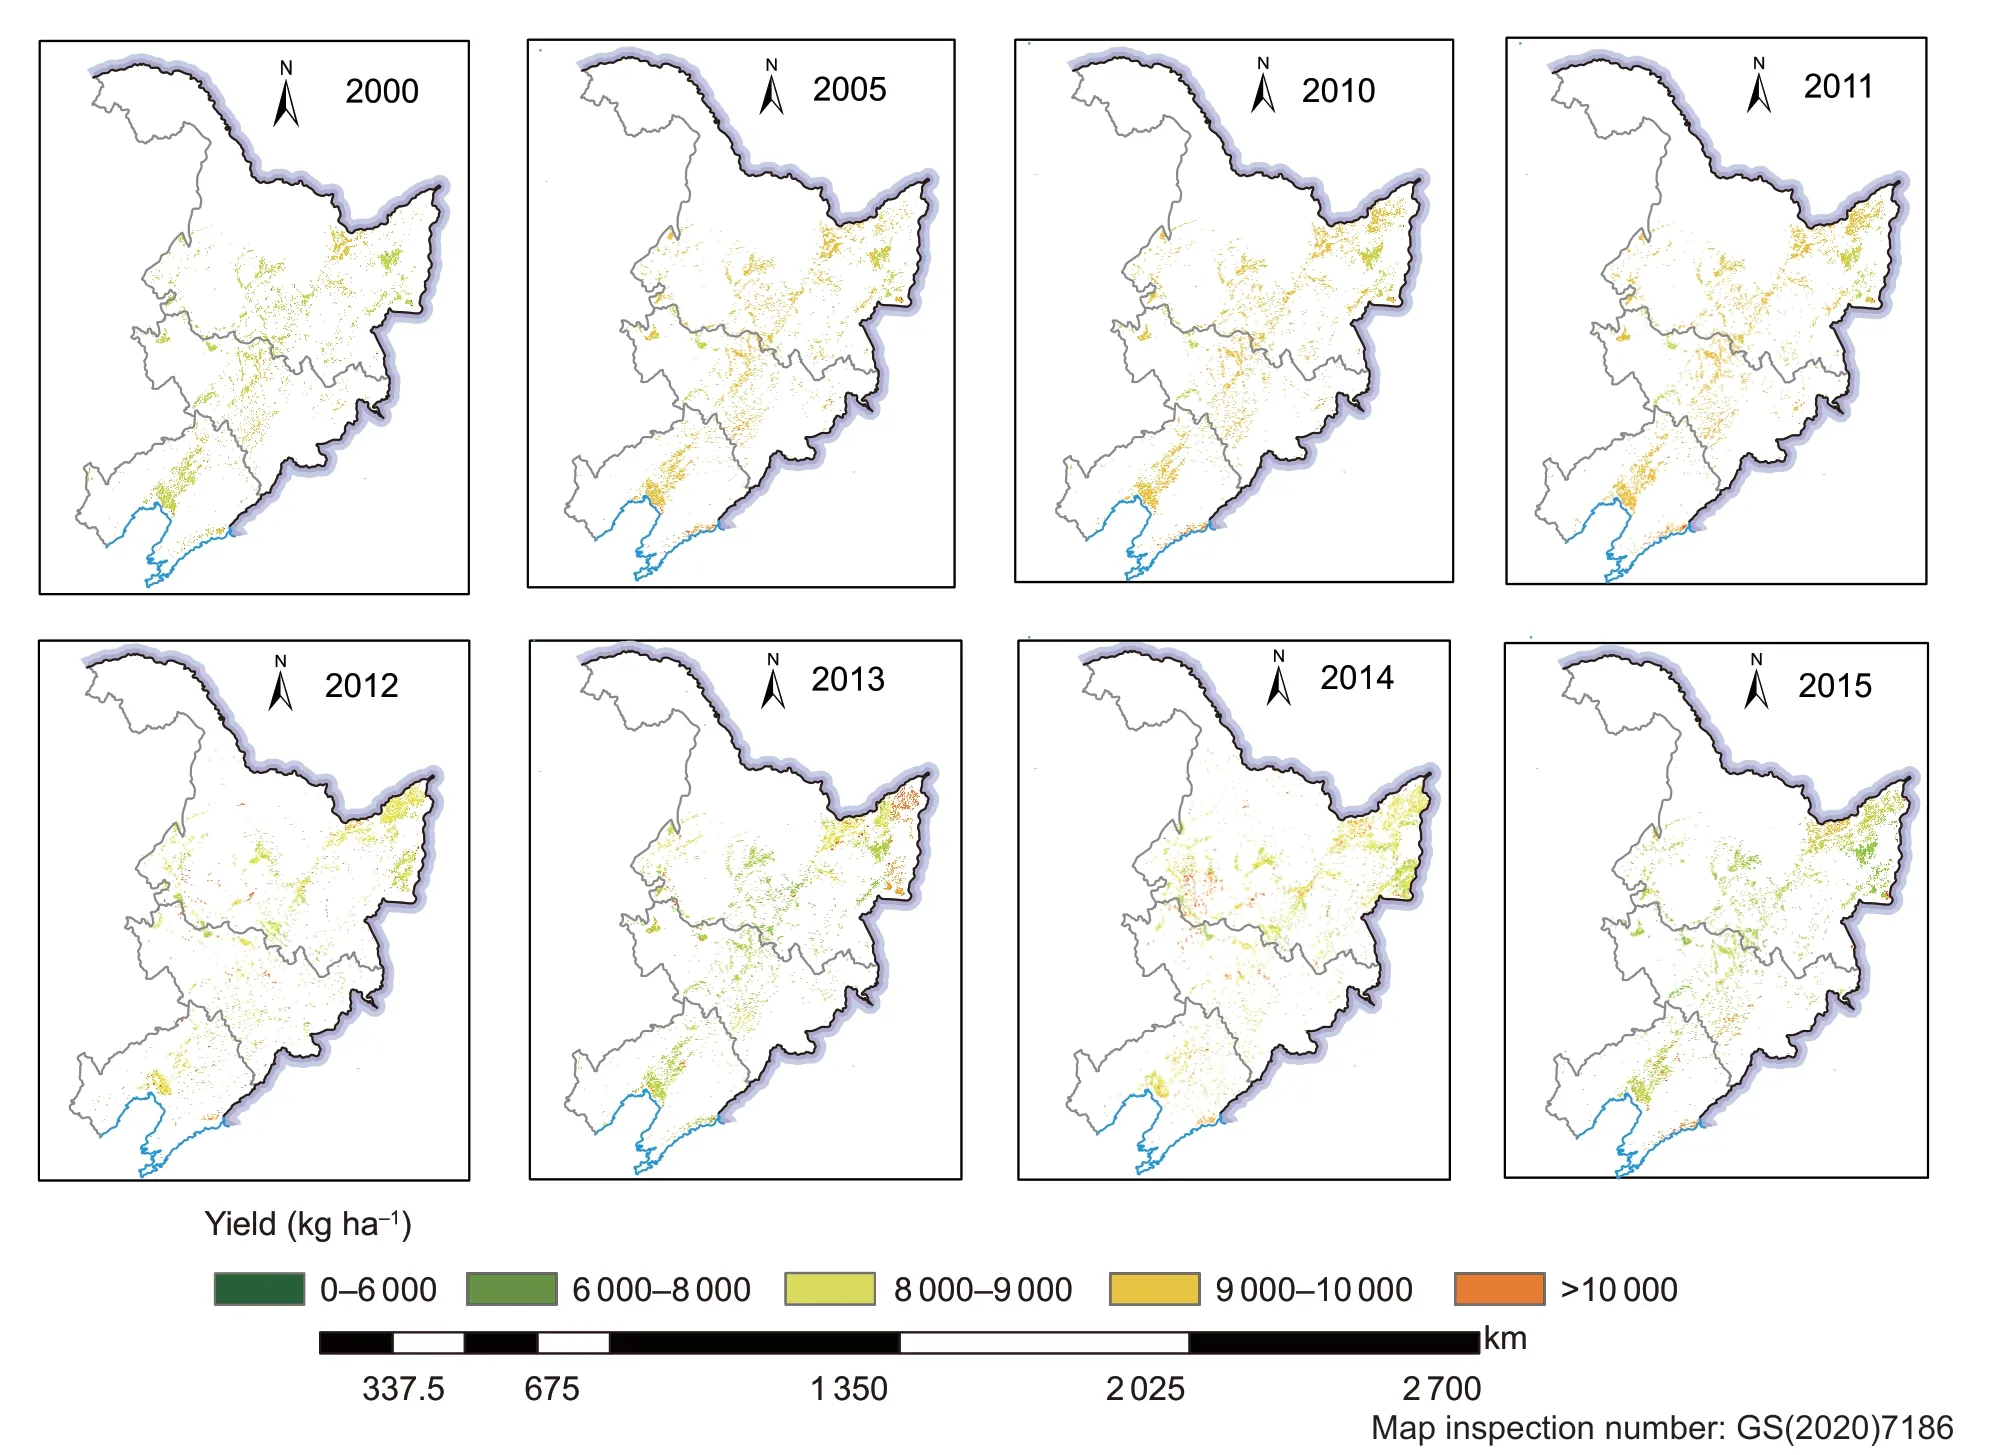
Fig.6 Spatial distribution of the rice yield in Northeast China (NEC) from 2000 to 2015.
Spatial distribution of the HlThe HI is a key factor affecting the yield estimation. Therefore,studying the spatial pattern of the HI is beneficial to establishing the spatial distribution of the yield. Fig.7 shows that the average HI of rice in NEC did not change much from 2000 to 2015,varying from 0.45 to 0.65. These values are consistent with the average HI of rice in NEC obtained by Xieet al.(2011) based on a synthesis of original papers published in China. The different cities exhibit some differences due to variations in climate,soil,rice varieties,and cultivation techniques,which also reflect the scientific and technological level of the crop yield to some extent (Zhang and Zhou 1990; Daiet al.2016; Walteret al.2018). While there are some differences in the HI values of the different cities,the overall difference is not significant. The lower-value areas are mainly distributed in the mountainous areas,which is consistent with the lower rice yield distribution. This indicates that the physical and geographical conditions of these areas are not conducive to large-scale rice yield(Zhang and Zhou 1990). The high-value areas with HI values of greater than 0.60 were mainly distributed in Songyuan,Siping,Shenyang,Panjin,and Yingkou,where there are more plains and good hydrothermal conditions.The average HI of Heilongjiang Province was lower than those of Liaoning and Jilin provinces,which may explain why the per unit area yield of Heilongjiang Province was lower than those of the other provinces.
3.3.Analysis of the rice spatial-temporal patterns
Spatial-temporal variability in rice cultivation areaThe rice cultivation areas on the Sanjiang Plain and the northwestern part of the Songnen Plain in Heilongjiang Province increased significantly from 2000 to 2010. In 2010,the rice cultivation areas in these regions changed significantly compared with those in the 2000. However,the regional distribution of rice cultivation in Jilin and Liaoning provinces remained stable during this period. From 2010 to 2015,the rice cultivation areas in Heilongjiang Province continued to increase,but the rate of increase was slower than that from 2000 to 2010. In contrast,Liaoning and Jilin provinces remained at a stable value. From 2000 to 2015,the rice cultivation areas in Heilongjiang Province increased by 1.36 million ha,that is,an increase of nearly 44.1%. The changes in Jilin and Liaoning provinces were relatively stable. The cultivated area in Jilin Province increased slowly,and there was almost no change in the spatial distribution. The rice cultivation areas in Liaoning Province have exhibited a slight downward trend since 2005,mainly in Panjin along the Yalu River,on the Liaohe Plain,in the northwestern part of Yingkou.
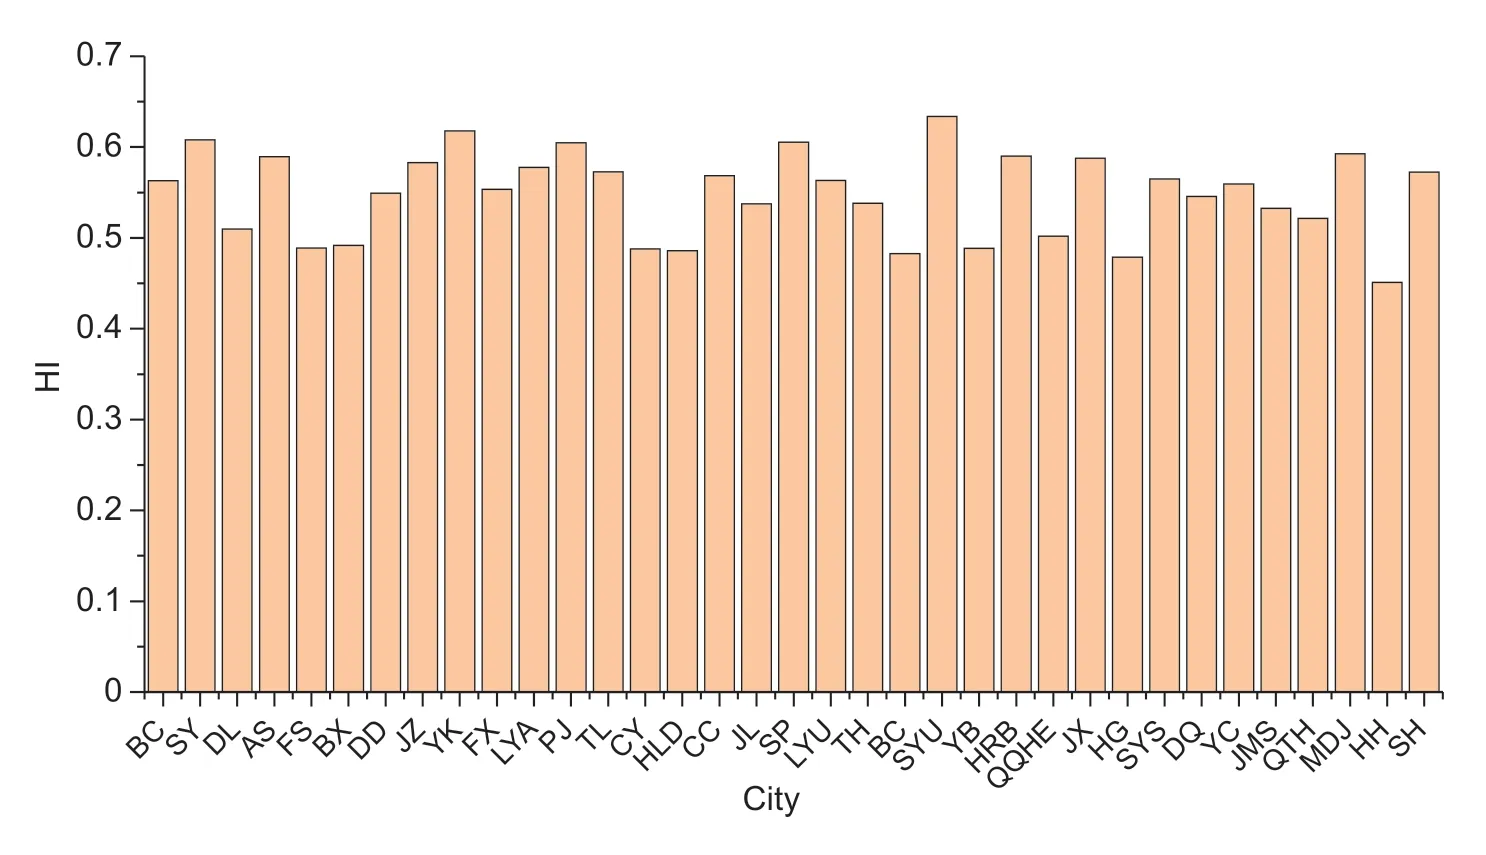
Fig.7 The average harvest index (HI) in different cities of Northeast China. BC,Baicheng; SY,Shenyang; DL,Dalian; AS,Anshan; FS,Fushun; BX,Benxi; DD,Dandong; JZ,Jinzhou; YK,Yingkou; FX,Fuxin; LYA,Liaoyang; PJ,Panjin; TL,Tieling; HLD,Huludao; CC,Changchun; JL,Jilin; SP,Siping; LYU,Liaoyuan; TH; Tonghua; BS,Baishan; SYU,Songyuan; YB,Yanbian; HRB,Harbin; QQHR,Qiqihar; JX,Jixi; HG,Hegang; SYS,Shuangyashan; DQ,Daqing; YC,Yichun; JMS,Jiamusi; QTH,Qitaihe; MDJ,Mudanjiang; HH,Heihe; SH,Suihua.
Based on the extracted rice area in NEC,we analyzed the characteristics of the spatial changes in the rice cultivation distribution. Our results indicate that the changes in the gravity center of the rice cultivation area were significant from 2000 to 2015 (Fig.8-B). The rice cultivation was focused in Jilin Province during 2000–2013,but it shifted to Harbin in Heilongjiang Province in 2014. Many studies have demonstrated that the rice cultivation area and spatial distribution in NEC have changed significantly,with the rice cultivation area expanding eastward and northward significantly (Zhang Get al.2015; Liet al.2017). The results of this study also demonstrate that the center of the rice distribution shifted northward and eastward,with an offset distance of 107 km during 2000–2015. The reason the gravity center was further south in 2000 was mainly that the amount of rice cultivation in Heilongjiang Province was lower in 2000,while the amounts of rice cultivation in Jilin and Liaoning provinces were relatively greater. This resulted in the rice gravity center being located at a slightly lower latitude. The trajectory of the rice gravity center in NEC reflects the spatial evolution of the rice cultivation. The superior environment of Heilongjiang Province,such as the flat terrain,high light and heat,and sufficient water,result in this region becoming a core geographical area for rice cultivation. However,global warming has made the natural conditions more suitable for increased rice planting in the high-latitude regions (Liet al.2017).
Spatial-temporal variability in rice yieldThe rice yield in the study area increased from 13.86 to 25.82 million tons from 2000 to 2015,which is an increase of nearly 90%.Fig.9 shows that the rice yield in Jilin and Liaoning provinces was relatively stable,and it even decreased in some cities,while a spike in yield occurred across Heilongjiang Province,especially in Harbin,Hegang,Jiamusi,and Yichun,especially from 2000 to 2013. The changes in the rice yield in NEC were relatively slow from 2000 to 2005.The increase rates of the rice yield in Heilongjiang,Jilin and Liaoning provinces were 12.64,16.89 and 17.45%,respectively. From 2005 to 2012,the rice yield increased rapidly,especially in Heilongjiang Province,and the output increased by 10.76 million tons,with an increase rate of 141.95%. However,the rice yield has decreased since 2012,which was the lowest value until 2013. The historical data indicate that the rice yield suffered from chilling injury in Heilongjiang Province during 2012 and 2013 (Gao 2016),and the temperature was lower than that in previous years,resulting in a decline in yield in 2013. Since 2013,the rice yield in Heilongjiang Province has been stable,whereas the overall trend has increased. The rice yield in Jilin and Liaoning provinces has remained stable since 2010.The history of rice cultivation in Heilongjiang Province is short,and the superior conditions,high quality and large export output of this region have generated consumer interest,which has stimulated the enthusiasm of some rice producers,leading to a peak in rice yield and an increase in cultivation area and yield.
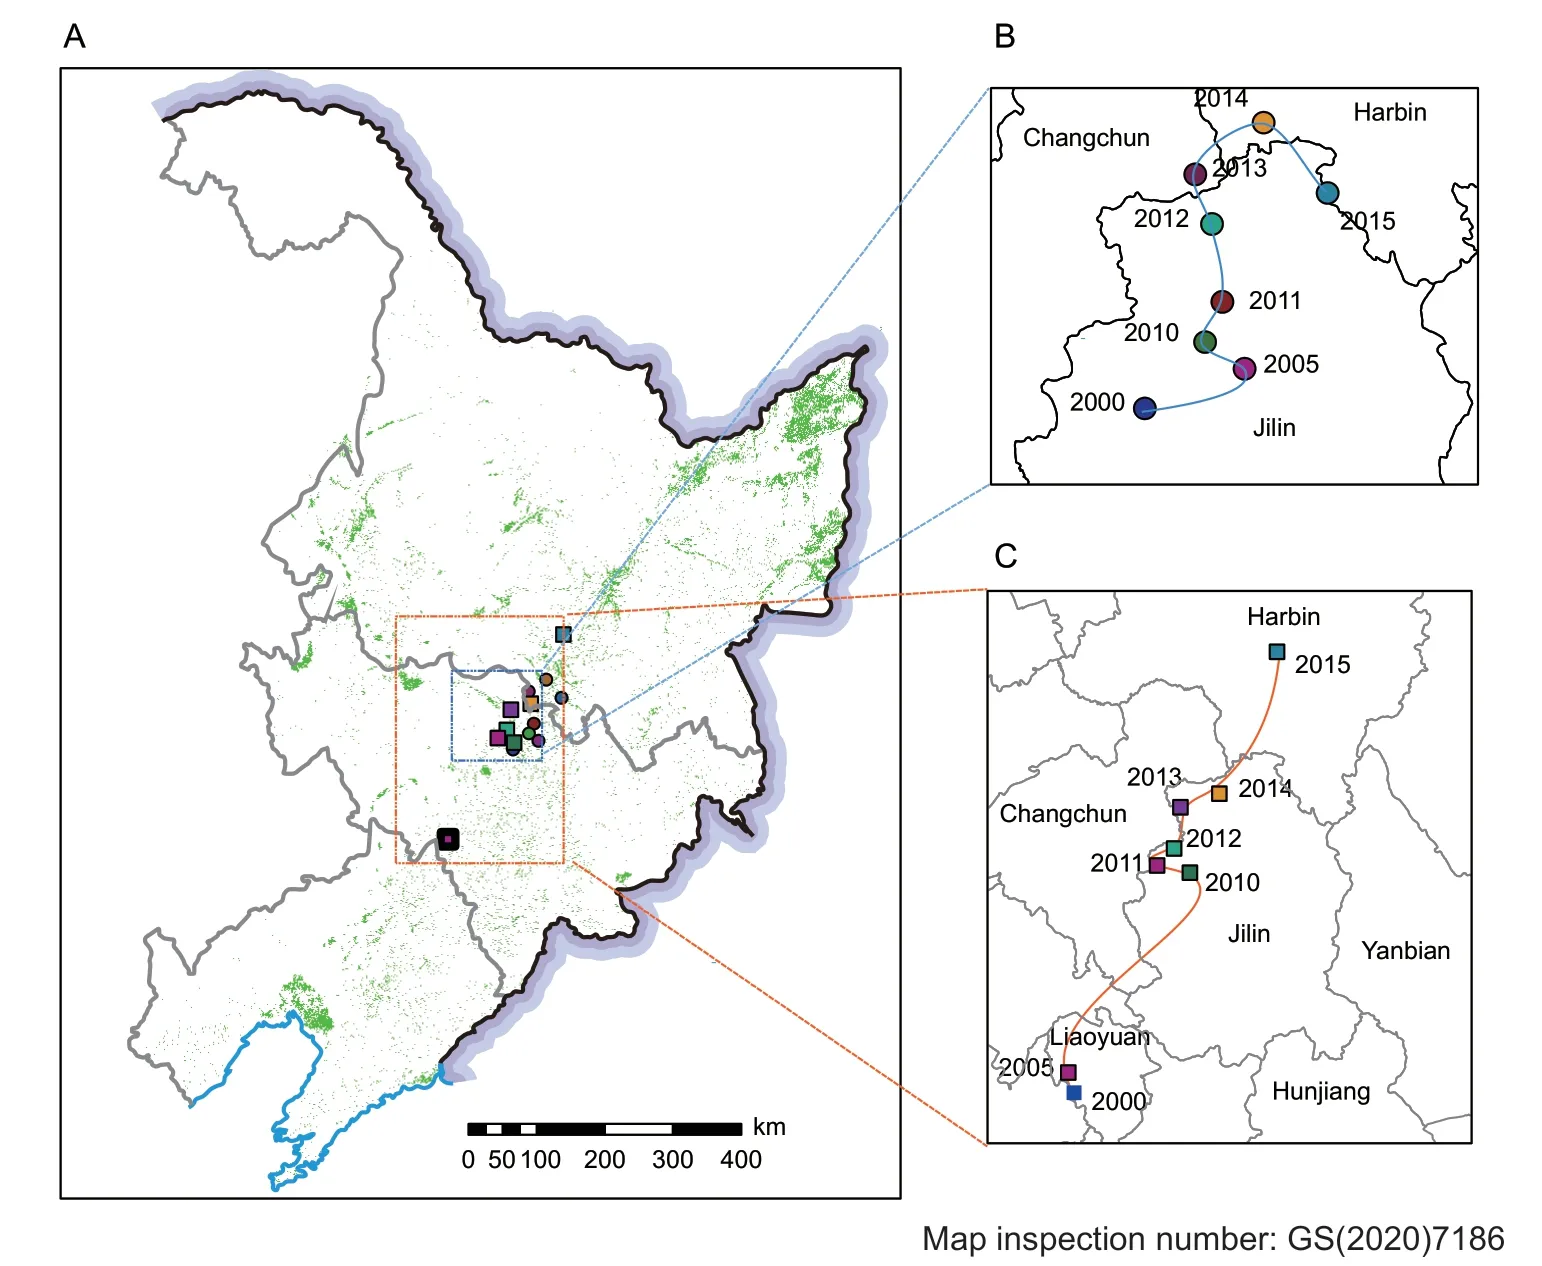
Fig.8 The changing trend of the rice gravity center in Northeast China from 2000 to 2015. A,overall trends in rice cultivation and yield; the baseline map (green) represents the rice planting in 2015. B,gravity center of the rice cultivation. C,gravity center of the rice yield.
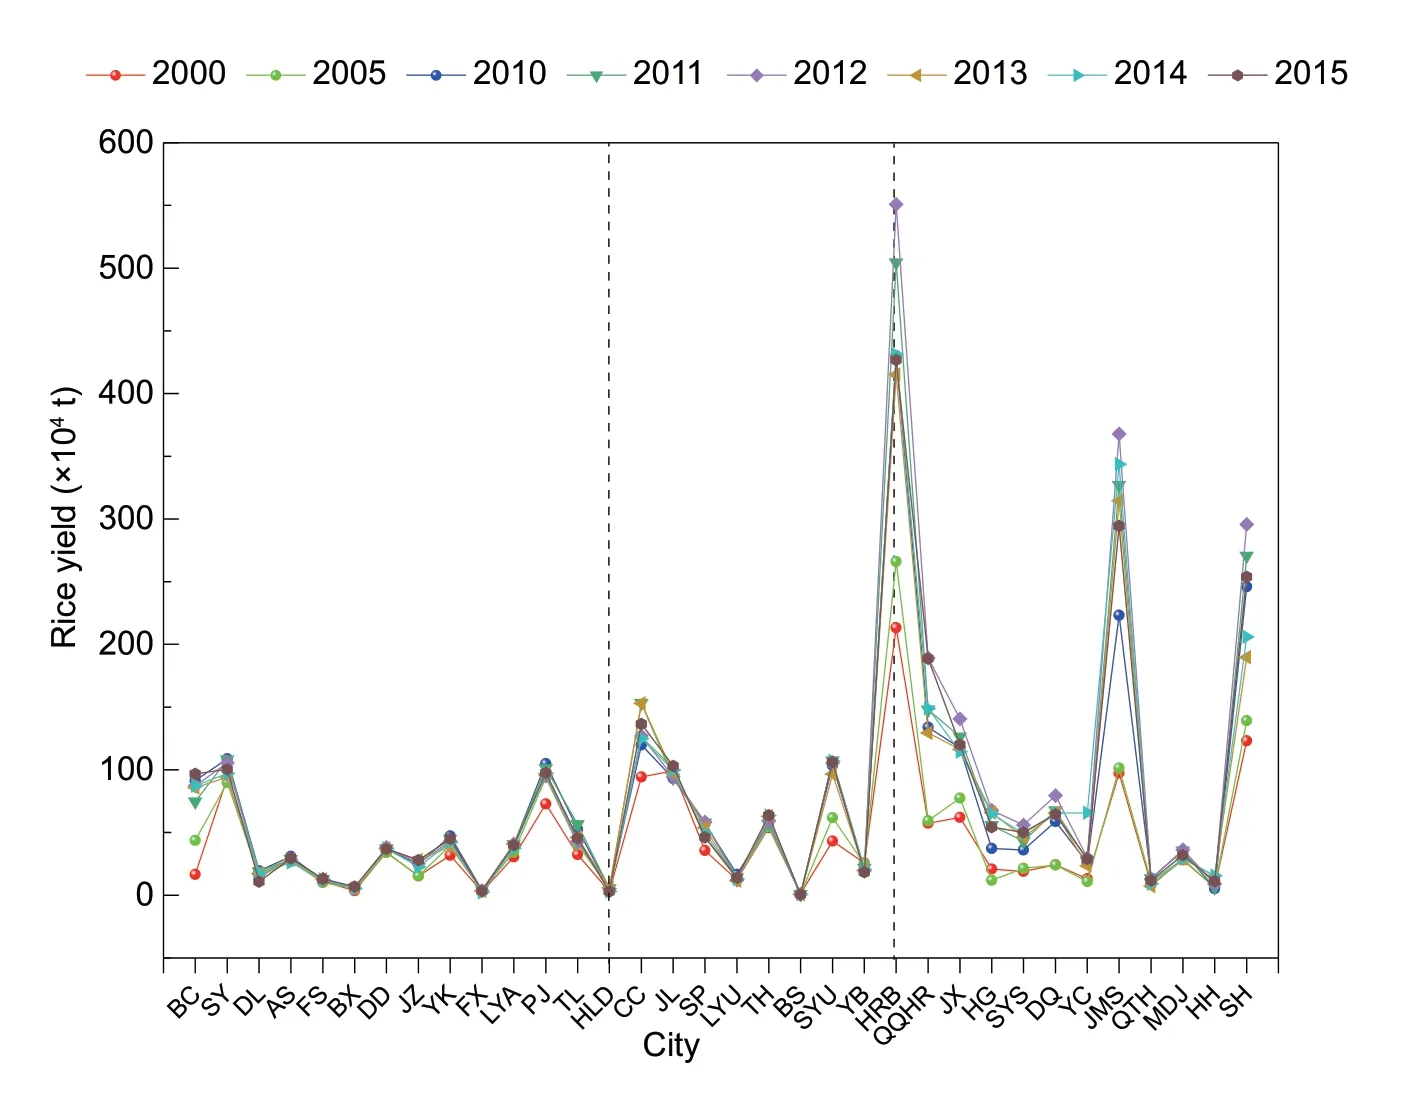
Fig.9 Variation in the rice yield in the cities of Northeast China with values during 2000–2015. BC,Baicheng; SY,Shenyang;DL,Dalian; AS,Anshan; FS,Fushun; BX,Benxi; DD,Dandong; JZ,Jinzhou; YK,Yingkou; FX,Fuxin; LYA,Liaoyang; PJ,Panjin;TL,Tieling; HLD,Huludao; CC,Changchun; JL,Jilin; SP,Siping; LYU,Liaoyuan; TH,Tonghua; BS,Baishan; SYU,Songyuan;YB,Yanbian; HRB,Harbin; QQHR,Qiqihar; JX,Jixi; HG,Hegang; SYS,Shuangyashan; DQ,Daqing; YC,Yichun; JMS,Jiamusi;QTH,Qitaihe; MDJ,Mudanjiang; HH,Heihe; SH,Suihua.
It is evident that the trend in the gravity center of the rice yield in NEC is similar to that of the rice cultivation area from 2000 to 2015 (Fig.8-C). For all of the regions,the rice yield distribution generally shifted about 358 km to the northeast from 2000 to 2015. The rice yield was localized in Liaoning Province from 2000 to 2005,but it had shifted to Jilin Province by 2010. The focus moved westward and northward from 2010 to 2013. After this,it shifted northeast into Jilin Province from 2013 to 2014. Remarkably,from 2010 to 2014,the gravity center of the rice yield was located at and 45–46°N and 126–127°E. However,it moved to Harbin in Heilongjiang Province from 2014 to 2015.This mainly occurred because the rice cultivation area in Heilongjiang Province was low in 2000,and the total yield was lower than that in Liaoning Province. Importantly,a drought occurred in Heilongjiang from 1999 to 2003,and 2003 was a particularly bad year (Yanget al.2016; Guoet al.2017). Furthermore,there a natural chilling injury occurred in 2012 and 2013,which seriously affected the yields of the crops,including rice (Gao 2016). After 2005,the rice yield gravity center shifted northward due to the large-scale increase in rice cultivation in the northern-central part of NEC,especially on the Sanjiang Plain in Heilongjiang Province. These results indicate that the rice area was an important factor affecting the increase in the rice total yield.The trajectory of the rice gravity center in NEC reflects the spatial evolutionary process of the rice yield. While the implementation of beneficial policies,such as rice planting technology,the cultivation of new high-yield rice varieties and national subsidies,have improved the rice yield and quality (Houet al.2019).
3.4.Uncertainty
The large number of mixed pixels caused by the mixture of rice and dry land,the limited spatial resolution of the remote sensing image data,and the planting structure of the crops in NEC are represented in the image; and all of these factors affected the simulation results of the rice cultivation and yield. Furthermore,due to the differences in temperature,precipitation and topography in NEC,the phenological periods of the rice are somewhat different. Therefore,regional differences in the growth and transplanting periods of the rice exist. In this study,a fixed transplanting period (when the DOY was 137 to 145) was used in the area extraction. Although the errors are acceptable,this method still results in systematic errors in the extraction results. Regarding the municipallevel accuracy,the error is transferable because of the differences in the input data and the area data extracted as described in Section 3.1,which results in error accumulation during the yield estimation. Furthermore,this study mainly relied on statistical data to verify the extracted rice area without field visits or the use of highresolution remote sensing images for greater system validation. These deficiencies need to be addressed in a follow-up study to improve the monitoring accuracy of rice cultivation activities in NEC and to enhance the reliability and availability of the research results.
4.Conclusion
In this study,an improved regional parametric syntheses approach (RZAC-DHI) was used to determine the rice cultivation area and yield in NEC from 2000 to 2015. The RZAC method used integrated NDVI,EVI and LSWI data to extract the rice cultivation area. The rice yield was calculated by multiplying the NPP and DHI. The statistical data for the rice area and yield were used to validate the simulated results at the municipal level,following which the geographic characteristics of the spatial-temporal distributions of the rice cultivation area and yield were analyzed. The results show that the RZAC and DHI can effectively support the yearly mapping of the rice cultivation area and yield in NEC. It is feasible to approximately simulate the HI of a given year using the yield and NPP ratio fromChina Statistical Yearbookof the previous year(http://www.stats.gov.cn/tjsj/ndsj/). In particular,the slight change in the DHI indicates that the tillage system of the rice cultivation in NEC has not changed significantly in recent years. The average precision of the rice cultivation area and yield exceeded 90 and 80%,respectively. Large-scale rice cultivation occurs on the Sanjiang,Songnen and Liaohe plains and along both sides of the rivers in these plains. The rice cultivation area and yield in NEC increased significantly from 2000 to 2015,and the overall distribution of the rice cultivation changed significantly. The proportion of growth in the north was greater than that in the south. Heilongjiang Province gradually became the primary rice cultivation region,while Jilin and Liaoning provinces changed only slightly. The gravity center of the rice cultivation area and yield exhibited northward and eastward expansion,and the northward migration became increasingly obvious.Importantly,the methods and conclusions of this study not only can be used as a basis for modeling crop area and yield,but also can provide a reference for regional rice cultivation structure adjustment,food security assessment,resource management,and grain policy-making.
Acknowledgements
This work was supported by the National Key Research and Development Program of China (2016YFD0300110 and 2016YFD0300101),the Agricultural Science and Technology Innovation Program of Chinese Academy of Agricultural Sciences (CAAS-ASTIP-2016-AII) and the Science and Technology Project of Xinjiang Production and Construction Corps,China (2019AB002).
杂志排行
Journal of Integrative Agriculture的其它文章
- Yield gap and resource utilization efficiency of three major food crops in the world -A review
- Reducing maize yield gap by matching plant density and solar radiation
- Cultivar selection can increase yield potential and resource use efficiency of spring maize to adapt to climate change in Northeast China
- Effects of different agricultural treatments on narrowing winter wheat yield gap and nitrogen use efficiency in China
- Determination of soybean yield gap and potential production in Iran using modeling approach and GIS
- Developing a process-based and remote sensing driven crop yield model for maize (PRYM–Maize) and its validation over the Northeast China Plain
