Settling,consolidation and shear strength behaviour of coal tailings slurry
2020-12-20ShrifulIslmDvidWillimsMreloLlnoSernChenmingZhng
Shriful Islm,Dvid J.Willims ,Mrelo Llno-Sern ,Chenming Zhng
a School of Civil Engineering,The University of Queensland,Queensland 4072,Australia
b Department of Civil and Environmental Engineering,Shahjalal University of Science and Technology,Sylhet 3114,Bangladesh
c Geotechnical Engineer,Klohn Crippen Berger Ltd.,Queensland 4101,Australia
ABSTRACT The volume change and shear strength behaviour of tailings slurry with the changes in gravimetric moisture content is important to effectively utilise the storage volume and analysis of dam failure potential.Consolidation testing of tailings from a slurry-like to soil-like state is a critical task,and conventional consolidation apparatus does not have the capability of doing such testing,as the tailings slurries contain high water content.Settling tests conducted on slurries having a 25% solids concentration showed very low efficiency;final sediment was still slurry-like.An intrinsic point was identified based on pore water pressure dissipation during consolidation tests in a slurry consolidometer that can define two states of the tailings i.e.slurry-like and soil-like.In the slurry-like state,the volume change was greater for Slurry 2 than Slurry 1,while the inverse was observed in the soil-like state.The evolution of peak vane shear strength with the changes in moisture content was almost similar for both samples and obeyed the power function.Regression models have been developed and validated to predict the shear strength of materials at any gravimetric moisture content or void ratio.
Keywords:Settling Consolidation Vane shear strength Coal tailings slurry Slurry consolidometer
1.Introduction
During coal production,water is used for grinding and mine processing,generating fine-grained byproducts called tailings which are often stored in tailings storage facilities (TSFs) in the form of slurry[1,2].Upon disposal,tailings go through suspension,sedimentation and consolidation[3–6].Understanding the consolidation behaviour of soft tailings is required for their effective disposal and management.As such,analyses of the consolidation and strength behaviour of tailings are essential to improve their resistance against erosion,the stability of dam dykes containing tailings,and the efficient operation of TSFs [6–8].
Driven by gravity,the particles in a slurry with a low solids concentration may settle,while clay minerals in tailings may remain suspended in water for extended periods[9,10].A high surface area to volume ratio of clay particles enables high interactions between themselves and with water in the slurry,reducing the settling velocity[11].Settling column tests have shown a denser sediment at the bottom of the column with decreasing density towards the tailings surface [12–15].For instance,a settling test on a coarse coal tailings slurry with an initial solids content of 23% in a slurry consolidometer cell generated sediment with a solids content of 53%,and the average void ratio changed from 5.4 to 1.4 [14].
Consolidation is a process that helps explain the decrease of geomaterials volume with the migration of pore water outside of the volume of interest.It generates effective stress,facilitating the packing of solids on a denser fabric.The self-weight consolidation of fine tailings usually takes long periods of time.A convenient technique used on the field and in laboratory experiments is the application of an external load to accelerate the consolidation process.Tailings with a high gravimetric moisture content and high compressibility undergo large settlement.Indraratna et al.and Shokouhi et al.have used oedometer testing to assess the consolidation of coal tailings [16,17].It is noted,however,that conventional oedometer compression method has limitations for materials at the slurry-like stage of the consolidation of soft tailings(i.e.the application of the top load squeezes out the fines with water through the cell wall and top cap)[18].Slurry consolidometer testing offers the advantage of observing the phase change during the consolidation of soft slurried tailings from a slurry-like to solid-like state [19–26].However,it has been demonstrated that the larger specimen height in a slurry consolidometer generates friction between the specimen and cell wall.Recently,a large stress-controlled slurry consolidometer device and procedure has been developed aimed to determine the friction loss [14,27].
Stability assessment of a TSF requires reliable estimates of the strength parameters of tailings.For example,it is widely known that the undrained shear strength of mine tailings and remoulded clay increases with a decrease in water content[28–30].The laboratory vane shear test is a simple yet effective method to determine the undrained shear strength of soft to stiff cohesive soils[29,30].Numerous studies using this method have been carried out to investigate the shear strength of natural soils,specifically for determining the undrained shear strength of clayey soil.The intrusive nature of the vane shear method allows the testing of tailings at high water content,compared to element tests where a sample needs to be transferred to a triaxial cell.Despite the omission of contributing confining stress into material strength,researchers have used and highlighted the reliability of the vane shear test in many applications [29,31–34].
Conventional soil characterisation techniques focus on the characterisation of tailings behaving at solid stages.However,traditional mining techniques result in the production of tailings ranging from slurry-like to solid-like consistency.Hence,the implementation of a testing technique that is able to reproduce consolidation stages,starting from a slurry condition,and to describe the transition into a solid stage,is advantageous.As such,a slurry consolidometer was used to carry out a consolidation experiment on tailings slurry at the same consistency achieved in a settling test.Although a vast number of studies investigated the improvement of the geotechnical properties of coal mine waste,the consolidation of fine-grained coal tailings slurry and its relationship with shear strength characteristics is still a challenge[14,27,35–37].This contribution aims to evaluate the settling and consolidation parameters of slurried coal tailings and the behaviour of vane shear strength with changes in the consistency of slurried coal tailings.
2.Physical and chemical properties of the tailings tested
2.1.Physical properties
Two thickener underflow coal tailings samples generated from a coal processing plant were adopted for analysis and were named as Slurry 1 and Slurry 2.Particle size distributions using wash sieve analyses and hydrometer studies were carried out for samples down to a 75 μm sieve and finer than 75 μm,respectively[38,39].The results of the grain size analyses are presented in Fig.1.Slurry 1 contains 4% more sand-sized particles than Slurry 2,while Slurry 2 includes 12%more silt-sized particles than Slurry 1 (Table 1).
Table 1 shows the physical properties of the coal tailings samples.Using a helium pycnometer,the specific gravity of the samples is lower than the typical value of similar fine-grained clayey soil,suggesting the presence of high proportions of carbonaceous materials.As a comparison,the specific gravity of Jeebropilly coal tailings,Westcliff coal tailings,and Kentucky coal refuse were 1.90,2.03,and 2.03,respectively [16,17,40].
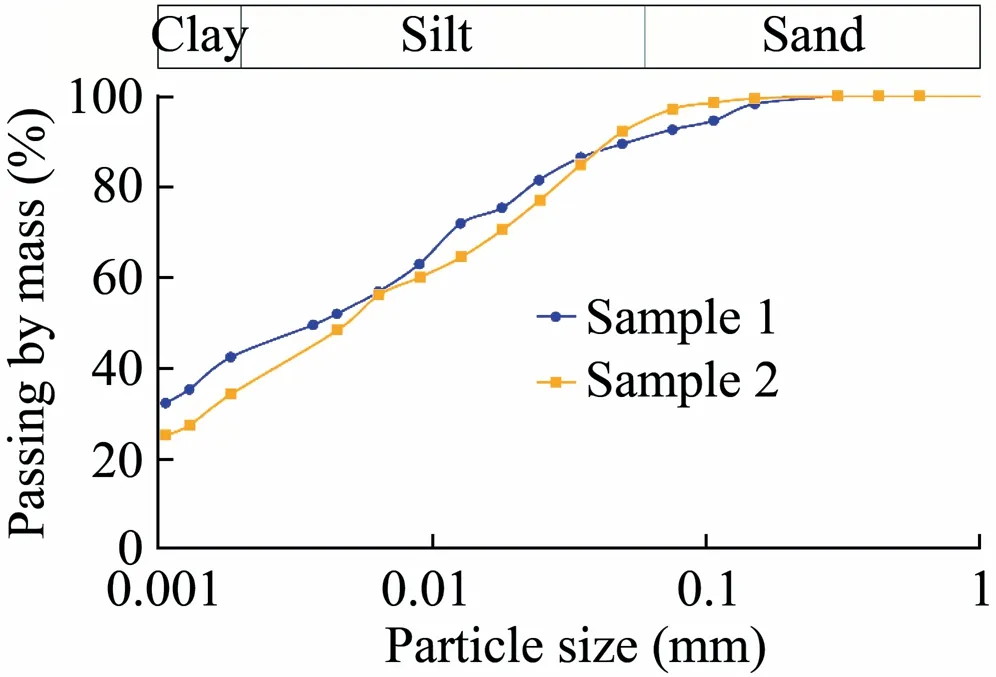
Fig.1.Particle size distribution of the coal tailings samples on wash sieving and hydrometer analysis.
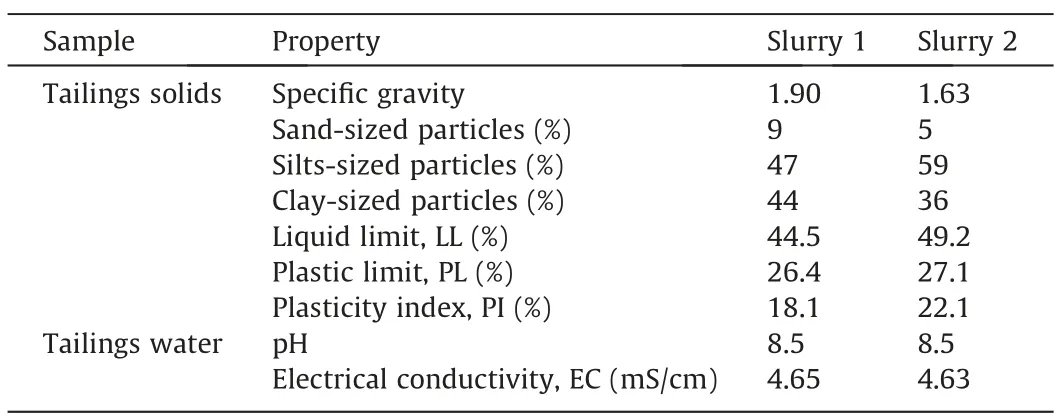
Table 1Basic physical and chemical properties of the coal tailings samples.
The liquid limit (LL) and plastic limit (PL) of the samples were determined as per Australian Standards for testing of liquid limit and plastic limit,respectively[41,42].The results of Atterberg limits testing,listed in Table 1,indicate the materials contain significant fractions of clay minerals.Both samples are classified as fine-grained clayey silt with intermediate plasticity.For reference,the studied coal tailings are much finer than Westcliff and Jeebropilly coal tailings,which are classed as silty sand [16,27].
2.2.Chemical properties
The pH and electrical conductivity (EC) of the tailings water were determined using a digital multi-parameter tester (Multi-Parameter PCSTestrTM 35,Eutech Instruments) (see Table 1).The pH of the tailings water is classified as alkaline (8.5),while that of the process water was slightly higher (8.9).The EC measured from both samples were similar (~4.6 mS/cm) and are approximately three times higher than that of the fine-grained coal tailings slurry from Ebenezer mine in Western Australia [43].
2.3.Mineralogical properties
X-ray diffraction (XRD) testing on pulverised tailings was conducted to obtain their mineralogical composition using a PANalytical X’Pert Pro Multi-purpose Diffractometer.Qualitative analysis was carried out using in-house search software,including XPLOT and High Score Plus(PANalytical).SIROQUANTTMwas used to perform quantitative analysis.An in-house method described by Hill and Howard was used for determining the amorphous content[44].Details about the testing procedure are available in Raven et al.[45].The results of the XRD test are plotted in Fig.2.The XRD pattern shows both samples contain the same minerals,but with slightly different proportions(see Table 2).Both samples contained significant fractions of amorphous material (unrecovered coal) and clay minerals (kaolinite,illite,and smectite).The results indicated that Slurry 2 contained higher percentages of interstratified 50:50 illite–smectite (mineral name:rectorite) than Slurry 1,while Slurry 1 consisted of a higher amount of amorphous content than Slurry 2.For example,the coal tailings slurry of Turkey’s Tuncbilek coal preparation plant contained about 30% clay minerals (kaolinite and illite) and 20% coal contents [46]; while Western Australia’s Ebenezer coal tailings contained 34%–49%smectite,31%–34% kaolinite,and 18%–20% quartz [43].

Fig.2.X-ray diffraction patterns of the coal tailings samples.

Table 2Mineralogy of the coal tailings samples.
3.Methodology
3.1.Settling test
Slurry settling tests were conducted in graduated glass cylinders of 1 L capacities at a height of 34 cm and an internal crosssectional area of 29.4 cm2.Pulverised tailings dried at 60 °C were mixed with process water to achieve a thickened solids concentration of 25%by mass(i.e.the typical concentration at which tailings are disposed in the TSF).A mechanical stirrer was used at 900 rpm for about 30 min to achieve homogenised suspension.The mixture was then poured in the settling column,and testing continued until the settling rate was negligible.An additional settling test was conducted in a steel slurry consolidometer cell with the same height as the graduated glass cylinders (34 cm),but with a larger cross-sectional area (177 cm2); this was done to evaluate the wall effects during settling.All the tests were conducted at controlled room temperature between 21 and 22 °C.
3.2.Consolidation test
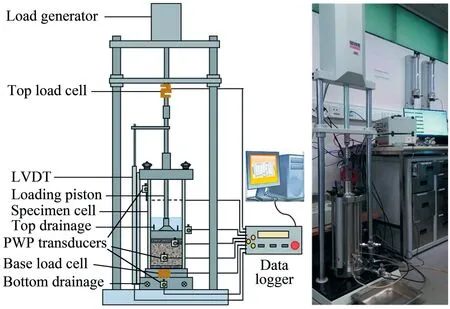
Fig.3.Schematic and photograph of the slurry consolidometer.
Consolidation testing was performed on the replicated settled sediment following the settling test described in section 3.1,using a cylindrical slurry cell with a cross-sectional area of 177 cm2.Fig.3 presents the schematic and photograph of the slurry consolidometer.All the porous stones in the slurry consolidometer were de-aired and saturated before pouring the sample.The sample in the cylindrical cell was allowed to further settle for 24 h to stabilise the suspension.The initial specimen height was kept at 100 mm,as specimens with greater heights take too long to consolidate due to low permeability.It should be noted that during initial consolidation stages suspended colloidal particles could potentially migrate from the sample through the porous stone.This was controlled by avoiding instantaneous step loading as seen in conventional oedometer compression.An approach combining initial constant rates of loading and step loading was employed on the slurried samples.Six loading rates of 0.1,0.2,0.4,0.8,1.6,and 3.2 kPa/min,and six loading steps of 20,40,80,160,320,and 500 kPa were adopted to consolidate the samples.Each loading step was allowed to consolidate the specimen for a maximum period of 24 h.Excess pore water pressure (PWP) was monitored at the base of the specimen to determine the development of effective stress.After the establishment of each loading step,a maximum of 24 h was allowed to consolidate the sample and to dissipate excess PWP.The drainage of water was allowed through the top surface only to replicate field conditions.The tested material was not reused in any of the tests to avoid the effect of particle breakdown on the consolidation behaviour.
3.3.Vane shear test
Similarly,the pulverised 60 °C oven-dried sample was mixed with de-ionised water to prepare the samples at different water contents and stored in moisture bags at 21–22°C for 24 h to achieve a uniform moisture state.The prepared samples were then placed in a mould(internal diameter of 65 mm and 80 mm in height)to minimise the boundary effect on vane rotation [47].According to the standard,the specimen diameter or internal mould diameter has to allow a clearance of two times the blade diameter of the vane between the circumference of the shearing surface and the outer edge of the specimen.Sufficient pressure was applied with a finger to achieve a uniform sample and to allow void spaces inside the specimen to escape.Laboratory vane shear testing was carried out on specimens of varying moisture content (27.7%–46.4% for Slurry 1 and 27.1%–54.8%for Slurry 2),using a vane shear apparatus manufactured by Wille Geotechnik.The diameter and height of the vane blade were 12.7 and 25.4 mm,respectively.The blade thickness and shaft diameter were 0.8 and 3 mm,respectively.A rate of rotation of 6°min-1with a 2 min delay time after insertion of the vane was used[34,48].All the vane shear testing was conducted using an automated vane shear device.
4.Results and discussion
4.1.Settling test
Fig.4 shows the results of the settling test in terms of the volume of settled sediment and the evolution of dry density vs time.Due to high clay contents in the tailings,the settling rate of studied samples was very slow.The tailings solids of Slurry 1 settled more than that of Slurry 2,as the percentage of illite–smectite was higher in Slurry 2.For Slurry 1,the settling rate reduced significantly after 48 h of testing.After 764 h of settling from an initial of 25%,the solids concentration of Slurry 1 and 2 reached 45%and 38%,respectively.The settled dry density of Slurry 1 and 2 were 568 and 445 kg/m3,respectively,at the end of testing from an initial value of 280 kg/m3.No significant differences were observed in the settling tests conducted in the glass settling column and steel slurry consolidometer cell,suggesting the effect of column material and column cross-sectional area on the settling process are negligible.The high values of Atterberg limits,PI,and clay contents found in the samples support the observed slow settling.
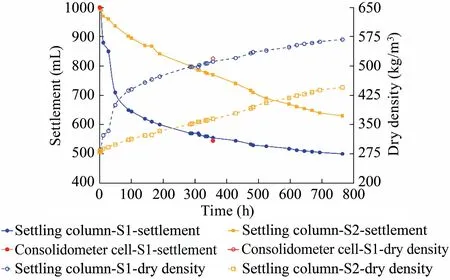
Fig.4.Settling test results:settlement and dry density versus time (S1=Slurry 1;S2=Slurry 2).
4.2.Consolidation test
Consolidation test results are presented in Fig.5.The initial solids concentration of Slurry 1 and 2 specimens were 45% and 38%,respectively.The friction between the piston (seal) and cell wall was measured at 3.9 and 7.5 kPa for Slurry 1 and 2,respectively.This was attributed to the piston seal to avoid leaking of solid particles,depending on the use of silicone grease and roughness of seal material.The consolidation of specimens occurred immediately after the piston-cell wall friction was overcome by the applied stress.The stress transferred to the base of the specimen was similar for both tests.

Fig.5.Results of consolidation tests showing the applied stress or base pore water pressure and settlement results over time.
Fig.5 shows that once the stress was applied to the specimen,the bottom PWP started to build up immediately,suggesting the piston had good contact with the specimen and the specimen was entirely saturated [49].During the first three loading stages(lasting about 78 h),no noticeable dissipation of PWP in any of the tests was identified; this was mostly due to low particle-toparticle contact.It is noted,however,that settling continues to increase at a constant rate.Significant PWP dissipation was observed in loading steps 4 and 5 for the Slurry 1 and 2 specimens,respectively.The point where PWP started to dissipate significantly and stress in the soil matrix increased can be referred to as the‘‘intrinsic point”,which describes the change in the material from a slurry-like behaviour to a soil-like behaviour [23].The intrinsic point is also noted as a change in the rate of settlement.For Slurry 1 and 2,the intrinsic point was measured 80 and 114 h after consolidation started,respectively,and the corresponding applied stresses were 160 and 320 kPa,respectively.The latter appearance of the intrinsic point for Slurry 2 was attributed to its higher illite–smectite content and lower initial solids content.For Slurry 1,PWP dissipated near completely in loading steps 4,5,and 6,while for Slurry 2,PWP dissipated completely only in loading step 6.The PWP dissipation was considered slow and took a long time for both slurries,due to the fine-grained nature of the tailings and the high percentage of clay minerals.In comparison,complete PWP dissipation took 48–96 h for ultra-soft soil,while Jeebropilly coal tailings took only about 6 h [14,23].
The initial rate of settlement with time was very high in the first three loading steps due to water migration,but no dissipation of excess PWP was observed [50].A similar trend continued in loading step 4 for the Slurry 2 specimen.The settlement rate reduced in the later stages,as the grain-grain contact and effective stress increased [27,51].When PWP reached near the hydrostatic pressure,the settlement of the specimen was negligible.The final settlement of the Slurry 2 specimen was higher than that of Slurry 1,which was attributed to the lower initial solid concentration of Slurry 2.
4.2.1.Stress transferred to the base and effective stress
According to ASTM D2435/D2435M,consolidation testing in large apparatus where the aspect ratio (height to diameter ratio)of the specimen is more than 0.4[52],the friction between the cell wall and specimen has to be considered.The stress transferred to the base of the specimen relative to applied stress decreased slightly during testing due to an increase in specimen-cell wall friction as the PWP reduced and the effective stress on the wall increased.This was also explained in terms of the mobilisation of shear stress along the cell wall by Shokouhi and Williams [27].In both tests,the percentages of applied stress transferred to the base of the specimen were similar (89% on average) (see Fig.6).The minor gap between the two graphs was due to the difference in piston-cell wall friction.
The average total stress (σav) in the tailings can be determined using Eq.(1)which assumes a parabolic pattern of total stress distribution along the height of the specimen [27].

where σtand σbis the stress at the top and base of the specimen,respectively.
Piston-wall friction was measured during testing; hence,it has to be considered in Eq.(1),which results in

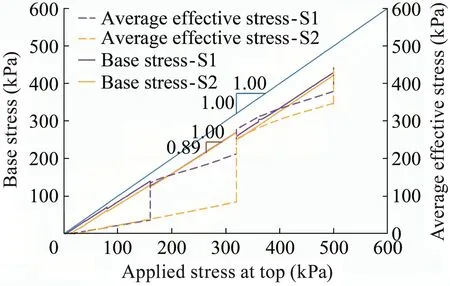
Fig.6.Stress transferred to the base of the sample and average effective stress versus applied stress at the top.
where σpis the loss of stress between the piston(and seal)and cell wall.
The average effective stress()can be determined using base PWP and a coefficient (β) that relates the base PWP (ub) and average applied stress from the following equation [18].

where ubis the base PWP;and β the dimensionless number related to the base PWP and applied pressure at the top.The values of β can be selected,according to Shokouhi&Williams,Janbu et al.,and Leroueil et al.,and are 0.67,0.70,and 0.75,respectively,for ub/σtvalues of<0.4,equal to 0.7,and equal to 0.92[27,53,54].Herein the values of β are linearly interpolated within the range of ub/σt.
Replacing Eq.(2) into Eq.(3),the equation for determining the average effective stress becomes

The changes in base stress and average effective stress with a change in applied stress are shown in Fig.6.In early loading steps(up to 160 kPa),the effective stress was considered low:about 25%–29% of the applied stress converts to effective stress.In the first three loading steps,particle–particle contact was low,and the applied stress was mostly transferred to the pore water (i.e.slurry-like behaviour).Under applied stress of 160 kPa and in the next 24 h at this loading step,two specimens behaved differently.The effective stress in the Slurry 1 specimen increased rapidly from 36 to 135 kPa at a constant stress of 160 kPa within 24 h,while the effective stress in the Slurry 2 specimen remained the same.The main reasons for this were the high initial moisture content and a high percentage of clay minerals in the Slurry 2 specimen.When the applied stress reached 320 kPa,there was a considerable change in effective stress:within 24 h of loading,the effective stress increased from 85 to 254 kPa in the Slurry 2 specimen.Slurry 1 and 2 specimens started to develop effective stress (i.e.soil-like behaviour) at loading steps of 160 and 320 kPa,respectively.
In the later stages of loading,the rate of increase in effective stress slowed down.The material was considered to behave as a soil-like material with a low void ratio.At the end of the test,the effective stresses for both specimens were similar:442 and 436 kPa for Slurry 1 and 2,respectively.The results show the final stress loss(total of the piston-wall and specimen-wall friction)was 12%–14%,while Jeebropilly coal tailings showed a stress loss of about 50% [14].
4.2.2.Changes in strain,moisture content,and void ratio

Fig.7.Changes in axial strain with changes in average effective stress.
Fig.7 shows changes in strain with the change in average effective stress in the specimens.Initially,the stress–strain curves in both tests were similar.Differences are observed when the applied stress starts to transfer to the tailings solids as effective stress.For example,the axial strain in the Slurry 1 specimen was 9% lower than that of Slurry 2 at an average effective stress of 300 kPa which was maintained from about 88 kPa to the final effective stress.The differences are attributed to the different initial gravimetric moisture content and clay minerals present in the specimens.Furthermore,the axial strain vs average effective stress plot can be divided into two parts based on changes in strain:slurry-like and soil-like.The ‘intrinsic effective stresses’ for the Slurry 1 and 2 specimens are identified as 34 and 88 kPa,respectively,based on the transition pattern of the plots.
Fig.8 shows changes in gravimetric moisture content and solids concentration with the change in average effective stress for the samples tested.Again,two stages,a slurry-like state and soil-like state,are visible in the plot based on the changing pattern of moisture content.The gravimetric moisture content of Slurry 1 changed from an initial 123% to 42% in the slurry-like state.On the other hand,gravimetric moisture content reduced to 29% from 42% in the soil-like state under an effective stress range of 34–442 kPa.A similar trend was found for Slurry 2,but the state changed(from slurry-like to soil-like)at a higher effective stress of 88 kPa,due to the presence of a higher clay mineral content (refer to absolute abundance Table 2).The ‘‘intrinsic moisture content” at which the Slurry 1 and Slurry 2 specimens changed state from slurrylike to soil-like were 90% and 77% of their LL,respectively.Before the intrinsic points,changes in the moisture content of the specimens were due to the drainage of pore water,while after the intrinsic point,the changes were due to the dissipation of PWP.This slight difference in final moisture content was observed because Slurry 2 contained higher fractions of illite–smectite than Slurry 1.Similar trends were noticed in the solids concentration vs.average effective stress plot (Fig.8).
The plot between void ratio and average effective stress for the two specimens is shown in Fig.9.Steep drops in the void ratio in the slurry-like state are visible in both tests and are due to the rapid drainage of pore water[50].The shape of void ratio–average effective stress plots in the soil-like state is similar to the tests conducted by Qiu and Sego[7,55].Initially,the void ratio of the Slurry 2 specimen was higher than that of Slurry 1,while at the end of the test,the void ratio for Slurry 2 was lower.The main reason for this reversal is the amount of tailings solids (equivalent height of tailings specimen)in the Slurry 2 specimen is lower than that of Slurry 1,reducing the drainage length for Specimen 2 in the later stages of testing.The intrinsic void ratio of the Slurry 1 and 2 specimens are identified as 0.79 and 0.62,respectively,which are much lower than that of ultra-soft soil which is 2.0 [23].
4.2.3.Consolidation parameters and hydraulic conductivity

Fig.8.Changes in moisture content and solids concentration with changes in average effective stress.
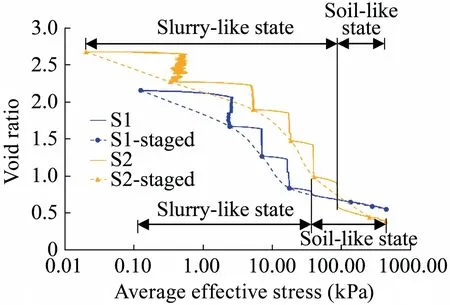
Fig.9.Void ratio versus average effective stress plot.
There are many methods to determine the coefficient of consolidation (cv),such as the Casagrande logarithm of time fitting method,the Taylor square root of time fitting method,successive approximations method,the inflection point method,analytical method,the velocity method,the rectangular hyperbola fitting method,the curve rule method,the improved square root of time method,the SRS method,the probabilistic method,and the gradient method using pore water pressure[56–73].In this research,the cvvalues were determined using the most widely used Casagrande logarithmic time-fitting method [56].The average values of cvare presented in Table 3 showing similar rates of consolidation for the Slurry 1 and 2 specimens.It should be noted that the cvvalues were determined only for the load steps where PWP dissipated completely.As a comparison,the coefficient of consolidation for Kentucky’s coal refuse and Singapore’s ultra-soft soil were 4.7 × 10⁻⁷and 2.8 × 10⁻⁸m2/s,respectively,at corresponding applied stresses of 320 and 223 kPa,respectively [23,40].
The hydraulic conductivity(k)was calculated by multiplying cv(m2/s) by the volume rate of compressibility (1/kPa) and unit weight of water(kN/m3),a reliable method that is used commonly for calculating the k value from an oedometer test[74].The results(Table 3) show the hydraulic conductivity is in the same order of magnitude for both samples; however,it is marginally higher for the Slurry 1 specimen than that of Slurry 2,as the Slurry 2 specimen is consolidated higher than the former.These low calculated values of hydraulic conductivity are equivalent to a flow rate of about 7.7 and 3.8 mm/year for Slurry 1 and Slurry 2,respectively,under a unit hydraulic gradient.These very low values of k indicate water could not pass easily through the consolidated tailings,representing a well-consolidated state.As a reference,the hydraulic conductivity of Kentucky coal refuse and Jebropilly coal tailings are 9×10⁻⁶and 9×10⁻⁷m/s,respectively,at corresponding void ratios of 0.65 and 0.90,respectively [27,40].
4.3.Vane shear test
The results of the vane shear test on two tailings specimens with varying gravimetric moisture content,w (%),are shown in Fig.10.The results show that the Slurry 2 specimen generated higher peak vane shear strength than that of Slurry 1 at high moisture contents because of the higher plasticity of Slurry 2 [75].On the contrary,the shear strength of the Slurry 2 specimens was lower than that of Slurry 1 at low moisture contents; this might be attributed to the slightly smaller percentage of sand-and clay-sized particles in Slurry 2 compared to Slurry 1.It is also interesting to observe that Slurry 1 presents more brittleness on thecurves,which might be related to its slightly higher sand content of sand.

Table 3Average values of different parameters obtained at complete pore water pressure dissipation.

Fig.10.Results of vane shear tests for Slurry 1 and Slurry 2.
Koumoto and Houlsby developed a relationship between moisture content (%) and the undrained shear strength of soil (kPa),which can be expressed as [76]

where w is the gravimetric moisture content in the sample; suthe undrained shear strength; and a and b the coefficients that vary with the soil type,determined by plotting the experimental values of moisture content (logarithm) in the y-axis and undrained shear strength (logarithm) in the x-axis.
Eq.(5) was originally developed to interpret fall cone test results; however,O’Kelly used this equation to relate undrained shear strength found in the vane shear test and moisture content of the specimen,and he found the relationship fitted well [25].Fig.11 shows the changes in peak vane shear strength with the change in the gravimetric content of coal tailings on a logarithmic scale.In this analysis,only peak undrained shear strength was considered,as peak vane shear strength is more consistent than the residual one.The fitted regression models between peak vane shear strength,svpand gravimetric moisture content are:
For Slurry 1

And for Slurry 2

The values of coefficients a and b of Eq.(5)for the Slurry 1 specimen are 42.7 and 0.109,respectively,while corresponding values for Slurry 2 are 46.6 and 0.132,respectively.According to O’Kelly,the value of coefficient b depends on soil compressibility[77].The overall compressibility (fall in the slurry-like state) of the specimens are determined from the steepest part of the staged plots(see Fig.9).The compressibility index of the Slurry 1 and 2 specimens are 1.43 and 1.91,respectively,which indicate the values of coefficient b increases with the increase in overall compressibility index.The values of coefficients are also consistent with a previous study done by Trauner et al.[75].
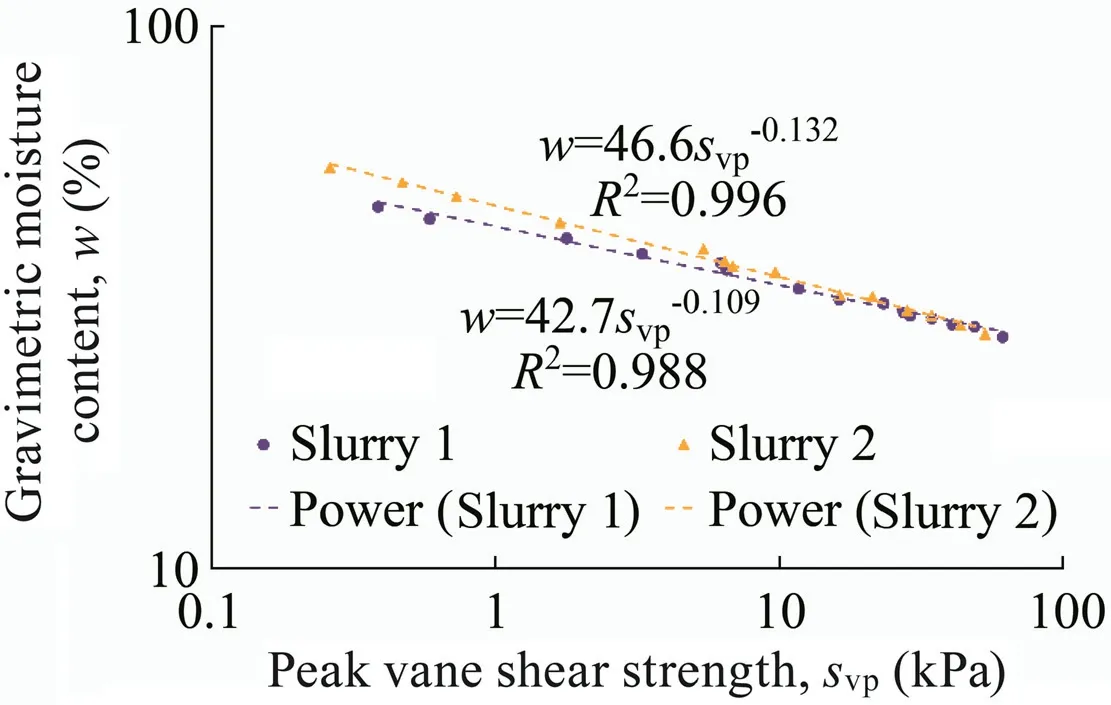
Fig.11.Gravimetric moisture content versus peak vane shear strength plot.

Fig.12.Relationships between undrained shear strength and void ratio.
Fig.12 shows the relationships between the undrained shear strength and void ratio,where the undrained shear strength was determined using the developed regression models (Eqs.(6) and(7))for different void ratios.The undrained shear strength at a high void ratio,0.88 for Slurry 1 and 0.86 for Slurry 2,could not be determined from the vane shear experiment.The plot shows the shear strength merging at a void ratio of 1.20; after that point for a specific void ratio,the shear strength of the Slurry 1 specimen is higher than that of Slurry 2.This is attributed to higher percentages of sand-sized particles,higher specific gravity (Table 1),and lower percentages of illite–smectite in Slurry 1.As the Slurry 2 specimen consolidated higher than Slurry 1,the shear strength of the former is higher than the latter at the end of the tests.The developed regression models (Eqs.(6) and (7)) provide a similar peak vane shear strength of 0.67 kPa at their corresponding void ratios (e) of LL (eLL=0.84,LL=44.5% for Slurry 1; and eLL=0.76,LL=49.2% for Slurry 2),recapping the definition of LL by Casagrande[78].This happens because,at the LL,the hydraulic conductivity of all the clays was almost the same [79].At the PL,Slurry 1 and 2 generate a peak vane shear strength of 56 and 46 kPa,respectively.The plot and relationships can provide the undrained shear strength of the tailings inside the slurry consolidometer at any void ratio during testing.
Additional consolidation testing on both slurries (using a final applied stress of 320 kPa while keeping other variables the same)was conducted to validate the shear strength models that were not discussed in the earlier sections.The peak vane shear strengths of the consolidated tailings tested in the vane apparatus are shown in Table 4.The vane shear strengths of the consolidated Slurry 2 specimen are higher than that of Slurry 1 because of the better packing of solids in Slurry 2 at the final stages.This is also evident in the final solids concentration values (as well as in the void ratios) of the specimens.

Fig.13.Peak vane shear values of the consolidated tailings versus the predicted values from the derived relationships of Eqs.(6) and (7).
The developed regression models(Eqs.(6)and(7))were used to predict the peak vane shear strength,and the predicted results are presented against measured values in Fig.13.The predicted values are very close to the experimental results,except for a test on a Slurry 2 specimen that stressed up to 500 kPa.The reasons behind the deviation between the experimental and predicted peak vane shear strength include the minor swelling of the consolidated specimen after opening the consolidometer cell and the entrance of some water while opening the specimen.The expansion of the consolidated Slurry 2 specimen was also noticed in the specimen height.At the end of testing,the specimen height was 38 mm;however,it was measured at 40.5 mm after opening the cell(Table 4).Fig.13 highlights the developed regression models of peak vane shear strength were successfully validated using the experimental shear strength of the consolidated specimen.
5.Conclusions
This research investigated the settling,consolidation and shear strength behaviour of two coal tailings slurries.Characterisation testing showed both samples are fine-grained containing large proportions of clay minerals and unrecovered coal.From the output of this research,mine operators and other experts can obtain information regarding the settling and consolidation efficiency of coal tailings,as well as how and to what extent the shear strength of slurried coal tailings changed with the change in the moisture content of the tailings and under consolidation.The conclusions that can be drawn are:
(1) The basic characterisation tests showed that the studied tailings have low specific gravity because of the presence of a high percentage of carbonaceous matter (i.e.coal).The tailings are composed mainly of clay-sized and silt-sized particles,with high values of liquid limit.The mineralogical analysis confirmed that the tailings are clay mineral-rich,with a significant presence of illite–smectite.
(2) The final solids concentrations of the settled slurry found in the settling tests were 45.0% and 38.0%,respectively.The rate of settlement of both fine-grained coal tailings slurries was very slow after more than one month of settling,indicating the coal tailings disposed in TSFs will behave like a stable tailings slurry with minimal settling and low selfweight consolidation.Slurry 1 settled marginally higher than Slurry 2,due to relatively higher specific gravity and less illite–smectite content.From the settling test,it wasobserved that faster disposal of tailings results in poor utilisation of space in the TSF and keeps the tailings slurry-like for a long time,provided adequate desiccation is absent.

Table 4Vane shear test results of the consolidated tailings.
(3) The results of the consolidation tests,such as the total changes in void ratio and hydraulic conductivity,represent the effectiveness of the slurry consolidometer in consolidating tailings slurries from a slurry-like to a soil-like,consolidated state.The average coefficient of consolidation for Slurry 1 and 2 was 8.0 × 10⁻⁸and 6.0 × 10⁻⁸m2/s,respectively,while the corresponding average hydraulic conductivities was 2.45 × 10⁻¹⁰and 1.19 × 10⁻¹⁰m/s.The PWP dissipation and consolidation parameters (supported by index properties,mineralogy,and settling test results) are highlighting the slow consolidation behaviour of tailings which should be considered in determining the tailings disposal rate in the TSF.A high disposal rate keeps the tailings under-consolidated,and ever-increasing heights of the tailings in the TSF will result in unconsolidated tailings deposits due to an increase in drainage length.If this happens,the completed TSF will be vulnerable to failure,and the rehabilitation of a completed TSF will be more complex.
(4) The vane shear strengths at the liquid limit of Slurry 1 and 2 were similar.The consolidated specimens of Slurry 1 and 2 tested under 500 kPa applied stress provided peak vane shear strength of 23.4 and 56.2 kPa,respectively.The vane shear test results showed a good relationship between gravimetric moisture content and peak vane shear strength.The predicted results of peak vane shear strength using developed regression models were very close to the experimental results on the consolidated sample.The developed relationships are useful in predicting the shear strength of the materials inside the slurry consolidometer at any void ratio and gravimetric moisture content.
Acknowledgements
This research has been funded through an ‘‘Australian Government Research Training Program Scholarship” and a ‘‘Top-up Scholarship”from the Geotechnical Engineering Centre and School of Civil Engineering,The University of Queensland that are awarded to Shriful Islam.
杂志排行
矿业科学技术学报的其它文章
- Identification of digital technologies and digitalisation trends in the mining industry
- Experimental and theoretical investigation on mechanisms performance of the rock-coal-bolt (RCB) composite system
- Creep characteristics of coal and rock investigated by nanoindentation
- An experimental investigation of the fracturing behaviour of rock-like materials containing two V-shaped parallelogram flaws
- Comparative evaluation of different statistical tools for the prediction of uniaxial compressive strength of rocks
- A rapid and accurate direct measurement method of underground coal seam gas content based on dynamic diffusion theory
