Creep characteristics of coal and rock investigated by nanoindentation
2020-12-20ChnglunSunGuichenLiMohmedElghribGomhJihuiXuYuntinSun
Chnglun Sun ,Guichen Li,*,Mohmed Elghrib Gomh,b ,Jihui Xu ,Yuntin Sun
a School of Mines,Key Laboratory of Deep Coal Resource Mining,Ministry of Education of China,China University of Mining and Technology,Xuzhou 221116,China
b Mining and Petroleum Engineering Department,Faculty of Engineering,Al-Azhar University,Cairo 11435,Egypt
ABSTRACT In coal mining industry,with the depth growing of coal mines,the creep behaviours of coal and rock can extensively affect the mining safety,coalbed methane recovery and geo-sequestration.To acquire a better insight into their creep characteristics,an efficient and robust researching technique,nanoindentation,was applied to investigate the creep performances of coal and rock samples obtained from two coal mines in the east of China.Creep characteristics were reflected by evaluating the curves of creep depth versus creep time of nanoindentation tests during the load-holding period at the peak load of 30 mN.These curves can be divided into two stages:transient stage and steady stage; and the time of load-holding period of 5 s,which is the dividing point between two stages,can efficiently avoid the influence of creep displacement on the unloading curves.The exponential function can perfectly fit creep curves and Kelvin model can be used to calculate the rheological parameters of coal and rock samples.Calculated results yield values for the creep modulus and viscosity terms of coal and rock.This study also settled a particular emphasis on the selection of the positions of indentations to obtain the rheological properties of mineralogical constituents in heterogonous coal and rock samples and their elastic aftereffect.
Keywords:Coal and rock Nanoindentation Creep Heterogeneous properties Elastic aftereffect
1.Introduction
In the east of China,due to the exhaustion of shallow coal resources,deep mining has become a common practice and is increasing rapidly [1].In deep underground,creep behaviours,slow and time-dependent deformations,are the important characteristics of coal and rock samples,impacting mining safety(such as pillar stability and coal and gas outburst) [2–5],coalbed methane(CBM) production [6–9],geo-sequestration (including nuclear waste disposals,CO2storage) [10,11].As a result,to enhance the understanding of these phenomena is of importance to guarantee mining safety and productivity.
Conventional experimental methods,such as uniaxial and triaxial compression tests,have been universally used to investigate the time-dependent deformations of coal and rock [12–14].All experimental results have thrown light on their creep characteristics.Some of them,however,were time-consuming and labourconsuming.On the one hand,the load-holding time of some triaxial compressive tests was more than one week [10] and that for uniaxial compression tests was above 6 h [15].On the other hand,the specimens investigated in conventional creep tests needed to meet size requirements.The typical cylindrical specimen size was Φ50 mm × 100 mm [2] and the size of the smaller prismatic samples was 25 mm × 25 mm × 50 mm [16].For intact coal and rock blocks,it was relatively easy to obtain sizeable and enough samples to carry out macro-mechanical experiments while for the broken ones that are soft and have numerous macro cracks,it was impossible to do that.In addition to the fact that these conventional creep tests were inefficient and inconvenient,a dedicated macro-scale creep testing machine was expensive [17].Consequently,adopting a new technique to investigate the creep characteristics of coal and rock is meaningful for coal mining industry.
Nowadays,the nanoindentation technique has been widely used to capture and model the creep characteristics of biomaterials[18],metals and alloys [19,20],ceramics [21,22],polymers and composites [23,24],cements [25,26],and even crystals [27,28],meaning this experimental technique is a robust way to conduct creep tests.And it was convenient to obtain the sizeable samples from broken coal and rock blocks since the size requirement was just about one centimetre.Consequently,in the recent three years,this method was also used to investigate geomaterials’ timedependent behaviours.Given the past studies,in petroleum and gas industries,Liu et al.used nanoindentation technique to examine the creep behaviour of multi-phase oil shale by applying Burgers models and the logarithmic function to quantify creep curves of various phases in oil shale [29,30]; and they also found an abnormally decreased displacement during load-holding period[31].Slim et al.covered the role of the organic matter on creep rates of gas shale by using nanoindentation technique and obtained that organic matter drives its creep rates [32].This technique has been used to investigate the creep characteristics of shales.However,work on this technique being applied to other geomaterials has been very limited so far.
In this context,the nanoindentation technique was used to inspect the creep behaviours of coal and rock samples obtained from two coal mines in the east of China.The creep characteristics of them were mainly investigated by fitting creep depth-creep time curves and calculating rheological parameters.Besides,the importance of the selection of indentation locations to investigate the properties of mineralogical compositions in coal and rock samples and their elastic aftereffect were also discussed.This research was also an extension of previous study on the conventional mechanical and heterogeneous properties of these coal and rock samples [33].All researching conclusions lay a foundation for the future investigation and application of the nanoindentation technique in coal mining industry.
2.Materials and methods
2.1.Geomaterials
East China,one of the most important coal mining areas,is facing the challenge of deep underground mining.As shown in Fig.1,three geomaterials obtained from two coal mines in the east of China were chosen for investigation.The first,a rock mass is recognized as shale containing clay minerals and having layer structures.The second,a block of mudstone has weak argillaceous cementation and the third is a broken coal.Both of the shale and coal samples were obtained from the 313 haulage gateway in Qinan Coal Mine (geographic coordinates of 33°44′12′′N,117°03′47′′E)in Anhui Province;the mudstone sample was derived from -690 m main gateway in Donghuantuo Coal Mine (geographic coordinates of 39°38′41.49′′N,118°0′11.14′′E)in Hebei Province.Donghuantuo Coal Mine is facing the challenging of deep mining and large creep deforming and Qinan Coal Mine will have a similar situation in the near future.These geomaterials are large enough for cutting standard Φ50 mm × 100 mm cylindrical specimens for macro-scale conventional experiments.However,influenced by cracks and soft properties,cutting process and obtaining intact samples are impossible.Consequently,finding a new method based on small samples to investigate rheological characteristics of these coal and rock blocks is of importance for mining activities.
Besides,in our previous studies,only the conventional mechanical properties and heterogeneities of these three coal and rock samples were investigated,including hardness,elastic modulus,and fracture toughness [33].However,apart from the elastic and plastic response,all soft geomaterials exhibit a significant timedependent response,which is commonly termed‘‘creep” and negatively affects the stability of the underground roadways in deep coal mines.In this context,creep characteristics of deep geomaterials are becoming more vital than conventional mechanical properties.The investigation of the creep characteristics of coal and rock samples is of great importance for both of coal mines in this study.
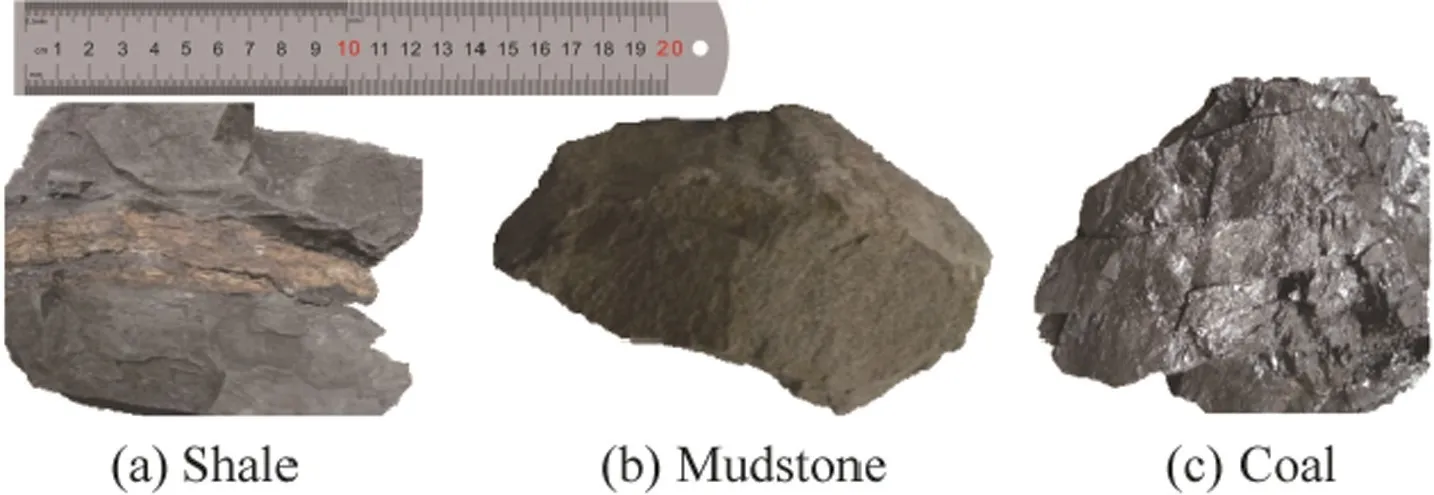
Fig.1.Experimental samples of shale,mudstone,and coal [33],.
2.2.Experimental methods
2.2.1.Nanoindentation methods
To inspect the creep characteristics of coal and rock samples,nanoindentation technique was used.All nanoindentation tests were conducted using an Anton Paar TTX-NHT3 nano-indentor system equipped with a Berkovich tip.Thermal drift of it is<0.01 nm/s after allowing thermal equilibrium to be reached for >1 h at room temperature of 21 °C.There are two loading histories in nanoindentation experiments to investigate the creep characteristics of materials:the first is the ramp loading history and the second is the step loading history[23].The step loading history with a holding period at constant load or depth is more reasonable than the former one.However,in practice,a ramp loading with rising time and a holding period at constant load is the most frequently used method since an ideal step loading history cannot be achieved.
According to the arrangement of nanoindentation points,nanoindentation methods are divided into the point nanoindentation method,line nanoindentation method,and grid nanoindentation method.By selecting a two-constituent geomaterial as an example,the above methods are illustrated in Fig.2.The point nanoindentation method (Fig.2a) can only obtain the mechanical parameters of a single point or one mineral in materials of interest,while grid nanoindentation method (Fig.2c) can obtain the mechanical properties of all minerals in them and conduct data statistics [29].If the number of the nanoindentation experiments is large enough,the line nanoindentation method(Fig.2b)is a simpler method for obtaining the mechanical properties of different mineralogical components in materials than the grid nanoindentation method.
Based on our former study,these coal and rock samples are composed of diverse mineralogical components,such as quartz,montmorillonite,and feldspar [33].The point nanoindentation method just including one indentation cannot be used to evaluate their mechanical properties.Consequently,for convenience,this study adopted the line nanoindentation method to conduct experiments and five indentation tests were carried out for each sample(labelled sample-1 to sample-5).
2.2.2.Experimental protocol
Fig.3a and b give the nanoindentation experimental protocol showed by indentation depth (h(t)) vs.time (t) and the typical nanoindentation creep depth (h(t) -h0) vs.creep time (t -t0)curve,respectively.In this figure,t0is the start time of creep deformation,and h0is the indentation depth when t=t0.As shown in Fig.3a,to make sure that the holding curve and unloading curve used for analysis were mostly viscous deformation and elastic deformation,respectively,three successional loading and unloading processes(stage o–a)were conducted first with each of unloading terminated at 3 mN (10% of the peak load) [34].Both the loading and unloading rates were 1 mN/s.After performing three loading and unloading processes,the holding load stage (stage a–b) at 10% of peak load was made for 60 s to determine the rate of thermal drift in the system[35,36]and make sure that the above thermal equilibrium can effectively minimize the effects of the thermal drift (<0.01 nm/s).And after increasing load to 30 mN,the peak indentation load was held for 60 s (stage c’–c) while the displacement was monitored to analyse the creep properties of coal and rock samples.Finally,unloading to 0(stage c–d)was done to calculate the hardness and elastic modulus of these samples[34].
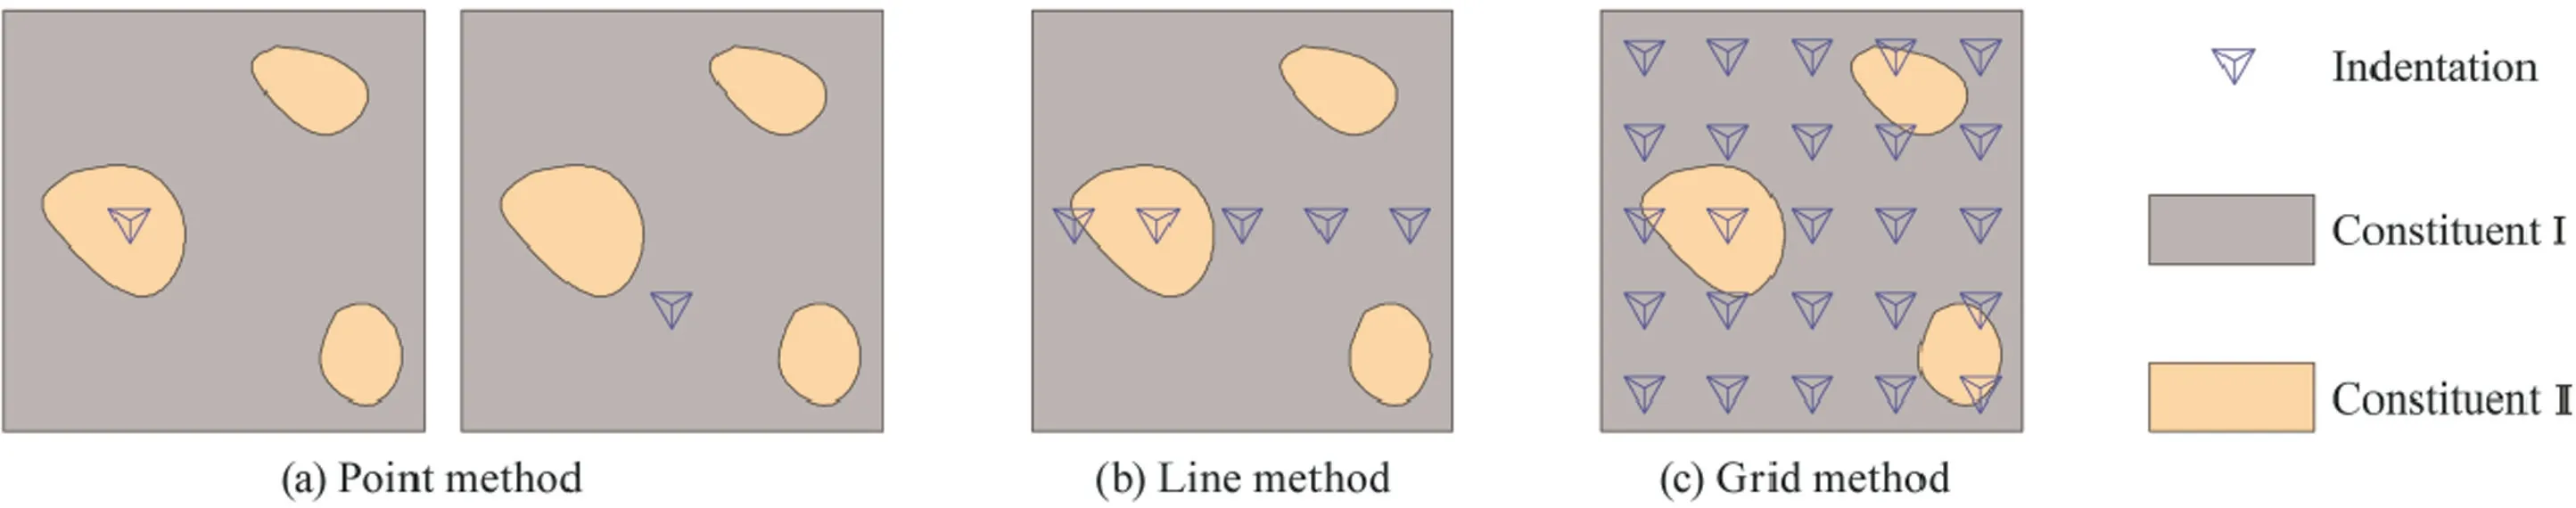
Fig.2.Three different nanoindentation experimental methods.
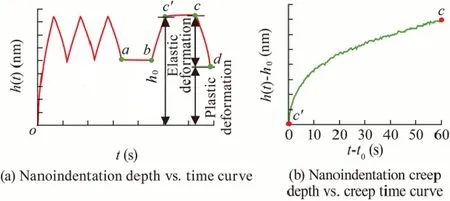
Fig.3.Experimental protocol illustrated by the nanoindentation depth vs.time curve and curve of creep depth vs.creep time.
After unloading,there is a curve of nanoindentation creep depth versus creep time (see Fig.3b).During the holding period,the indenter is displaced further into coal and rock samples.Fig.3b illustrates that the portion of displacement was controlled by creep.The portion of displacement will be used to analyse the creep characteristics of coal and rock samples.
2.3.Calculation methods
2.3.1.Nanoindentation creep model
For nanoindentation creep experiments,the stress,strain,and strain rate can be written as [37,38]

where σ is the stress in MPa; F the force in mN;ε the strain; ˙ε the strain rate in s-1; h(t) the indentation depth in nm; t the experimental time in s; h0the indentation depth in nm when t=t0; and β an indenter parameter (β=0.0407 for Berkovich indenter [38]).
For describing the viscoelastic behaviours of different geomaterials,one of the most widely used models is Kelvin model.This model was chosen to fit their creep strain vs.creep time curves to calculate rheological parameters.As shown in Fig.4,the Kelvin model is composed of a Hooke body(spring)and a Newton’s body(damp) in parallel.The creep behaviour of Kelvin model is expressed as a sharing of the stress between the elastic and the viscous element.
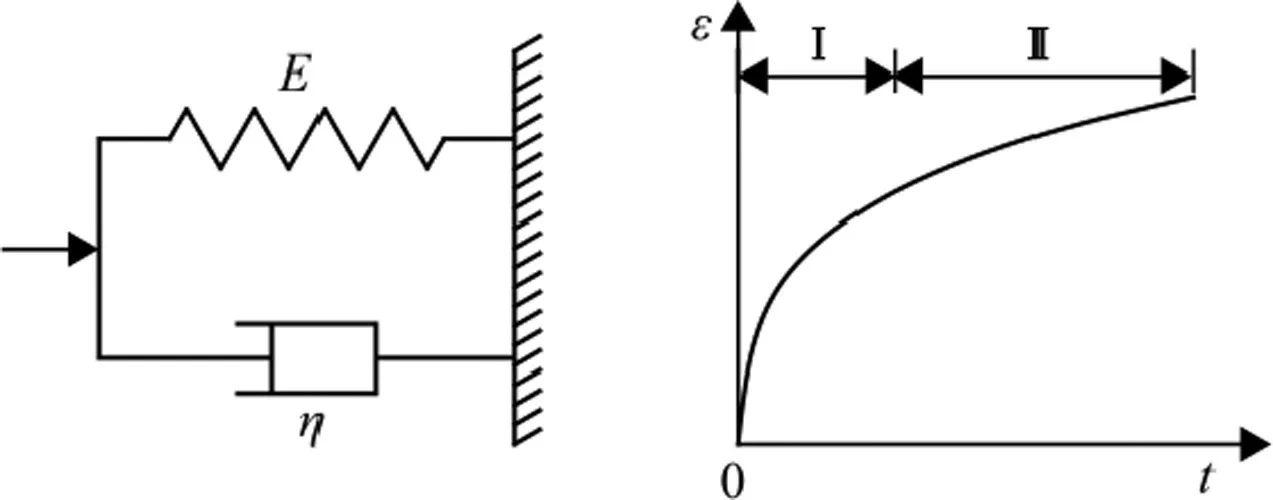
Fig.4.Kelvin model and the curve of creep strain vs.creep time.Note that ‘‘I”indicates the transient stage and ‘‘II” the steady stage.

where E is the creep modulus in GPa; and η the viscosity in GPa·s.Substituting Eqs.(1)–(3) into Eq.(4) forces Kelvin model for nanoindentation experiments.

There are two unknown variables in Eq.(5),i.e.the creep modulus E and the viscosity η.To determine these rheological parameters of coal and rock samples,fitting method was used to be adopted in prior studies [23,39].Because of the difficulties of getting the relationship between indentation depth and creep time through integration,according to nanoindentation experiment results,a suitable function to fit the curve of nanoindentation creep depth vs.creep time was given first.Then,the function was substituted into Eq.(5)to calculate the creep parameters of coal and rock samples.As a result,the process to determine the creep modulus and viscosity of geomaterials in this study is illustrated in Fig.5.
2.3.2.Nanoindentation creep fitting function
For fitting the creep depth vs.creep time curves of nanoindentation experiments,various functions have been proposed and adopted,such as power-law function,logarithmic function,and exponential function.Previous studies showed that the following simple power-law function,Eq.(6),can describe the indentation creep depth vs.creep time curves to calculate the strain rate sensitivity [32,40].Besides,all creep depth vs.creep time curves of nanoindentation experiments follow a logarithmic function (Eq.(7)) [30,41,42].
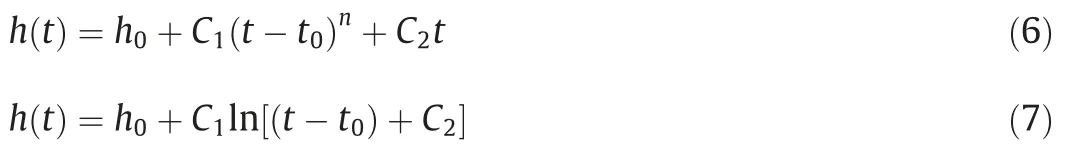
where n is the fitting exponent;and C1and C2the fitting constants.
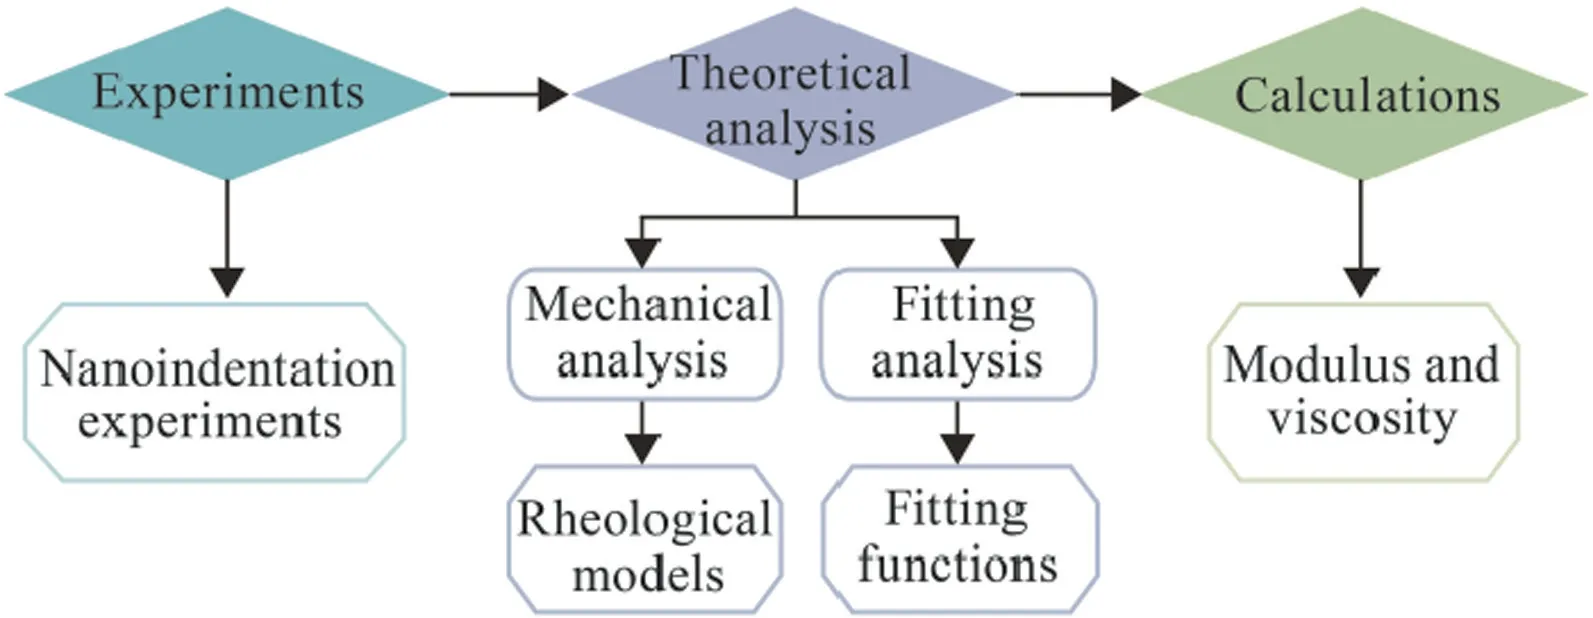
Fig.5.Process to determine creep parameters.
Eqs.(6) and (7) were proved to perfectly fit the creep depth vs.creep time curves of nanoindentation experiments.However,both of them cannot be used to calculate the rheological parameters of geomaterials of interest.Eq.(8),an exponential function limited within one exponential term and proposed to present the Kelvin model,is the most widely used function to fit nanoindentation creep depth vs.creep time curves [43–45].Nevertheless,Eq.(8)also cannot obtain the rheological parameters related to stress and strain in the field of rock mechanics.Consequently,in this study,Eq.(8)was further substituted into Eq.(5)after determining the fitting constants,A and B,to calculate creep parameters.

3.Results
3.1.Conventional mechanical properties
3.1.1.Nanoindentation force-depth curves
Fig.6a–c show the curves of nanoindentation force(F)vs.depth(h(t)) of shale,mudstone,and coal,respectively.
According to the force-depth curves in Fig.6,three successional loading and unloading processes (stage o–a in Fig.3) have hysteretic curves to increase plastic deformation.This process can avoid the influence of plastic deformation on viscoelastic characteristics.With the increase in the number of loading and unloading procedures,hysteretic curves change into unobvious phenomena and the increment of displacements becomes small.For stage a–b,the depth reduces continuously at 10% of peak load.Generally speaking,the rate of decreasing depth at 3 mN,which was regarded as the thermal drift [46],should be at the same values.In contrast,with the increase of holding time at the peak load of 30 mN (stage c’–c),the depth increases with different rate.The force-depth curves are different for various samples,indicating that the mechanical properties of coal and rock samples on various positions are different.For a sample,the curves on different indentation positions are various due to the heterogeneities of coal and rock samples.
3.1.2.Hardness and elastic modulus
After nanoindentation tests,the hardness(H)and elastic modulus (E) of coal and rock samples were calculated by analysing the last unloading curves (stage c–d) according to the Oliver & Pharr method [34,47],as shown in Table 1.The mean values of five indentation experiments were also calculated to compare with previous studying results [33].
Both hardness and elastic modulus of shale-2 are much larger than that of other four indentation positions; and the mechanical parameters of five indentation positions on the surface of coal turn out to be unequal.These results prove the heterogeneous properties of geomaterials at the meso-scale or mineral scale and show that the line nanoindentation method can be used to obtain the mechanical properties of different mineralogical components in both shale and coal samples.However,the mechanical parameters of each nanoindentation position on the surface of mudstone seem to be very close,meaning that the selected indentation positions locate on same mineralogical compositions in mudstone.
The mean value of hardness of shale is 690.26 MPa and its average elastic modulus is 31.39 GPa.Even though both shale and mudstone consist of clay minerals,the mechanical parameters of shale are much larger than that of mudstone (Hmudstone=113.73 MPa,Emudstone=4.61 GPa).And the hardness and elastic modulus of coal are also larger than that of the selected indentation minerals in mudstone.Thus,the descending sequence of mechanical properties is Hshale> Hcoal> Hmudstone,which is different from that got from previous results (Hshale> Hmudstone> Hcoal).Besides,the average mechanical parameters of shale and mudstone,except the elastic modulus of shale,are much lower than that obtained from our previous study by using the grid nanoindentation method[33].Both of results show that the indentation locations selected by using the line nanoindentation method are soft minerals in mudstone,and the number of indentations cannot satisfy the requirement to conduct statistical analysis and obtain the representative mechanical parameters of inch-scale shale sample.To the contrary,for coal sample,the mean values of coal are close to that determined from prior study,which indicates that all indentations may be not severely affected by diverse minerals in this coal sample.
3.2.Creep characteristics
3.2.1.Nanoindentation creep depth vs.Creep time curves
The creep depth vs.creep time curve and creep displacement rate (v) vs.creep time curve of mudstone-3 are illustrated in Fig.7.After increasing loads to the peak load of 30 mN,the depths of indentations increase with time during the load-holding period of 60 s; and the rate of indentation depth growth is not constant.
According to the creep displacement rate vs.creep time curve in Fig.7,the nanoindentation creep deformations of coal and rock can be divided into two parts:transient deformation (I) and steady deformation (II).During the period of the first stage,the deformation rate is very large and decreases sharply with time; after recording the steady stage,the deformation develops at an almost constant rate.The point of demarcation is about 5 s for all coal and rock samples.This result demonstrates that the 5 s holding period is mandatory and enough to avoid the influence of creep deformation on unloading curves and derive stable unloading data for calculating the conventional mechanical parameters.
3.2.2.Elastic modulus and viscosity
Fig.8a–c illustrate the nanoindentation creep depth vs.creep time curves of shale,mudstone,and coal,respectively,and the fitting results by using Eq.(8).According to all nanoindentation creep depth vs.creep time curves in Fig.8,mudstone has the largest creep deformations that are from 61.93 to 84.41 nm;and the creep deformations of coal are slightly larger than that of shale.For geomaterials,such as coal and rock samples,the creep depth increases with the decrease of conventional mechanical parameters e.g.elastic modulus and hardness in Table 1.Accordingly,various coal and rock samples have different creep parameters;and their creep displacements are also various in different indentation positions on the surface of one sample.
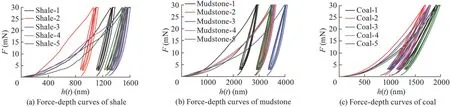
Fig.6.Force-depth curves of coal and rock samples.
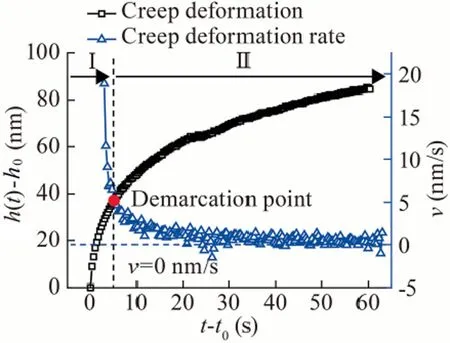
Fig.7.Creep depth vs.creep time curve and creep displacement rate vs.creep time curve of mudstone-3.
The exponential function(Eq.(8))can fit nanoindentation creep depth vs.creep time curves of coal and rock samples with high goodness in a whole way,with R2> 0.89 for shale and R2> 0.93 for both mudstone and coal.According to the fitting results in Fig.8,the fitting functions without unknowns of nanoindentation creep curves can be obtained.And then,based on the Kelvin model(Eq.(5)),rheological parameters,including modulus and viscosity were calculated in Table 2.
The average values of creep modulus for shale,mudstone and coal are 33.59,5.10,and 21.61 GPa,respectively; the coefficient of viscosities of them are 416.47,68.20,and 291.85 GPa·s.Calculating results illustrate mudstone with small viscosity is more prone to creep.However,according the calculated results in Table 1,the selections of indentation locations on mudstone just give the rheological parameters of one soft mineral in it.For shale,the modulus and viscosity of hard mineral in it are about 43.30 GPa and 621.32 GPa·s and that of other soft minerals are much less than them.Besides,the number of indentations can satisfy the requirement to obtain the representative rheological parameters for coal,not for shale and mudstone samples.
4.Discussions
4.1.Selection of indentation locations
X-ray diffraction(XRD) tests were conducted based on the petroleum industry standard (No.SY/T5163-1995) to quantify the minerals in coal and rock samples[33,48].In Table 3,their mineralogical components were divided into two constituents.Constituent Ⅰ is the main mineral and acts as the matrix and constituent Ⅱis particle-shaped and embedded in the matrix.For shale,constituent Ⅱis hard quartz; albite,quartz and microcline are the other hard minerals in mudstone.For coal,constituent Ⅱincludes hard quartz,soft kaolinite and CaCO3.Kaolinite is softer than amorphous solid in coal while the quartz as embedment harden the amorphous solid [49].
According to the calculated results of conventional mechanical parameters (Table 1) and creep parameters (Table 2),the goal to inspect the creep characteristics of different constituents might not be achieved for mudstone sample.The mechanical parameters of each nanoindentation position on the surface of mudstone seem to be all the same and they are much less than that obtained from previous grid nanoindentation method [33].All the mechanical parameters were calculated from the softer constituents in mudstone,i.e.montmorillonite and kaolinite.For shale,except shale-2 in which indentation locates on hard quartz,other indentation positions might be situated on the soft kaolinite.For coal,however,the influence of both quartz and kaolinite on its mechanical properties might be too small to severely scatter the calculated values.
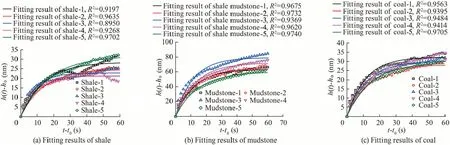
Fig.8.Fitting results of coal and rock samples by using Eq.(8).
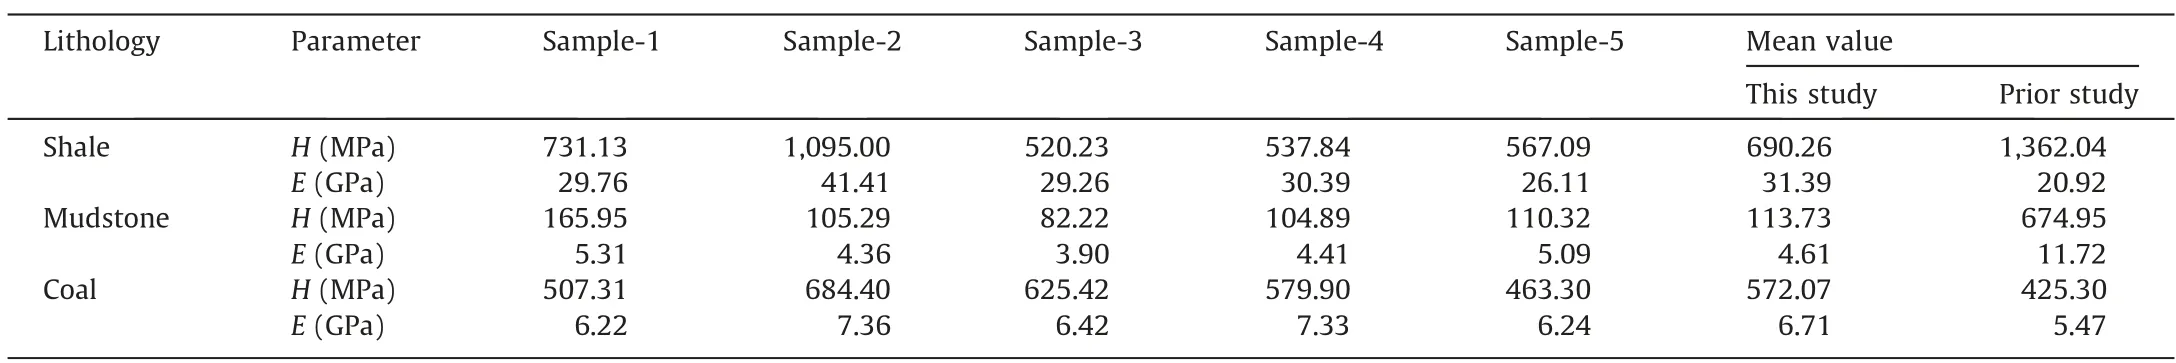
Table 1Hardness and elastic modulus of coal and rock samples.
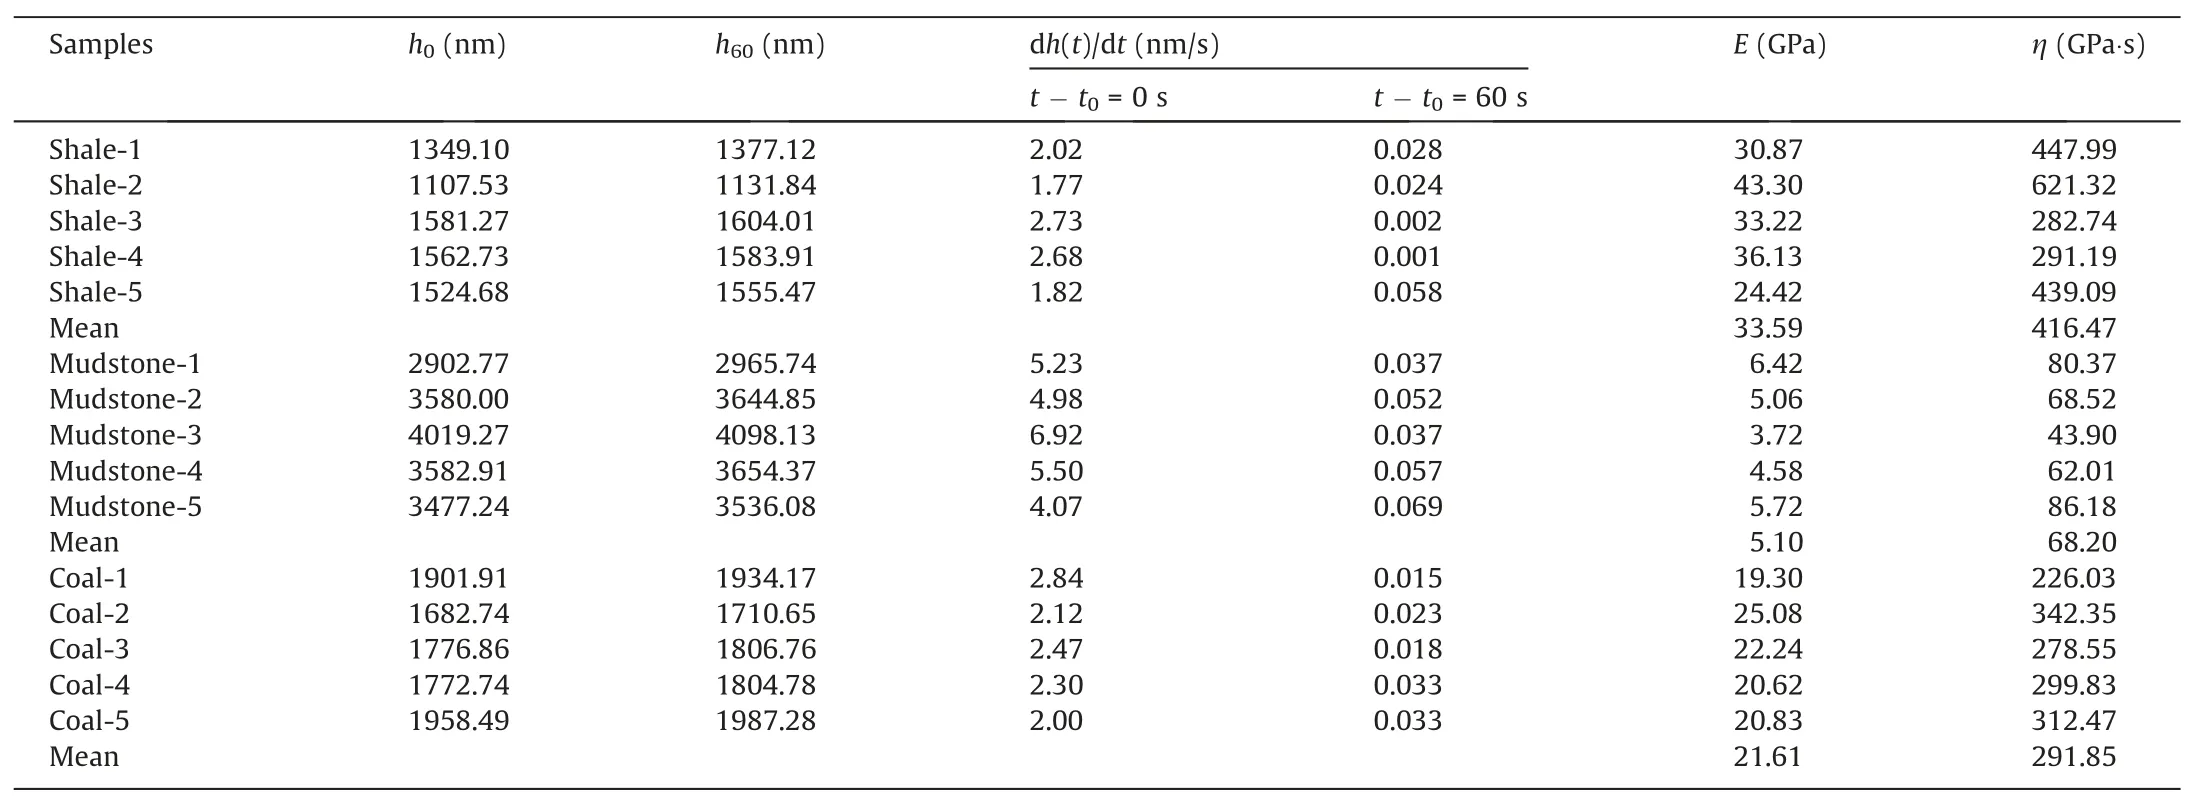
Table 2Modulus and viscosity of coal and rock samples.Note that h60 is the depth when t -t0=60 s.
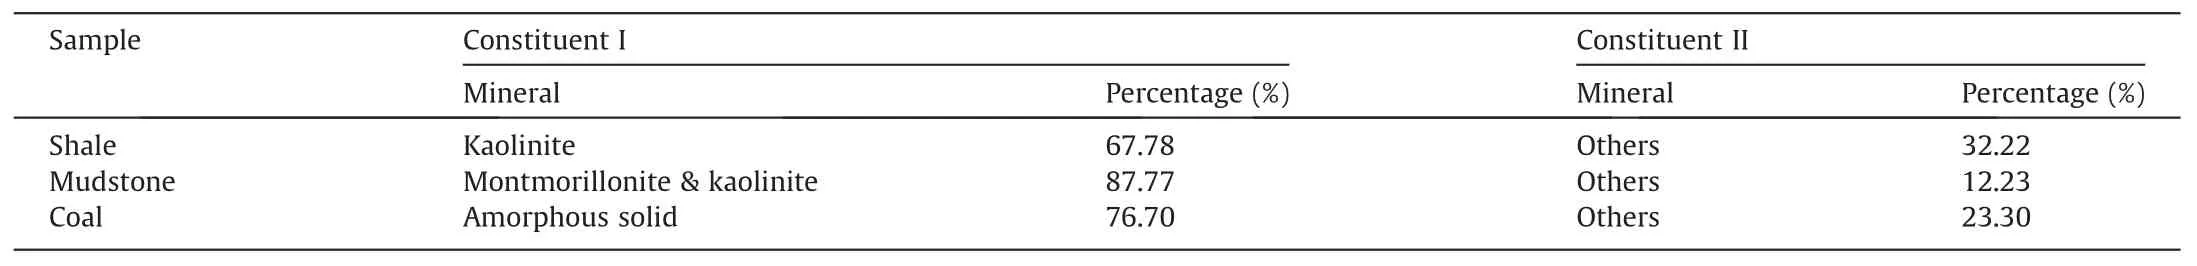
Table 3Two constituents of coal and rock samples.
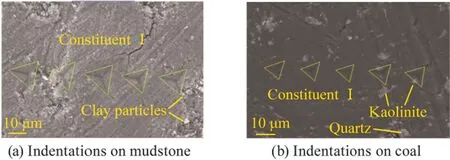
Fig.9.SEM images of nanoindentations on the surface of mudstone and coal samples.
To confirm the above conjectures,after nanoindentation experiments,the indents on the surface of mudstone (Fig.9a) and coal(Fig.9b) samples were observed by scanning electron microscope(SEM)with a magnification of 1000.Concurring with the calculated results,the selected indent positions (Fig.9a) on the surface of mudstone are composed of soft flaky clay particles that act as a matrix.There is not large embedded constituent Ⅱon the surface.The situation of indentations for shale-1,shale-3,shale-4,and shale-5 looks similar to that of mudstone since the calculated results are much less than the previous study [33].According to Fig.9b,the selected surface on coal sample is composed of matrix(constituent I) and particle-shaped embedded constituent II.The sizes of constituent II are much less than that of the indentation areas,which seems to slightly influence the indentations.For example,nanoindentation experiments of coal-5 is soften by softer kaolinite,which induces its slightly low mechanical parameters.Consequently,this study just researched the mechanical properties of the matrix in mudstone sample and discussed the influence of soft kaolinite on creep characteristics of coal.
4.2.Phenomenon of elastic aftereffect
The holding load stage at 10%of peak load(stage a–b)was made for 60 s to determine that the rate of thermal drift in the system is very less.The thermal drift deformation-time(hd-td)curve of shale,mudstone,and coal are illustrated in Fig.10a–c,respectively.As shown in Fig.10,the decrease of depth (deformation recovery) is considered as negative to differentiate it from creep deformation.
If the deformations of indenter during this period for different positions on a sample and on different samples are all the same or close after allowing thermal equilibrium,the deformations would be caused by thermal drift and can be compensated in analysis.However,after unloading to the 10% of peak load,the deformation recoveries of coal and rock samples are of different magnitudes.According to Fig.10,the deformation recoveries of mudstone,from 70.08 to 79.98 nm,are much larger than that of measured thermal drift (<0.01 nm/s),and are above twice of that of shale (from 18.47 to 21.22 nm) and coal (from 18.09 to 27.58 nm).And these values of coal are very close to that of shale.For the deformation recoveries of different positions on a sample,such as coal,the magnitudes are various,and its standard deviation is 3.97 nm,meaning these samples are heterogeneous on the influence of inner microscale structures and various mineral components.Additionally,the obvious jump decreases of deformations(shale-5 and mudstone-4) and the abnormal gradual decrease of deformation(shale-4)happens sometimes in Fig.10a and b,which are regarded as experimental errors due to the complex motion and rotation of mineral particles during load-holding period.The above results illustrate that the deformations during holding load at 10%of the peak load are caused by the deformations of samples rather than the thermal drift of the system.
Unlike thermal drift,these curves have same characteristics to creep deformation curves,which can be divided into two stages,too.At the macroscale,elastic aftereffect is the time-dependent recoveries of deformation[50].After unloading or decreasing loads to small values,the elastic recoveries occur instantaneously followed by a time-dependent and viscoelastic deformation,which is elastic aftereffect.All of the previous studies only concerned the creep characteristics of materials by using nanoindentation techniques [29,30,32] and considered the deformation recovery is caused by thermal drifts [35,36].Elastic aftereffect was first discussed and will be investigated in detail in our future study.

Fig.10.Thermal drift deformation-time (hd-td) curves of coal and rock samples.
5.Conclusions and prospects
In this paper,creep characteristics of coal and rock were investigated by using the nanoindentation technique.Conclusions are as follows.
(1) The nanoindentation technique is a time-saving and laboursaving method to investigate the creep characteristics of geomaterials,especially for broken coal and rock samples that cannot provide inch-size standard samples.
(2) The nanoindentation deformation of coal and rock samples is composed of elastic,plastic,and creep deformation.Before the holding load period to investigate their creep deformation,successional loading and unloading processes are necessary to avoid the influence of plastic deformation on creep results.Elastic deformation occurs instantaneously during the short time loading period before holding load period.
(3) Nanoindentation creep depth vs.creep time curves can be divided into two stages:transient stage (I) and steady stage(II).Holding time of 5 s can effectively avoid the effect of creep displacement on the unloading curves.The exponential function with one exponential term can perfectly fit nanoindentation creep depth vs.creep time curves and Kelvin model can be used to express the creep characteristics of coal and rock samples.Calculated results yield values for the creep moduli and viscosity terms of coal and rock samples.The mean values of creep moduli for shale,mudstone,and coal are 33.59,5.10,and 21.61 GPa,respectively; and the nanoindentation coefficient of viscosities for them are 416.47,68.20,and 291.85 GPa·s,respectively.
(4) Coal and rock samples are typical heterogeneous geomaterials that are composited by various mineralogical components but the nanoindentation technique usually investigates the mechanical properties of a single mineral component.The choice of nanoindentation methods (point,linear,or grid nanoindentation methods) and positions should consider the various of minerals in geomaterials to obtain the representative mechanical properties and avoid a restricted view of them.
(5) After unloading,the elastic aftereffect of coal and rock samples are the main reasons for the recoveries of deformation rather than the thermal drift.The curves of elastic aftereffect,which also includes transient deformation and steady deformation,can also be used to investigate the rheological properties of coal and rock samples.
In our future study,in addition to researching the rheological characteristics of mineralogical compositions in geomaterials by selecting indentation positions and investigating the elastic aftereffect of nanoindentation technique,the creep models and fitting functions will be our main studying contents.
Acknowledgements
The work presented in this paper was supported by the projects of the Fundamental Research Funds for the Central Universities(2020ZDPY0221)and the Guizhou Science and Technology Department ([2020]2Y026).The authors are also grateful to the editors and the anonymous reviewers for carefully reading the manuscript and providing many helpful comments.
杂志排行
矿业科学技术学报的其它文章
- Performance evaluation of near real-time condition monitoring in haul trucks
- Correlating common breakage modes with impact breakage and ball milling of cement clinker and chromite
- Key technologies and engineering practices for soft-rock protective seam mining
- Effect of the distributor plugging ways on fluidization quality and particle stratification in air dense medium fluidized bed
- Numerical simulation to determine the gas explosion risk in longwall goaf areas:A case study of Xutuan Colliery
- Experimental study on methane dissolved in surfactant-alkane system