Performance evaluation of near real-time condition monitoring in haul trucks
2020-12-20HemanthReddyAllaRobertHallDerekApel
Hemanth Reddy Alla,Robert Hall,Derek B.Apel
University of Alberta,Edmonton T6G 2H5,Canada
ABSTRACT Strategic maintenance plays a key role in ensuring high availability and utilization of the haul trucks,and as equipment began to grow more complex towards the end of the 20th century,there was a need for a proactive maintenance strategy,which led to the development of condition-based maintenance.Realtime condition monitoring (RTCM) is the ability to perform condition monitoring in real-time and has the ability to alert maintenance and operations of abnormal conditions.These alarms can be used as an indication leading to a problem,and if a suitable corrective action is initiated in time,it could result in significant savings of equipment downtime and repair costs.This study aims to compare some maintenance performance indicators prior to and after implementation of RTCM strategy at a mine site using some tests of statistical significance.The study also indicated the presence of seasonality in the data,and thus the data was deseasonalized and detrended prior to being subjected to the statistical tests.Finally,the results indicated that RTCM strategy has proven to be successful in improving the availability for some of the failure categories chosen in this study.
Keywords:Haul trucks Real-time condition monitoring Performance indicators
1.Introduction
In order to meet the production targets and ever-increasing demand,mining companies are heavily dependent on sophisticated equipment,not only for extracting and transporting ore and waste product,but also to constantly maintain the infrastructure needed to keep the mines operating.This equipment has to be maintained in top health condition to realize their full potential and reduce operating costs.Equipment maintenance consists of a significant part of the total mine operating costs,ranging from 20% to 35% of the total operating costs [1].Haul trucks play a significant role in open-pit mines across the world.Haul trucks account for about 40% of the total operating costs and hence it is essential to maximize their availability and utilization in order to get the most out of existing resources [2].Companies are aiming at improving haul truck efficiency as a key part of their efforts to reduce costs and improve the competitiveness of their operations.With the total cost to operate each truck ranging in the hundreds of dollars per hour,it is essential that the trucks are always in production when required and are in top health condition.The multidisciplinary nature of mining maintenance activities requires the performance of maintenance productivity to be measured with an integrated approach.Companies started treating maintenance as an integral part of their business due to the added value that maintenance creates to their business process[3].Fig.1 illustrates the three basic maintenance strategies that are widely in practice[4].The correct mix of these three can be determined based on evaluating the risk,cost and impact on environment and health and safety.
In the 1940s,maintenance activities were treated as ‘‘a necessary evil”,where repairs and replacements were corrective and addressed only when equipment or a component of the equipment failed,also known as a run-to-failure maintenance strategy.By the 1960s,equipment maintenance activities started to be regarded as a technical matter and involved optimizing maintenance solutions and activities.As equipment began to grow more complex towards the late 1970 s,preventive maintenance was not proven very effective on the more complex equipment due to a lack of knowledge and poor understanding of the failure characteristics of the newer complex equipment.The late 1980s and early 1990s witnessed the emergence of a new maintenance trend where maintenance requirements were integrated into the early stages of equipment design and development.This led to the maintenance strategies being proactive rather than reactive,with maintenance activities being recognized as profit contributors and better appreciated within the organization [5].

Fig.1.Basic maintenance strategies.
2.Predictive or condition-based maintenance
Predictive maintenance,often referred to as condition-based maintenance (CBM),collects and assesses equipment condition in real-time for recommending maintenance decisions and scheduling maintenance activities based on the current condition of the equipment.This optimizes planned maintenance schedules and prevents/minimizes premature component and equipment failures[6].Condition-based monitoring utilizes modern instrumentation to monitor the asset’s health condition and to indicate the need for a future maintenance event.Depending on the nature and severity of the fault,equipment can be serviced immediately or scheduled for repair on a later date.Condition monitoring techniques can be broadly classified as periodic or continuous.While periodic monitoring systems acquire data at selected time intervals,continuous monitoring systems collect equipment data continuously.Selection of an appropriate condition monitoring technique is a function of hardware and installation costs,time,availability of infrastructure and resources.Continuous monitoring helps establish trends in real-time and their analysis helps predict problems before they lead to catastrophic failures.Continuous condition monitoring also enables comparison of data with preestablished criteria in real-time for providing automated warnings about equipment condition.Real-time condition monitoring(RTCM) is the ability to perform condition monitoring in realtime and is a process that allows administrators or users to access,review and use data in near real-time from a secure database [7].RTCM introduces the ability to alert maintenance and operations of abnormal conditions:alarms are triggered when monitored parameters exceed manufacturer or user defined thresholds,or when equipment is operating in an undesired manner.Sites can program alarms to detect simple instantaneous threshold violations or more complex deviations from the normal trend.These alarms can be used as an indication of a potential problem,and if a suitable corrective action is initiated in time,it could result in significant savings of equipment downtime and repair costs.If implemented properly,and subject to all other conditions remaining stationery,RTCM has the potential to bring significant improvements to mean time to repair,which in turn results in productivity improvements.The objective of this paper is to compare the total time to repair and the number of downs for a fleet of haul trucks,prior to and after implementing a RTCM system in the mine.Studies have been conducted to demonstrate the benefits of using condition monitoring in mining haul trucks[8,9].Thompson et al.and Heyns et al.outlined the development and feasibility of a real-time mine road maintenance management system [10,11].Real-time monitoring has also been implemented in various underground mines for assessing slope stability with successful results [12,13].Statistical approaches such as univariate exponential regression and multivariate linear regression were used to determine overhaul and maintenance cost of loading equipment,which can then be used to make strategic and profitable decisions in surface mines[14].Chaos theory and machine learning techniques have been used to represent the temporal relationships of variables and their evolution has been used to understand and forecast commodity prices [15].A similar technique was used in this paper to study the temporal relationships of downtime and number of downs,in order to detrend and deseasonalize the data.
3.Study on trend and seasonality
The first step in evaluating the performance of a RTCM system is to identify the failures for which times to repair and number of downs can be compared prior to and after the implementation of the RTCM system.In order to achieve this,the top twelve contributors to total down hours are plotted in descending order,along with the number of down events for each category (see Figs.2 and 3).In Figs.2 and 3,the blue bars represent the categorical down hours as a percentage of total down hours and are sorted in descending order.The orange lines indicate the categorical number of down events,measured as a percentage of the total down events.Figs.2 and 3 are generated for two years,2017 and 2018 respectively,where 2017 represents pre-RTCM data,and 2018 represents the post-RTCM data.
As seen in Figs.2 and 3,the most frequent contributors to downtime hours that will be studied are engine,brakes and dump body.These components were chosen because they are monitored by the current RTCM strategy implemented at the mine site.A brief summary of RTCM models to address each of the above down categories is summarized as follows:
(1) Engine:Critical engine parameters e.g.engine oil temperature,pressure,engine speed,exhaust gas temperatures are constantly monitored and maintenance personnel are alerted and prompted to take timely action when any or all of the parameters exceeded thresholds set by the user.
(2) Brakes:Brake temperature,brake oil temperature and brake oil pressure are continuously monitored,along with the misuse of service brake applications to necessitate timely preventive measures.
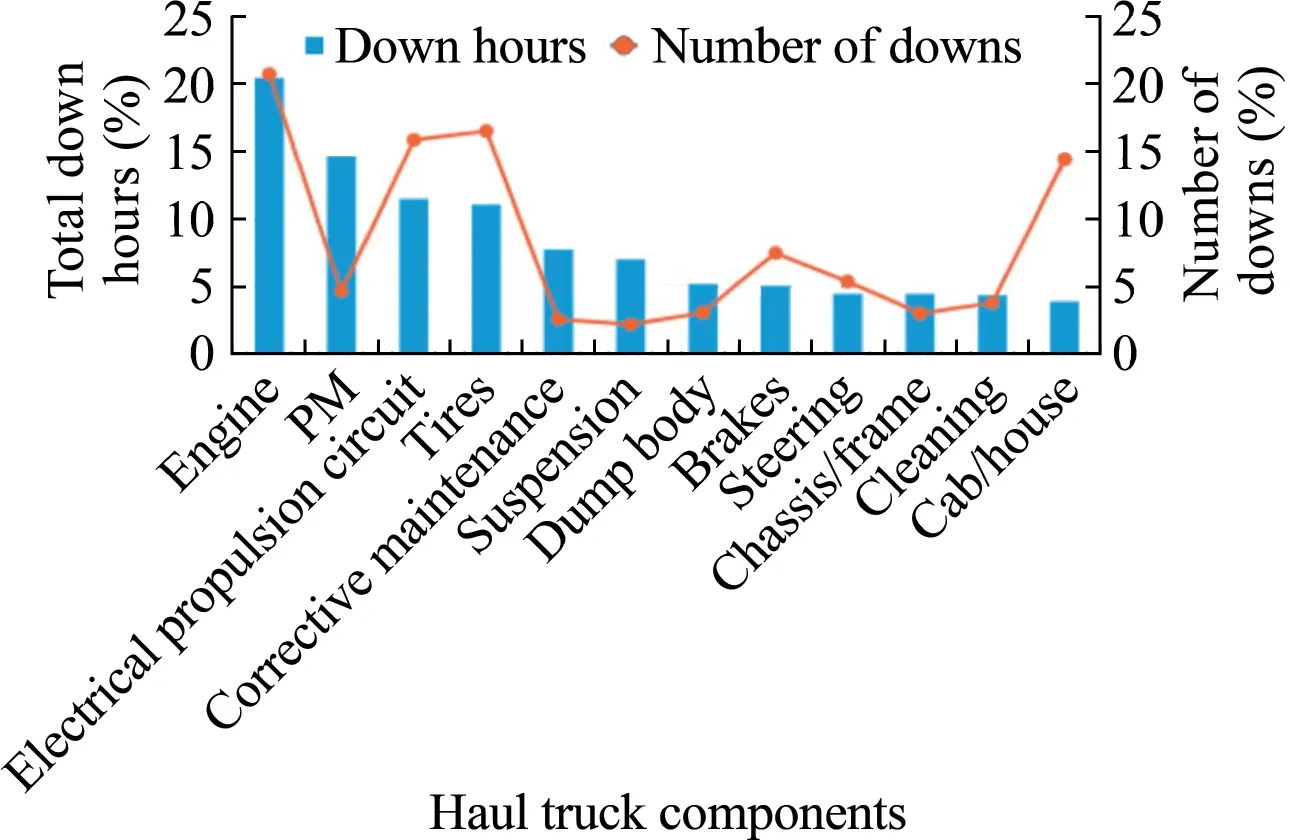
Fig.2.Failure log analysis for 2017.
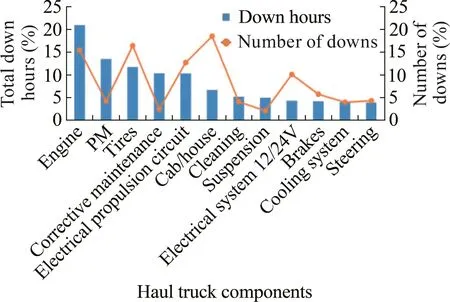
Fig.3.Failure log analysis for 2018.
(3) Dump body:Travelling with the dump body raised beyond certain speeds results in excessive stress on the truck frame.Continuous monitoring of dump body events can help in reduction or elimination of those events by providing suitable training when necessary.Prior to using the data for analysis,it is important to graph the sequence plots of the time series,with data series values on the vertical axis and time on the horizontal axis.The sequence plots give a visual impression and indicate the presence of certain behavioral components present within the time series [16].Figs.4 and 5 show the sequence plots of repair costs and work order counts at the site from January 2012 to December 2018,respectively.The values are intentionally concealed to maintain confidentiality and to not reveal the identity of the mine.
A time series plot is assumed to be a combination of a pattern that comprises of the trend and seasonality,and some random error.It is important to separate the pattern from the error by understanding the patterns trend,and its seasonality prior to use[16].Figs.6 and 7 present box plot views of the yearly (for evaluating the trend) and monthly (for evaluating the seasonality) distribution of maintenance costs and work order counts,respectively.An increase in work order counts and maintenance costs could be a result of aging equipment.Autocorrelation plots can help find repetitive patterns in time-series data and have been applied to the historic maintenance costs and work order counts to assess the presence of any seasonal patterns.

Fig.4.Monthly down hours from 2012 to 2018.

Fig.5.Monthly work orders from 2012 to 2018.
The autocorrelation plots presented in Fig.8 did not show the existence of any strong patterns,so further tests were performed to evaluate the presence of any seasonal patterns in the data.Decomposing complex time series into trend,seasonality,and residual components (error) is an important task to facilitate time series anomaly detection and forecasting [17].A trend of the time series is a long-term increase or decrease,and seasonality is the tendency of time series to exhibit behavior that repeats itself after a certain time period[16].For the purpose of this study,seasonality is assumed to be a periodic and recurrent pattern caused by the weather.Traditional approaches to modeling seasonal time series are to remove the seasonal variations using certain seasonal adjustment method and then the models are scaled back using the estimated seasonal effects for forecasting purposes [18].The most common decomposition techniques of time series plots are additive decomposition and multiplicative decomposition.The basis of additive decomposition is that the time series plot is an addition of the three components,and that of multiplicative decomposition is that the time series plot is a product of the individual components.A time series data that is decomposed by additive decomposition technique is represented by the following model.

Similarly,a time series data decomposable by multiplicative decomposition technique is represented as

Brockwell & Davis presented a detailed explanation and procedure for the estimation and the elimination of trend and seasonal components in a time series data [19].Both additive and multiplicative decomposition techniques are applied to the work order counts and maintenance costs and are presented in Figs.9 and 10,respectively.Figs.9 and 10 consist of two plots each,which consist of four subplots.The first subplot on either side is the sequence plot,the second subplot on each side being the trend component,while the third subplot is the seasonality component and the last subplot being the residual error.
The trend component in Figs.9 and 10 indicate that both work order counts and maintenance costs follow an increasing trend every year.The seasonal component for both work order counts and maintenance costs indicate the presence of some seasonal correlation,but do not follow the same pattern.
The residual component accounts for any outliers in the data.Since the historic data indicates the presence of strong trend and seasonal components,it is essential that the data to be used for evaluating the performance of RTCM strategy be detrended and deseasonalized prior to use.The detrended and deseasonalized work order counts and maintenance costs are shown in Figs.11 and 12,respectively.

Fig.6.Yearly and monthly box plot views of down hours.

Fig.7.Yearly and monthly box plot views of work orders.
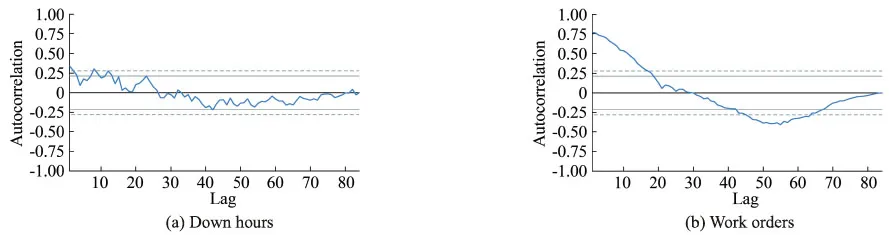

Fig.9.Time series decomposition of work orders.
4.Analysis
The detrended and deseasonalized data are then used for comparing the performance of the RTCM strategy implemented at the site.For this study,two years of historical data were used:2017 represents data prior to the implementation of the RTCM strategy,and 2018 represents the post implementation stage.
The sum of downtime duration and the number of downs in a fleet of over 40 trucks in 2017 and 2018 are compared for the three systems identified earlier.The difference in the total down hours and number of downs between pre and post implementation for the RTCM strategy was calculated for each of the 40 trucks and is plotted as a histogram as shown in Fig.13.
Q-Q (quantile-quantile) plot is one of the popular methods for visualizing and assessing the normality of a distribution [20].QQ plots are plots of sample order statistics against some expected quantiles from a standard normal distribution.The underlying theory behind a normal probability plot is that the plot will be linear except for random fluctuations in the data under the null hypothesis.Any systematic deviation from linearity in the probability plot indicates that the data are not normal [21].If the difference histogram is normally distributed,all the points will lie on the red diagonal line,or very close to the red diagonal line as seen in the Q-Q scatter plots in Fig.14.Normality tests are supplementary to the graphical assessment of normality,and Kolmogrov-Smirnov(K-S) test was performed on the data,the results of which comply with those depicted in the Q-Q plots in Fig.14.

Fig.10.Time series decomposition of down hours.
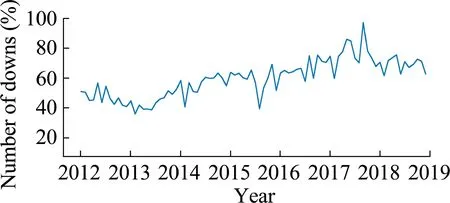
Fig.11.Detrended and deseasonalized number of downs from 2012 to 2018.
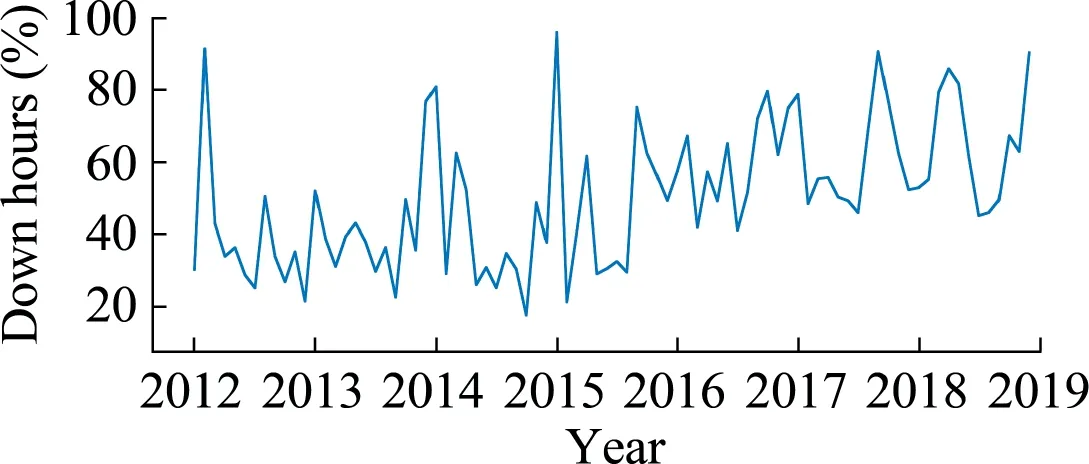
Fig.12.Detrended and deseasonalized down hours from 2012 to 2018.
For data that is normally distributed,a paired t-test was used to test for a null hypothesis,and for other data,the Wilcoxon signedrank test was used to test for the null hypothesis.The null hypothesis is that the mean difference between paired observations is zero.When the mean difference is zero,the means of the two groups must also be equal.To determine whether the difference between the population means is statistically significant,the pvalues obtained from the respective test are compared to a significance level.The significance level used in this study is 5%i.e.0.05.The p-values for each of the categories are presented in Table 1.
5.Results and discussions
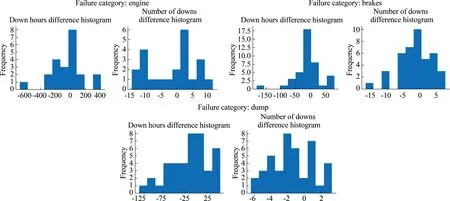
Fig.13.Down hours and number of downs difference histogram plots.
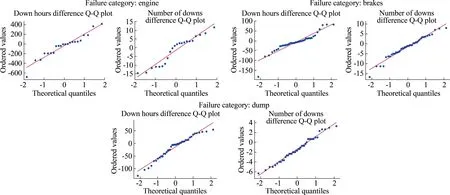
Fig.14.Down hours and number of downs difference Q-Q plots.

Table 1p-values by failure category.
The p-values less than or equal to 0.05 from the paired t-test or Wilcoxon signed-rank test indicate that the null hypothesis can be rejected for 95% confidence interval.This in turn indicates that there is a statistically significant difference in down hours and number of downs due to the implementation of RTCM strategy at the mine site.Based on the results presented in Table 1,there was a significant reduction in the number of down events for the engine after the implementation of the RTCM strategy.Despite a slight decrease in the down hours for engine in 2018,the improvement cannot be attributed to RTCM strategy with statistical significance.Dump body is another category that has statistically significant improvements in both the number of down events and the downtime duration after the implementation of the RTCM strategy.Although a reduction in the number of down events and downtime duration was observed in the brakes,the higher p-value obtained in the tests indicate that the difference in means cannot be attributed to the RTCM strategy with 95%confidence.An important thing to note is that the fault detection models at the site are programmed by the user,and the parameters and thresholds could have an impact on the identification and classification of the faults by the RTCM strategy.
6.Conclusions
The data and results presented in the previous sections indicated that RTCM strategy has proven to be successful in reducing the number of down events and the total duration of downtime for some of the failure categories chosen in this study.The results have been confirmed by paired t-test or Wilcoxon signed-rank test where applicable,and there was a statistically significant reduction in the number of down events for engine and dump body related problems,and significant reduction in the duration of downtime for dump body related issues.Since the models implemented for early detection of the onset of failures are defined by the user,using advanced mathematical computations could lead to better improvements in the remaining categories.The time series decomposition of the data indicates the presence of a long-term trend that is increasing in nature,which could be attributed to the aging equipment.There is also a seasonal variation in the data,but the maintenance cost and work order counts show a different pattern towards the second half of the year.Wen et al.highlighted certain issues with regular methods to decompose time series data such as their inability to handle the seasonality fluctuation and shift effectively and proposed a novel time series decomposition algorithm to address such challenges[17].The use of these techniques could provide a better understanding of the complex seasonal variations of the data.
杂志排行

矿业科学技术学报的其它文章
- Correlating common breakage modes with impact breakage and ball milling of cement clinker and chromite
- Key technologies and engineering practices for soft-rock protective seam mining
- Effect of the distributor plugging ways on fluidization quality and particle stratification in air dense medium fluidized bed
- Numerical simulation to determine the gas explosion risk in longwall goaf areas:A case study of Xutuan Colliery
- Experimental study on methane dissolved in surfactant-alkane system
- Effect of slurry conditioning on flocculant-aided filtration of coal tailings studied by low-field nuclear magnetic resonance and X-ray micro-tomography