Numerical simulation to determine the gas explosion risk in longwall goaf areas:A case study of Xutuan Colliery
2020-12-20YunzhuoLiHetaoSuHuaijunJiWuyiCheng
Yunzhuo Li,Hetao Su,Huaijun Ji,Wuyi Cheng
School of Engineering and Technology,China University of Geosciences (Beijing),Beijing 100083,China
Key Laboratory of Deep Geodrilling Technology,Ministry of Land and Resources,China University of Geosciences (Beijing),Beijing 100083,China
ABSTRACT Underground gassy longwall mining goafs may suffer potential gas explosions during the mining process because of the irregularity of gas emissions in the goaf and poor ventilation of the working face,which are risks difficult to control.In this work,the 3235 working face of the Xutuan Colliery in Suzhou City,China,was researched as a case study.The effects of air quantity and gas emission on the three-dimensional distribution of oxygen and methane concentration in the longwall goaf were studied.Based on the revised Coward’s triangle and linear coupling region formula,the coupled methane-oxygen explosive hazard zones(CEHZs) were drawn.Furthermore,a simple practical index was proposed to quantitatively determine the gas explosion risk in the longwall goaf.The results showed that the CEHZs mainly focus on the intake side where the risk of gas explosion is greatest.The CEHZ is reduced with increasing air quantity.Moreover,the higher the gas emission,the larger the CEHZ,which moves towards the intake side at low goaf heights and shifts to the deeper parts of the goaf at high heights.In addition,the risk of gas explosion is reduced as air quantities increase,but when gas emissions increase to a higher level (greater than 50 m3/min),the volume of the CEHZ does not decrease with the increase of air quantity,and the risk of gas explosion no longer shows a linear downward trend.This study is of significance as it seeks to reduce gas explosion accidents and improve mine production safety.
Keywords:Longwall goaf Gas explosion Air quantity Gas emission Hazard zone Quantitative risk analysis
1.Introduction
One of the most dangerous and common hazards during coal mining is the methane hazard,with most global mining accidents attributed to gas in coal seams.And the common site of these events are areas of the longwall mining goafs[1,2].In China,gassy collieries account for 70% of all state-owned underground mines[3].In the process of mining these gassy mines,the gas is released into the goaf,and combines with fresh air leaking from the working face to the goaf,forming explosive mixture [4].The explosion accident can occur if these risky mixtures of gases are not effectively drained and there is an ignition source present [5,6].Gas explosions accounted for the highest 68% of 188 extraordinarily severe coal mine accidents during the period 1950–2018 in Chinese collieries.These accidents resulted in 7567 deaths,which accounted for 66% of the total fatalities during this period [7].Gas explosion is also known as the most dangerous hazard in U.S.coal mining history [8].In recent years,due to the constant demand for coal resources,the mining depth has increased at a rate of 10–20 m/a,and even up to 50 m/a in some regions.An increase in mining depth can aggravate the severity of gas accidents,especially in seams where the coal has high gas content[9–11].To prevent the occurrence of gas explosion accidents in goafs,the ability to determine the possibility and severity of gas explosion in goafs,address the gas explosion area,and highlight gas explosion risks,plays an increasingly important role in mining safety.
For the purpose of predicting the possibility of gas explosion,some research focused on the explosive properties of methane,which are the main cause of gas explosions[12–14].The explosion limit of methane in air is 5 (lower limit) to 16 vol% (upper limit),while the maximum explosive force can be achieved at 9.5 vol%[15].To ensure the safety of conditions in a goaf,one of the principles of avoiding a methane explosion in underground coal mines is to maintain a methane concentration below the lower explosive limit [16].Many scholars have analysed the change in compositions of the gas after a flammable gas explosion and created models to express explosibility using mathematical transformation methods.Examples include the Coward explosive triangle,the revised Le Charter’s method,the maximum allowable oxygen(MAO)analysis,the United States Bureau of Mine(USBM)method,and the Tertiary diagram[17,18].Their research results provided a baseline for the assessment of gas explosive possibility.However,these methods lack the ability to show the distribution characteristics of methane-air mixtures in a goaf and to evaluate its risk.
The sealed gas in a goaf goes through a critical period during which the methane concentration fluctuates between the lower and upper explosion limits [19].Because of the failure to detect the gas emission in a goaf,some scholars focused on the analysis of the laws of gas migration using scaled-down experimental setups or numerical simulations.Su et al.[6] built an inclinationadjustable longwall goaf model to analyse the effects of airflow direction and ventilation rate on the oxygen concentration in a steeply inclined longwall goaf.Hu et al.[20] studied the changes in methane concentration after a CO2injection into a longwall goaf using experimental apparatus and found that the goaf can be methodically divided into the residual coal zone,the gas transitive zone,and the methane enrichment zone.Kurnia et al.[4]observed methane dispersion in a mine tunnel of discrete methane sources by utilising a computational fluid dynamics (CFD) approach and showed the effects of the methane sources and emission on methane distribution.Zhai et al.[21] studied the distribution of oxygen in a goaf in the U+L ventilation system and analysed the effects of air leakage characteristics in a goaf on its oxygen concentration.These methods mainly focused on the change in oxygen or methane concentration distribution in a goaf,but they rarely involved the explosion hazardous areas or identified the gas explosibility.
Furthermore,to advance the research on methane explosion,Saki et al.[19] discussed the effect of air quantities on methane concentrations in the tailgate and the formation of gas explosive zones in a goaf through a parametric study.They found that increasing pressure along the intake side of a goaf results in the increasing of oxygen available to form explosive methane-air mixtures.Song et al.[22] divided planar areas of gas and coal spontaneous combustion coinciding with disaster and further analysed the chaotic characteristics of coal gas indexes from gas drainage pipelines using the R/S analysis method.Xia et al.[23] suggested the possibility of the coexistence of methane explosions and spontaneous coal combustion and showed that enhancing ventilation flux can dilute CH4(methane) concentrations at the return airway or working face.Wang et al.[24]investigated the potential of subsequent gas explosions using a steady-state simulation method of temperature cut-off and linear superimposition of various parameters.Xia et al.[25] proposed the formation criteria for coal combustion-gas explosion hazards and investigated the evolution of symbiotic hazards at different gas control,face mining,and ventilation parameters by means of CFD.Li et al.[26] used a selfdesigned experimental platform to determine the effects of different air leakages on methane migration in a goaf,providing insights into the determination of explosion risk zones.The previous studies have demonstrated that the numerical simulations especially the CFD approach is able to figure out the gas explosion in longwall goafs.Therefore,this study also attempts to gain more insights into the problem and study the quantitative risk analysis of gas explosion.
The problem of how to identify and reduce gas explosion risks in longwall goaf areas needs in-depth research.Therefore,in this paper,using the COMSOL Multiphysics,a simulation on oxygenmethane mixture migration in a longwall goaf was conducted to quantitatively determine the distribution of oxygen and methane concentration fields with different air quantity and gas emission.Based on the distribution and explosibility of the oxygenmethane mixtures,a three-dimensional (3D) coupled explosive hazard zone (CEHZ) in the goaf was drawn.Furthermore,a quantifiably effective index for risk analysis was established in order to evaluate the gas explosion risk in longwall goaf areas.The results provide some guidelines on how to mitigate the risk of gas explosion in longwall mining goafs and will play a significant role in helping reduce methane concentrations to the prescribed levels of safety.
2.Materials and methods
2.1.Research background
The field test site is the Xutuan Colliery in Suzhou City,Anhui Province,China.The colliery runs about 9–12 km from south to north and 3–7 km from east to west.According to its exploration geological report,the gas composition of this mine is mainly CH4,and there is a local gas enrichment zone.The results of methane grading of the colliery in July 2006 showed that the colliery had an absolute methane gas emission rate over the mine as a whole of 42.79 m3/min,and a relative emission rate of 15.82 m3/t.Consequently,the colliery was identified as a methane outburst and high gassy mine.The 3235 working face was selected in this research.The absolute methane gas emission of the working face was approximately 13.2 m3/min and the coal dust explosion index was 31.32%.A ‘‘U”-type full negative pressure ventilation system was adopted at the working face,and the ventilation flux was 2400 m3/min.The coal bearing strata in the mining area was mainly of the Permian Period,and was divided into 34 coal seams,among which 32,72,and 82were the main coal mining seams.The Xutuan Colliery had a large volume of absolute methane gas emissions,making the effective prediction and control of gas concentrations the key to mining safety at Xutuan Colliery.
2.2.Physical model
2.2.1.The geometric model of the goaf and boundary conditions
According to the field situation of 3235 working face,a simulation model and mesh were established by COMSOL Multiphysics(Fig.1).Based on the finite element method,COMSOL practices the simulation of physical phenomena by solving partial differential equation (single field) or system of partial differential equations (multiple fields).The strata fracturing and destressing were strongly related to the distance from the strata to the working face.Significant variate changes happened within 200 m behind the working face [25].Therefore,the depth of the goaf was set to 260 m.The model was composed of tetrahedral mesh and was refined in the intake roadway,return roadway,and goaf upper corner.The gradient between the working face and goaf in mesh generation was resolved by using the boundary layers to capture the inflation layers.The mesh independent test was carried out and the mesh with high quality and accuracy was selected.
The sources of methane in a goaf are the depressurised gas from adjacent coal seams and the desorbed methane from the residual coal.In a typical gassy mine,the ventilated air contains about 0.1%–1.0% methane.When the mine is not mined,the gas emitted from the coal seam may contain 60%–95% methane,depending on the proportion of other gases in the coal seam [27].However,the specific situation of methane emission from coal seams is difficult to predict.The thickness of residual coals is small compared to the height of the goaf.In this study,field investigations showed that the 32,72,and 82coal seams are the main coal mining layers,and that the ratio of roof and residual coal was set to 4:1.Different gas emissions(22.45,33.7,44.45,and 56.15 m3/min)were considered to investigate oxygen and methane distribution in the goaf.The basic parameters of the CFD model of the goaf are listed in Table 1.
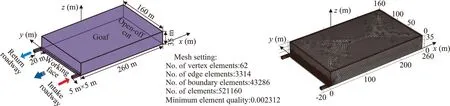
Fig.1.Geometric model and the mesh of the goaf and the working face.
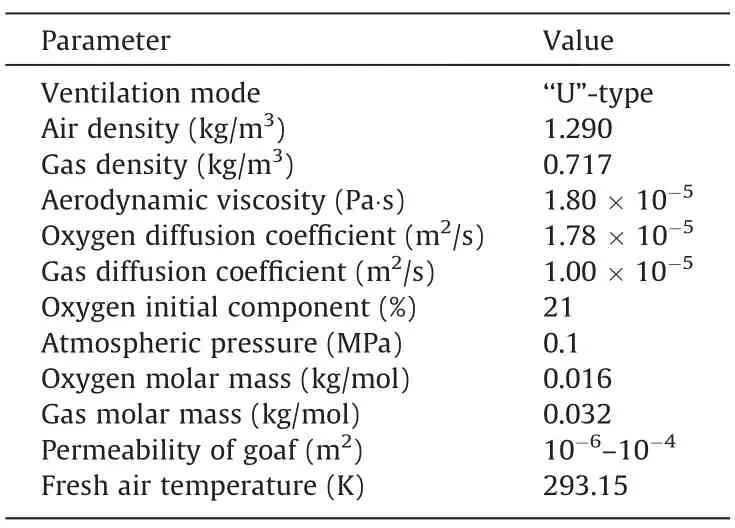
Table 1Basic parameters used in the goaf model.
2.2.2.Three-dimensional seepage parameters for the goaf
In the sides of the goaf,there exists a connected fracture zone called the ‘‘O”-shaped circle,which provides the main pathways for gas flow [2,28].Based on the ‘‘O”-ring theory,the porosity distribution in the goaf in a 3D domain (x,y,z) can be given as [29]
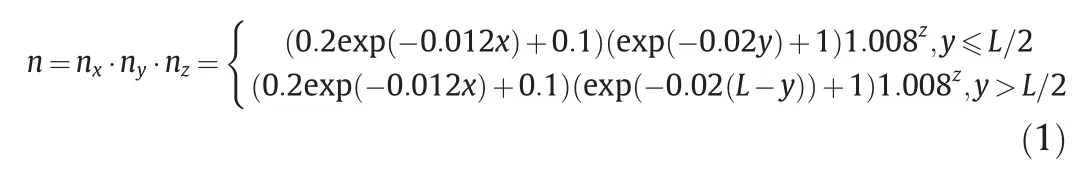
where nxis the porosity in the direction to the working face(x-axis);nythe porosity in the direction along the working face (y-axis); nzthe porosity in the direction to the height of the goaf (z-axis); and L the length of the working face in m.
The porosity is large near the working face and reaches a maximum value at the intake and return air sides.The larger the depth of the goaf,the smaller the porosity,and the porosity gradually increases along the height direction of the goaf [30].Fig.2 shows an ‘‘O”-ring for the porosity distribution in goaf.
The permeability coefficient is mainly related to porosity and particle size.Qin et al.[31]conducted steady-state seepage experiments on broken rock samples with different average particle sizes.The relationship between permeability,porosity,and particle size was obtained by binary fitting.According to Reynolds criterion,the relation is applied to the actual goaf,and the distribution formula of permeability parameters in goaf is obtained.Therefore,this paper corrects the correlation coefficient according to the actual mine exploration situation,and gives the following formula of goaf permeability coefficient K.
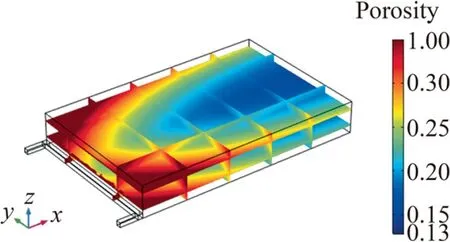
Fig.2.3D mapping of the goaf porosity used in simulation.

where d is the average diameter of the caved coal and rock in m.According to field investigations,d was determined to be 0.3 m in this study.
2.3.Mathematical model
The goaf is a porous medium in which caving rocks and residual coal are stacked,with complex gaps and passages between them.The gas migration and mass transfer depend on a large number of factors.Therefore,following simplification and hypothesis are made in this study.
(1) The goaf is regarded as an isotropic porous medium.The physical properties and chemical reaction of the gas are in the steady-state process,ignoring the influence of water.
(2) The physical properties of coal and rock in goaf do not change with time and temperature.Similarly,a solid at the same location has the same temperature as a nearby gas.
2.3.1.Continuity and momentum equations of gas migration
The process from the influx to outflow of a fluid can be given as the following equation of continuity.
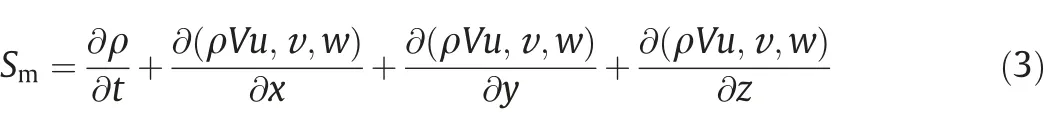
where Smis the mass source term;ρ the gas density in kg/m3;t the time in s; u,v,and w the three dimensional velocities in different directions in m/s; and V the velocity for gas flow.
The momentum equation of gas migration in the three spatial directions can be written as
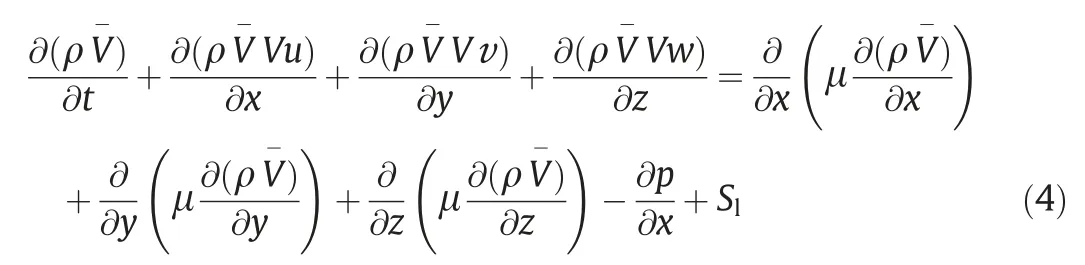

where k is the permeability in the goaf in m2; and C2the inertia resistance coefficient in m-1.
For gas flow laws in the free-flow regions (roadways and the working face),the Navier-Stokes equation is applicable,which can be resorted for a solution to both breezes and turbulence[23,33].COMSOL Multiphysics applies Boussinesq approximation to the Navier-Stokes equation,fluid density changes are considered in the buoyancy term of the equation and ignored in other terms.Thus,it can be obtained as

where Vnsand pnsare the velocity (in m/s) and pressure (in Pa) of Navier-Stokes equation,respectively.
In previous studies,Darcy’s law was mainly applied to the flow of porous media in goaf.However,the past linear Darcy model was not as accurate as it could be as it neglected the inertia and viscous effects in porous media.Brinkman-Forchheimer extended the Darcy model in a more appropriate way to describe the rapid flow of fluid in a porous medium [34].

where Vbrand pbrare the velocity (in m/s) and pressure (in Pa) of Brinkman equation,respectively; η the viscosity of gas in Ns/m2;ε the dimensionless porosity; and T the second-order tensor representing the rate of deformation in the fluid domain.
By coupling the Navier-Stokes equation with the Brinkman equation,and the speed is constrained as Vns=Vbron the interface between Navier-stokes and Brinkman region,the flow of the fluid can be calculated [35].
2.3.2.Mass conservation equation of gas in the goaf
Given the mass transfer in a gas mixture,the resultant concentration gradient causes diffusion.When the airflow moves as a whole,convection contributes to the gas component flux.The movement of gas in a goaf can be described by the convection diffusion equation law i.e.the Fick’s law [36].

where Niis the molar flux in mol/(m2·s);Dithe diffusion coefficient in m2/s;cithe concentration in mol/m3;and Rithe reaction rate for gas in mol/(m3·s).
2.3.3.Determination of the gas explosion hazard zone
The air leak (mainly including the adjacent goaf,poorly constructed seals,and mining induced cracks) provides oxygen for the gas explosion in the goaf and dilutes the methane gas[25,37,38].Once methane accumulates and the concentration of methane reaches the explosive limit,a methane explosion may occur.The revised Coward’s triangle provides a fast and effortless way to identify the explosive situation of a mine atmosphere and to track its explosibility risk.Saki et al.[39]provided the colouring scheme of the explosibility for the mixtures of methane and air based on the revised Coward’s triangle.There are four different areas:(1)an explosive area,(2)a fuel-rich insert area that becomes an explosive area when fresh air or oxygen is added,(3) an inert area without explosive composition,and (4) a fuel-lean inert area near the fresh air region.The intersection of key areas of oxygen concentration,gas concentration,and temperature was considered to be the coupling hazard in accordance with the mathematical principle of linear superposition.Therefore,the gas explosion hazard area can be defined as

where Seis the CEHZ in the goaf;τ the time of gas migration in the goaf;SO2the oxygen concentration field,where the oxygen concentration condition for a gas explosion is satisfied,SO2(τ,x,y,z)={SO2(τ,x,y,z)|CO2≥C’O2} (CO2is the O2concentration in the goaf,and C’O2is the minimum oxygen concentration required for gas explosion i.e.12 vol%); SCH4the methane concentration field required for a gas explosion,SCH4(τ,x,y,z)={SCH4(τ,x,y,z)|C’CH4≤CCH4≤C’’CH4} (CCH4is the CH4concentration in the goaf,C’CH4is the lower explosion limit of methane i.e.5 vol%,and C’’CH4is the upper explosion limit of methane i.e.16 vol%);and STthe temperature field where the temperature reaches the required explosion (coal combustion usually reaches a temperature around 650–750 °C) [24].
3.Results and discussion
3.1.Model verification
Due to the difficulty of measuring the longwall goaf,model verification is indispensable in CFD numerical simulation.To verify the accuracy of the simulated model,the maingate side and tailgate side were measured in the field.The arrangement of the exhaust pipe and the temperature sensor AD590 adopted the two-slot buried pipe method.Measuring points #1 and #2 were located on the coal pillar of the goaf near the maingate side and on the coal pillar of the goaf near the tailgate side,respectively(Fig.3).Fig.4a and b show comparison of measured and simulated O2concentration(CO2)and CO2concentration(CCO2)at the measuring points,respectively.As seen in Fig.4,the simulated and monitored oxygen concentrations show the same trends—the further away the oxygen concentration from the working face is,the lower the value is.The simulated and field measured carbon dioxide concentrations also have the same trend,except that the peak values measured at the air intake are slightly different.
3.2.The distribution of oxygen and methane concentration in the goaf
In the COMSOL,the concentration distribution of oxygen and methane with a gas emission of 56.15 m3/min and an air quantity(Q) of 3000 m3/min is plotted,as shown in Fig.5.Due to the combination of ventilation pressure and air leakage,an asymmetric distribution of oxygen occurred,and the oxygen concentration was high near the air intake side in the goaf[40].The oxygen concentration decreased with increasing distance from the working face because of decreasing porosity,dilution of the gas effluent flow,and consumption through coal oxidation [21].For example,the oxygen concentration near working face was 21 vol%,while the oxygen concentration decreased to 0 vol% at position about 100 m away from the working face.The methane concentration in the upper goaf is higher on account of the difference in air current density.Previous literature [41–43] also presented similar results.From the above,the proposed 3D model of goaf can be applied to conduct specific studies of the different parameters and quantitatively evaluate the gas explosion risk in longwall goaf areas.

Fig.3.Distribution of measuring points #1 and #2.

Fig.4.Comparison of the simulated and measured O2 and CO2 concentration,respectively.

Fig.5.3D distribution of methane and oxygen concentrations in goaf.
3.3.Effect of the air quantity on the hazard zone
The air leakage intensity of different air quantity is different,and the air leakage intensity affects methane distribution in the goaf,which in turn affects the hazard zone.According to the mathematical principle(Eq.(10))of the hazard zone in Section 2.3.3 and the revised Coward’s triangle,the CEHZs were drawn.Fig.6 shows the influence of air quantity on the hazard zone with a gas emission of 44.45 m3/min.More specifically,Fig.6 shows the crosssections of oxygen concentration and methane concentration at heights of 6,12,and 18 m at an initial distance from the working face of 80 m.In Fig.6,the green area is inert area without explosive composition,and the blue area is inert area near fresh air that lacks explosives.The red shaded area represents the range of methane concentration within the explosive limits (5–16 vol%) on the x-y cross-sections,the blue shaded area represents the range of oxygen concentration (≥12 vol%) on the x-y cross-sections,and the red area between the coloured shadows is the CEHZ.
Fig.6a shows the CEHZ behaviour with a ventilation flux of 2400 m3/min.At a low height (z=6 m),the CEHZ was mainly focused near the working face and the intake side.Further from the floor(increasing z values),the CEHZ of the return roadway vanished.Moreover,because the methane was floating up,the scope of the CEHZ gradually increased.For example,the maximum width of the CEHZ was about 20 and 30 m at heights of 12 and 18 m,respectively.Comparing Fig.6b with Fig.6c,it can be seen that the air leakage grew and the CEHZ shrank at the same height.For instance,when the ventilation flux was 3000 m3/min,the maximum widths of the CEHZ at heights of 12 and 18 m along the working face advancing direction were approximately 30 and 37 m,respectively(Fig.6b).Whereas,when the ventilation flux was 3600 m3/min,the maximum widths of the CEHZ at the same heights along the working face advancing direction were approximately 19 and 22 m,respectively (Fig.6c).Compared with 2400 m3/min ventilation flux,the higher air quantities caused the CEHZ to move into the intake side,until there was essentially no CEHZ at the return side.The intake side was the riskiest area for gas explosion.The main reasons for these circumstances were that the air leakage intensity increased,more methane was diluted in the goaf,and a high methane concentration occurred at the return side,so that the range of methane within the explosive limit was enlarged near the intake roadway.
3.4.Effect of the gas emission on the hazard zone

Fig.6.Distribution of the CEHZ in the goaf with different air quantity.
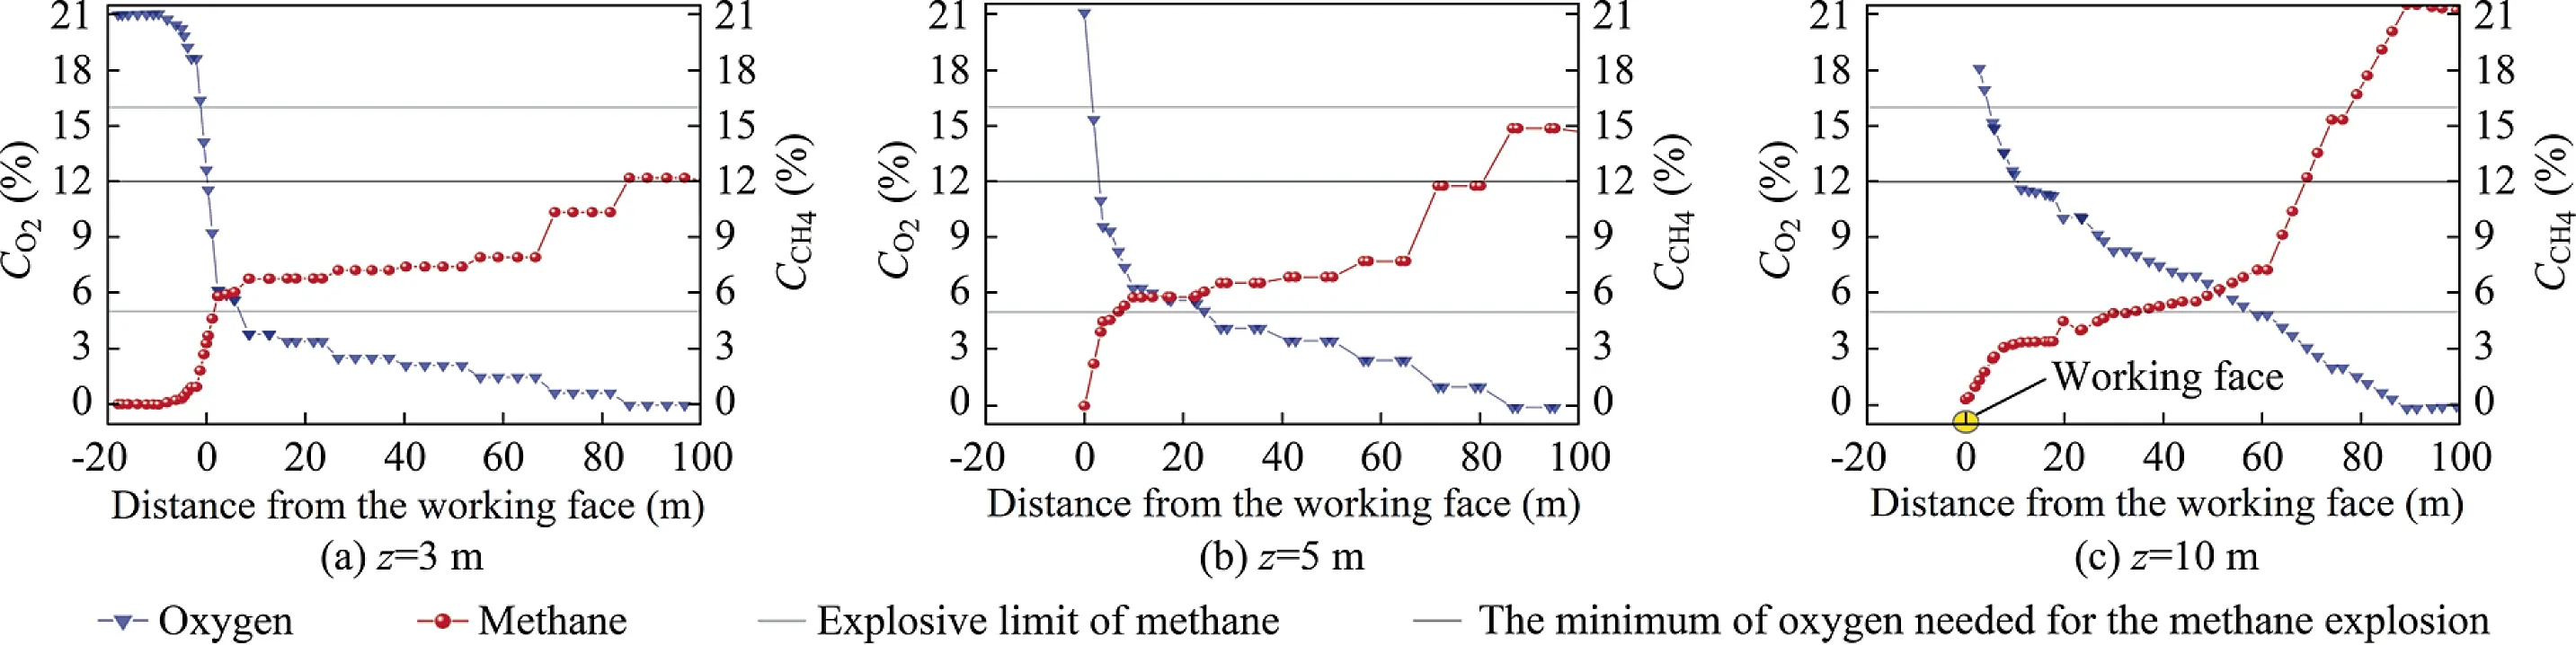
Fig.7.Changes in the methane and oxygen concentrations under a gas emission of 22.45 m3/min.
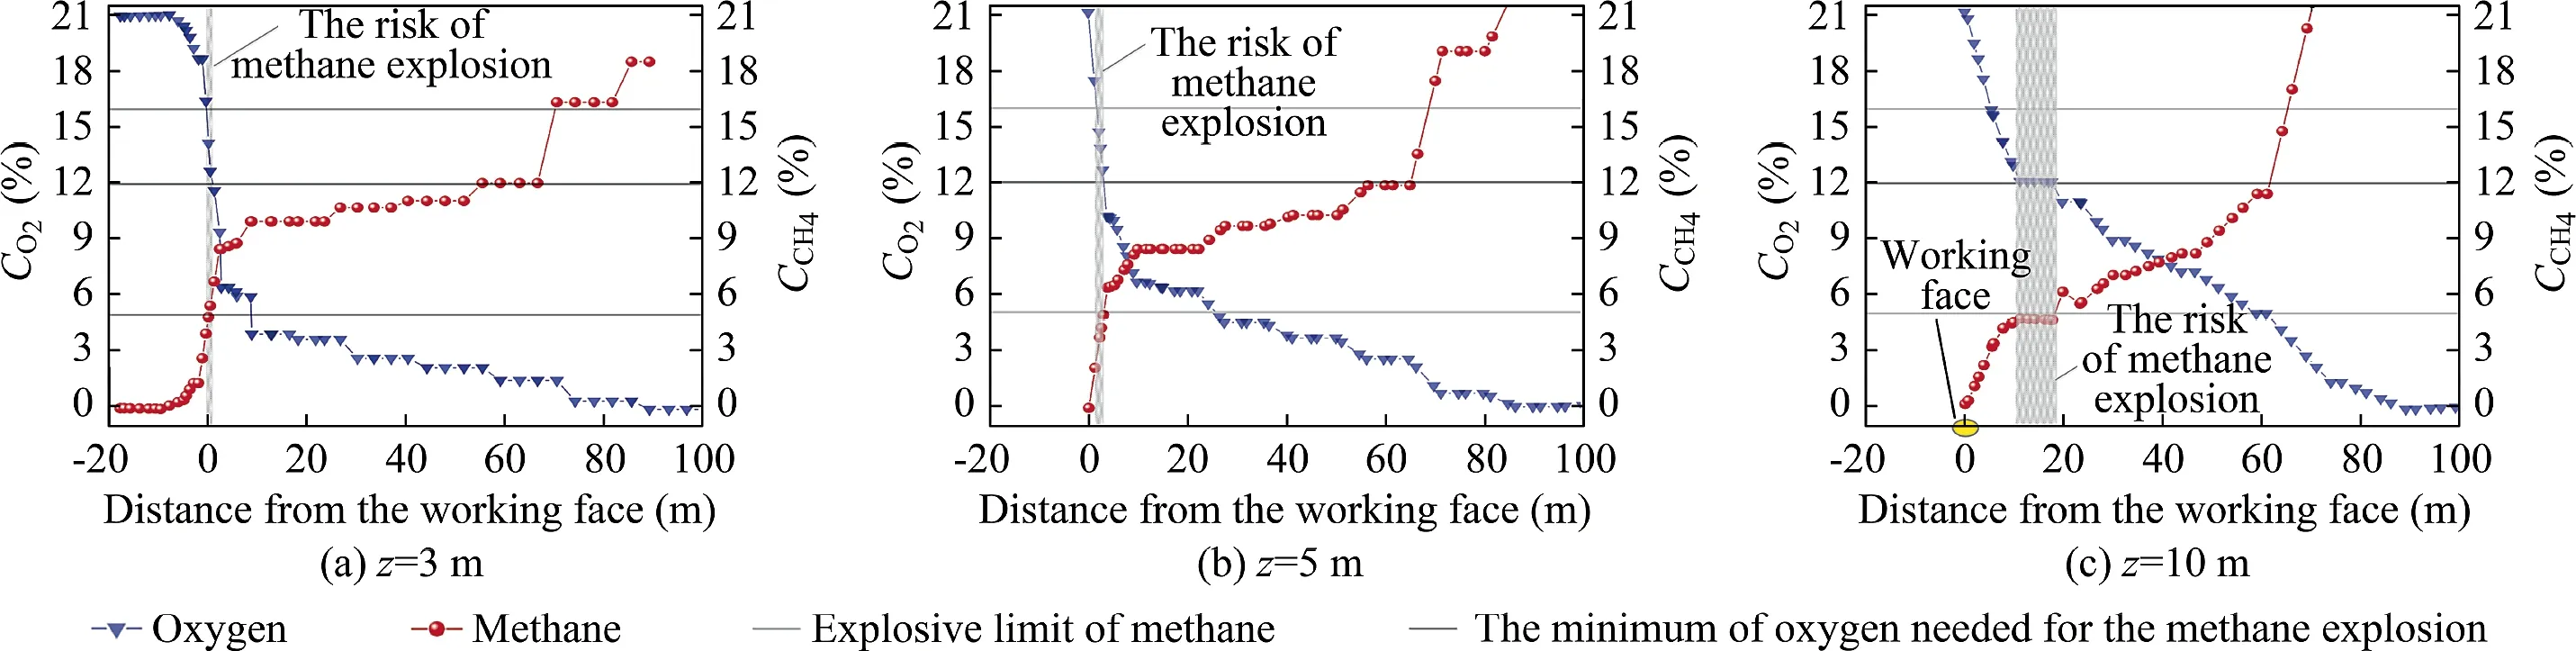
Fig.8.Changes in the methane and oxygen concentrations under a gas emission of 33.70 m3/min.
In order to further study the intake side area with the highest risk of gas explosion in the goaf,Figs.7–9 show the changes in the methane and oxygen concentrations at heights of 3,5,and 10 m along the air intake direction at different gas emissions when the ventilation flux was 3000 m3/min.The oxygen and methane concentration at a gas emission of 22.45 m3/min along the air intake direction is shown in Fig.7.Due to the influence of ventilation,the methane concentration near the working face is low.The goaf further away from the working face has a higher degree of compaction and smaller porosity,so that the methane released by residual coal in the deep goaf cannot be taken away by ventilation,resulting in the increasing methane concentration.When the gas emission was low,the changes in the gradient of methane concentration were small.The area where the methane concentration was within the explosive limit was concentrated at high and deep locations.When the oxygen concentration was above the minimum needed for a gas explosion,the methane concentration was still low.Thus,no explosive risk was presented.
When increasing the amount of gas emission to 33.70 m3/min,the methane explosion risk varies with height of goaf,as shown in Fig.8.The methane explosion risk was small at a height of 3 m and extended into the air intake.At heights of 5 and 10 m,the width of the scope of methane explosion risk zone increased from 3 to 11 m and the scope of the methane explosion risk zone moved from 4 to 16 m away from the working face.The change in the oxygen and methane concentrations along the air intake direction at a gas emission of 44.45 m3/min are shown in Fig.9.The greater the gas emission,the more remarkable the changes in the gradient of methane concentration.When the gas emission increased from 33.70 to 44.45 m3/min,the scope of the methane explosion risk zone extended thinly further into the air intake.Moreover,comparing Fig.8c with Fig.9c,it can be seen that when more gas was emitted into the goaf,the width of the scope of the methane explosion risk zone increased from 16 to 21 m.
3.5.Quantitative risk analysis of gas explosion in goaf
The CEHZ in the goaf is dynamically changed.As the working face advances,the CEHZ at a specific location gradually moves away from the working face,and becomes a safe area due to the decrease of oxygen concentration.Due to the continuous dilution of the air flow at intake roadway,the methane concentration near the working surface is always below the lower explosion limit,which is also regarded as a safe area.However,the CEHZ is constant relative to the position in the goaf.The areas where methane is within the explosion limit or where oxygen concentration is greater than 12% are considered as areas with risk factors for gas explosion.The width and volume of these areas can be expressed by Eqs.(11) and (12),respectively.
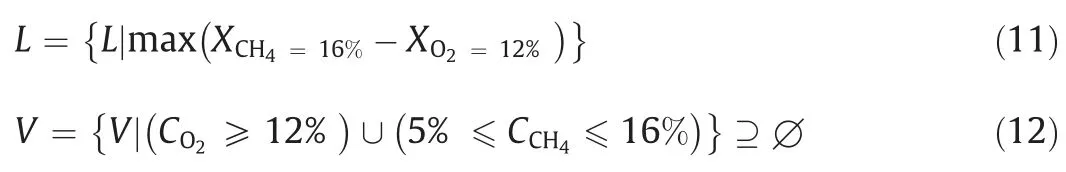
where XCH4=16%is the position in the x-direction with a methane concentration of 16%,in m; and XO2=12%the position in the xdirection with an methane oxygen of 12%,in m.

Fig.10.The volume of the hazard zone versus different air quantity and gas emission.
In order to quantitatively analyse the gas explosion risk in the longwall goaf area,an index of gas explosion risk(χ)was proposed and expressed as

where Veis the gas explosion volume; Lmaxthe maximum width of the CEHZ along the working face advancing direction,in m;and Ve/V and Lmax/L the explosive severity and explosibility probability of the coal seam in the goaf,respectively.
The CEHZs in space are integrated to obtain the volume of the 3D CEHZ,as shown in Fig.10.The volume of the CEHZ decreased with increasing air quantity (Q) and increased with increasing gas emission.However,when the gas emission increased to above 50 m3/min,the volume of the CEHZ no longer decreased with the increase of air quantity.With more air quantity,it was easier to reduce the methane concentration to the explosion limit range when the gas emission in goaf was larger,thus resulting in the increase of gas volume within the explosion limit.
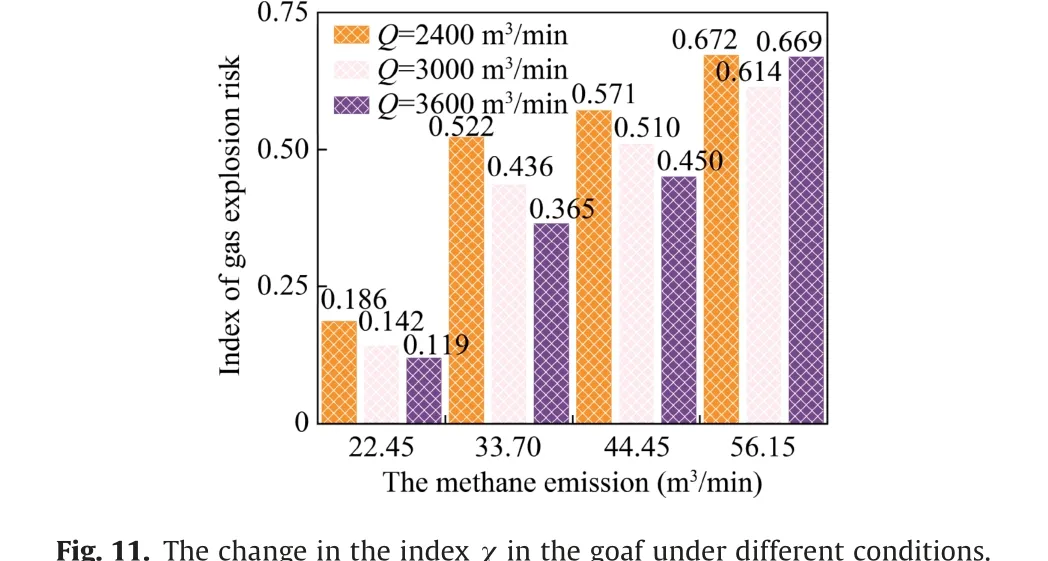
Fig.11 shows the change in the index χ at different air quantity and gas emission.As the air quantity increased,the gas explosion risk was reduced.When the air quantity was 2400 m3/min,the index value at 56.15 m3/min gas emission was the highest,followed by that at 44.45 m3/min gas emission.When the air quantity was 3600 m3/min,the index value at 22.45 m3/min gas emission was the lowest.Significantly,there was no longer a linear downward trend for the index of the gas explosion risk when increasing the gas emission to 56.15 m3/min,and the index values at different air quantities were all above 0.6,with the difference within the range of 0.0–0.1.
Fig.11.The change in the index χ in the goaf under different conditions.
4.Conclusions
In order to gain an in-depth understanding of the gas explosion risk,a three-dimensional model of numerical simulation in a longwall goaf was built.The three-dimensional distribution and mathematical model of oxygen and methane concentration at different air quantities and gas emission were simulated.The CEHZs and the gas explosion risk in longwall goafs can be quantitatively determined through the proposed finite element model.Based on the results of this study,the following conclusions can be drawn.
(1) Increasing air quantities tended to diminish the CEHZ and caused it to move towards the deeper goaf area.Moreover,the higher air quantities caused the CEHZ to move into the intake side,and the return roadway was essentially unaffected by the risk of gas explosion.The intake side was the most hazardous area.
(2) Gas emissions were higher in the longwall goaf areas,and the scope of the methane explosion risk zone was larger along the intake direction.At low heights of the goaf,the scope of methane explosion risk zone was small but extended well into the intake.At loftier heights,the scope of methane explosion risk zone moved away from the working face.Moreover,when the amount of gas emission was low,the methane explosion risk along the intake direction was non-existent.
(3) The gas explosion risk in the goaf reduced with increasing ventilation flux.However,when the gas emission was high,increasing the ventilation flux had little effect on reducing the gas explosion risk and the gas explosion risk index no longer showed a linear downward trend.Therefore,in order to dilute the gas in the goaf of gassy mines,it is not possible to increase air quantity blindly,and various measures such as nitrogen injection should be taken.According to the related variable parameters and the level of mine gas in the field,the model can be used to analyse the explosion risk quickly and quantitatively in gassy longwall mining goafs.
Acknowledgements
This work is supported by the National Key Research and Development Program of China (No.2018YFC0808100),the Fundamental Research Funds for the Central Universities (No.2652018098),and the Cultivation Fund from the Key Laboratory of Deep Geodrilling Technology,Ministry of Natural Resources(No.PY201902).
杂志排行
矿业科学技术学报的其它文章
- Performance evaluation of near real-time condition monitoring in haul trucks
- Correlating common breakage modes with impact breakage and ball milling of cement clinker and chromite
- Key technologies and engineering practices for soft-rock protective seam mining
- Effect of the distributor plugging ways on fluidization quality and particle stratification in air dense medium fluidized bed
- Experimental study on methane dissolved in surfactant-alkane system
- Effect of slurry conditioning on flocculant-aided filtration of coal tailings studied by low-field nuclear magnetic resonance and X-ray micro-tomography