Achieving an optimal shock-wave mitigation inside open channels with cavities for weak shock waves: A computational study
2020-11-04BrahmiHadjadj
N. Brahmi*, A. Hadjadj
Normandie University, Institut National des Sciences Appliquées of Rouen, CNRS, CORIA, 76000 Rouen, France
Keywords: Shock diffraction Shock reflection Shock attenuation Vortex generation
ABSTRACT This paper deals with a numerical study of weak shock-waves propagation and their attenuation in channel flow having different heights and exhibiting a hollow circular cavities with different depths and diffraction angles inside. The effect of initial diffraction angle and cavity depth on the shock mitigation is investigated. A better shock attenuation is achieved with diffraction angle by a factor of approximately 17% in terms of shock-Mach number and 38% in terms of total energy.The obtained results show also, in addition to the initial diffraction angle and cavity depth, the importance of reducing the channel heights as well as the position of the reduced section in achieving an optimal shock-wave attenuation. The presence of a cavity inside the channel helps to attenuate faster the shock wave. The underlying physics relies on the shock diffraction phenomenon that generates large amount of vortical structures capable of dissipating part of the shock energy by inducing a pressure loss behind it. A subtle arrangement of channel position/height and a cavity location leads to an efficient pressure attenuation by approximately a factor of 57% for and 16% for.
The propagation of planar shock waves inside channels,mines of underground bunkers can create serious human injury and installations damage due to several wave reflections that can locally generate zones of dangerous high-pressure amplification.Thus, the knowledge of shock-wave propagation in confined media is essential for engineering applications dealing with safety, blast wave and explosion attenuation. This is why many studies regarding ways to attenuate oncoming shock or blast waves were conducted in the past. Shock-wave attenuation can be achieved by various means, e.g. foams [1-3], porous materials, granular filters, metallic grids, perforated plates,branched/bend duct [4-6], duct with rough walls, etc. Other possibilities consist of using obstacles with appropriate geometries to attenuate shocks [7-9]. From a numerical point of view, attenuating a shock wave in a two-dimensional channel floor with rigid obstacles has been investigated by Chaudhuri et al. [10].Obstacles of different shapes, i.e., cylindrical, square and triangular were placed in either staggered or non-staggered matrix forms. The pressure evolutions upstream and downstream of the matrices were monitored as to evaluate the attenuation effect.Results showed that the staggered matrix of reversed triangular prisms is the most efficient combination in mitigating shock waves. For the same purpose, Wan et al. [11] have studied the possibility of attenuating shock waves by using a water spray obstacles. According to their study, water drops have the potential to efficiently attenuate shock waves given the important amount of heat that could be absorbed by water when mitigating the blast wave. In their study, shock attenuation effects of the water spray have been compared to solid obstacles devices using the same geometrical setup. Results showed that water like cylinders have a better capability to absorb the shock energy compared to solid obstacles of the same blockage area. Britan et al. [12] investigated the attenuation of an incident shock by porous barriers having different geometries and porosities. Using a one-dimensional modeling approach, it was found that the overpressure acting on an end-wall protected by a barrier decreases almost linearly with increasing distance between the end-wall and the barrier. Berger et al. [13] investigated experimentally the effects of different types of obstacles on the load developed by a shock wave. They identified the most influential parameters,noting that the geometry is the second most significant parameter in attenuating/amplifying the shock wave loads. It turns out that understanding the complex wave dynamics and the flow patterns is crucial for designing shock attenuators or shock amplifiers. Mortazawy et al. [14] presented both experimental and numerical investigations of normal shock with different strengths propagating inside ducts with surfaces roughness added in the form of grooves. Their results showed the effectiveness of roughness in terms of grooves in attenuating shock waves. The case of a planar shock-wave propagation through a double-bend duct was investigated numerically by Chaudhuri[15]. Contrary to the shock-shear layer and shock-boundary layer dynamics, the principal shock wave patterns are seen to be less dependent on the flow Reynolds number. As for the overpressure attenuation, a factor of about 0.51 was found for shock wave Mach-number Ms= 1.53. Shi et al. [16] investigated the influence of high temperature effects on the protrusion of Mach stem in strong shock reflection over a wedge. The protrusion degree depends on the thermal energy buffer capacity of the testing gas that escalates the protrusion effect. In a recent numerical study, Brahmi et al. [17] investigated shock-wave diffraction over double concave cylindrical surfaces. This study reveals that the shock velocity deficit increases by increasing the shock-Mach number. In a second study [18], the authors showed that the first concave surface is effective in decreasing sufficiently the dynamic as well as the static pressure impulses. The results showed also the effect of the reflected and the secondary shocks in increasing the overall overpressure.
For attenuating shock/blast waves propagating inside channels, Igra et al. [19] summarized existing experimental and numerical studies related to geometrical aspects. Examples include abrupt changes in the channel geometry, and introduction of rigid barriers along the shock wave path.
Based on the above discussion, it is clear that the attenuating shock/blast waves propagating inside channels is still an active research topic where much effort is still needed to better understand the physical mechanism of the shock mitigation in confined areas. Intending to shed more light on this complex fluid problem, numerical simulations, solving two-dimensional compressible Navier-Stokes equations, are used to study the shock waves propagation inside channels. The main objective of the present study is to better understand the physical aspects of shock propagation and its attenuation in confined areas with embedded cavities inside. The optimization of the channel geometry and dimensions for better shock wave attenuation is one of the main scope of the present contribution.
The numerical simulations carried out in this study are based on the use of an in-house parallel compressible solver, called CHOC-WAVES. The code is equipped with an adaptive multiresolution method for mesh refinement [20-22], along with an immersed boundary method (IBM) to handle fluid-solid interaction problems [23]. The solid bodies, identified using a ray-tracing technique, are embedded into a Cartesian grid. Two-dimensional fully compressible Navier-Stokes equations are solved assuming the gas as ideal and the viscosity obeying to Sutherland's law. Inviscid and viscous fluxes are computed using a fifth-order weighted essentially non-oscillatory (WENO)scheme and a fourth-order central difference formula, respectively. The time is advanced using a third-order Runge-Kutta method [24]. The code is validated through a variant of test problems including shock/shock, shock/turbulence and shock/obstacles interactions [20-22].
As for the computational specifications, the boundary conditions are set to inlet and outlet at the left and the right sides of the computational domain, respectively. The solid boundaries(top and bottom) are treated as no-slip walls (see Fig. 1).
The problem setup of the simulations is shown in Fig. 1. In all the considered simulations, the cavity radius, R, is kept constant as R = 50 mm. Since R is kept constant and the cavity depth, d, is varied, the initial cavity angle,θw, must necessarily vary in order to keep the circular shape of the cavity. In this study we chose three different values of 60°, 90° and 140°. Two shock wave Mach-numbers are used namely, Ms= 1.6 and 1.1. The moving normal shock wave is initiated by imposing the Rankine-Hugoniot relations across an initial discontinuity. The simulations are carried out using a structured mesh with more than 80 million points with 28 processors. A single simulation took on average 200 hours which makes 5600 CPU hours.
Figure 2 shows a schematic illustration of the shock diffraction process past cylindrical cavities. Shortly after the penetration of the shock into the cavity, the expanded flow evolves into a complicated system of distorted and secondary shocks with separation regions (depending on the diffraction angle) and an endwall corner vortex is formed with a rolling-up of eddies that are convected quasi-linearly away from the cavity entrance as the diffraction process evolves. In addition to this important primary vortex, a secondary instabilities appear along the cavity wall forθw≤ 90°.
Here, we present the effect of different cavity depths and diffraction angles on the shock-wave patterns by comparing them to the case without cavity (a straight tube).
Figure 3a shows the space-time evolution of the shock wave.One can see that the transmitted shock reaches the channel exit earlier for the straight tube then forθw= 60° and later for 140°and 90°, respectively. These results are also highlighted through the variation of the shock-wave speed, presented in Fig. 3b in terms of Msand total energy presented in Fig. 3c. For all cases,we first notice a constant shock wave Mach-number and energy.After the diffraction process starts, an end-wall corner vortex is formed with a rolling-up of eddies. The formation of these vortices leads to a shock velocity and energy drop, except for the straight tube for which the shock velocity and energy remain quasi-constant. As this process evolves in time, the shock patterns differ from one case to another depending on the cavity geometry.
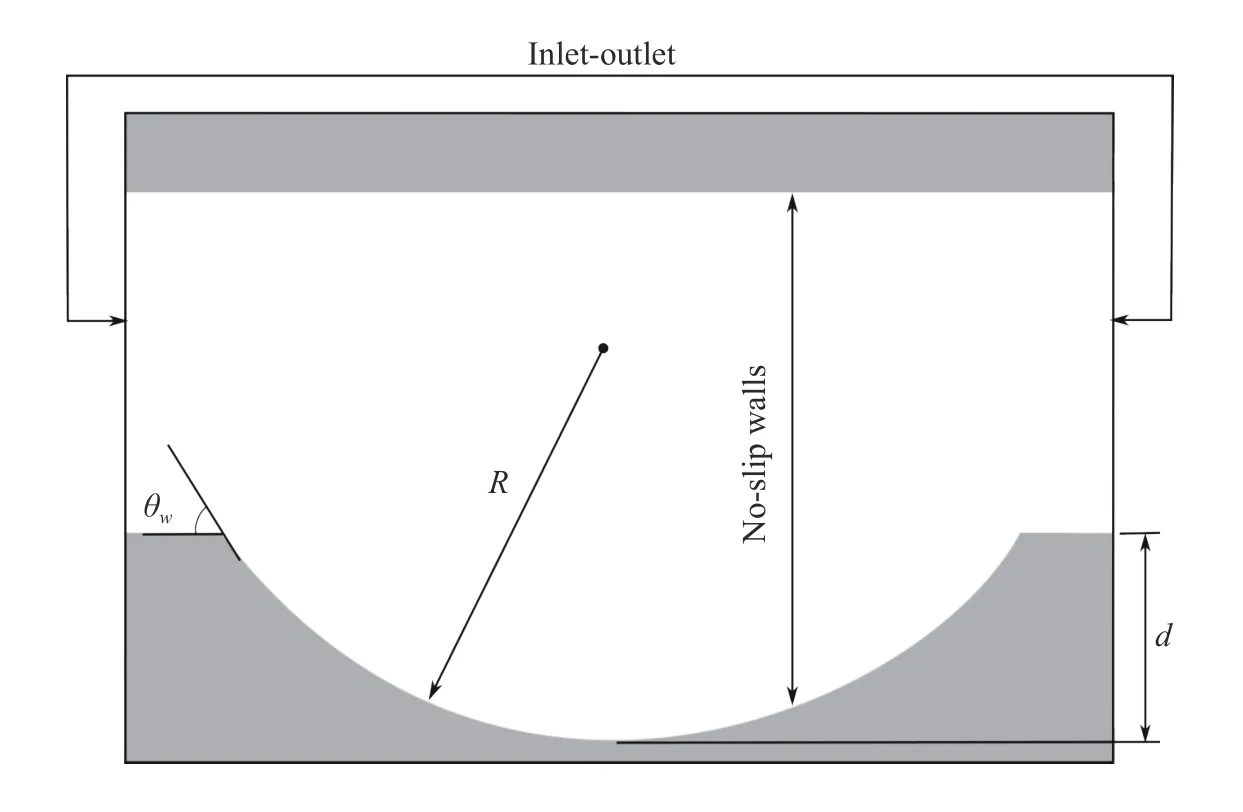
Fig. 1. Schematic representation of the problem setup. θw: initial cavity angle, R: cavity radius, d: cavity depth.
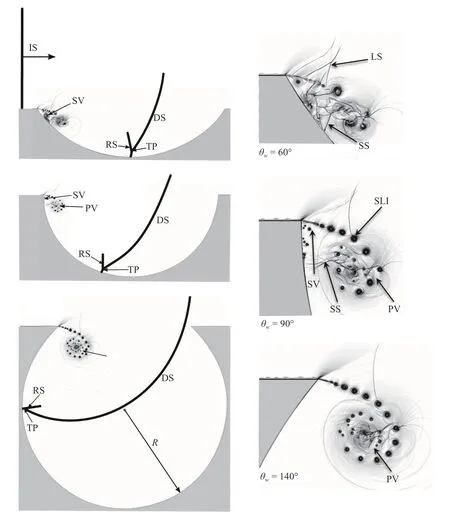
Fig. 2. Shock diffraction for different initial cavity angles and depths. IS: incident shock; RS: reflected shock; DS: diffracted shock; TP: triple point; PV: primary vortex; SV: secondary vortex; LS: lambda shock; SLI: shear-layer instabilities; SS: secondary shock. The images on the right side are the enlargement of the portions on the left side.
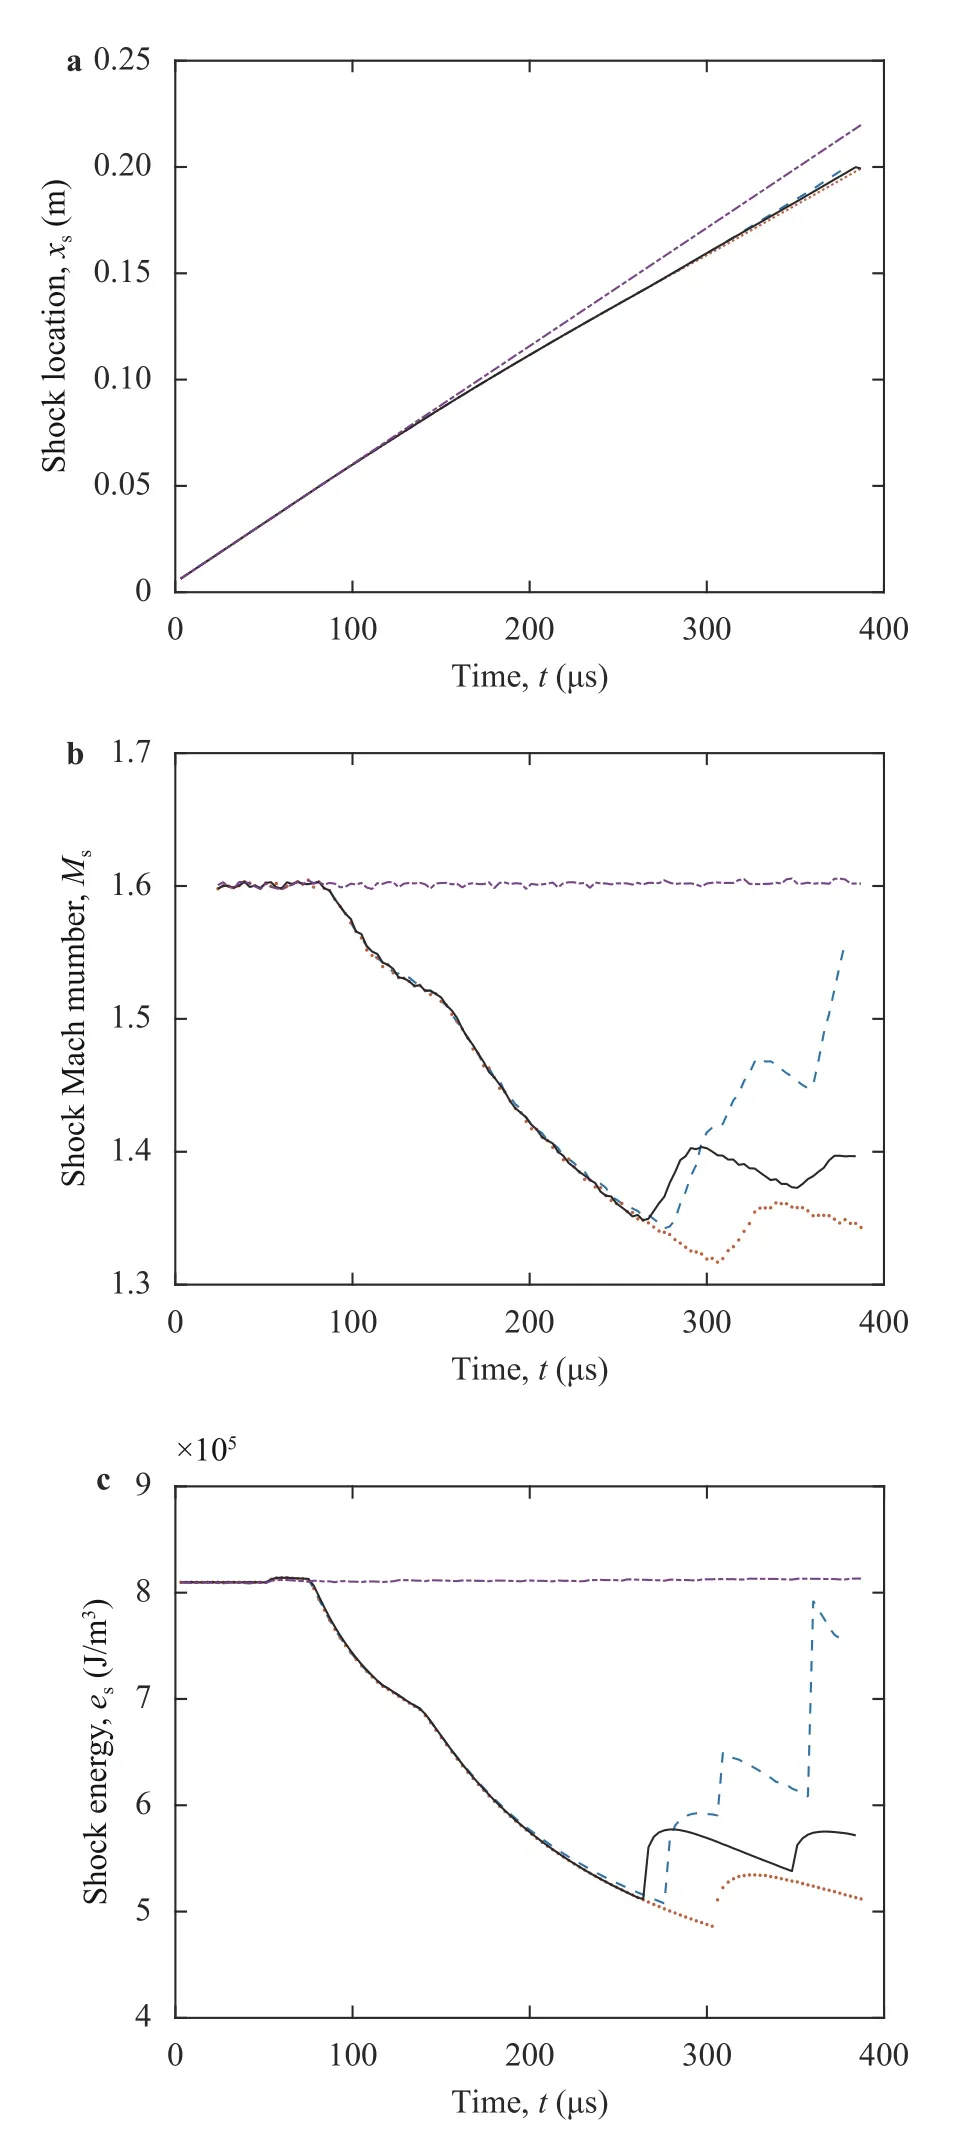
Fig. 3. Time history of a shock position, b shock Mach number, and c shock energy for different diffraction angles (blue dash line: θw =60°, red dot line: θw = 90°, black line: θw = 140°, dash-dot line: straight tube).
Forθw= 60°, we notice a drop in the shock velocity and energy until three successive peaks appear att≈ 280, 305, and 360 μs, respectively. In order to understand the origin of these peaks we will discuss the shock reflection phenomenon in the second half of the cavity (depicted in Fig. 4). Roughly in the middle of the cavity, an inverse-Mach reflection (InMR) configuration appears. A bit further, in the second half of the cavity (rising part),the InMR terminates to a transitioned regular reflection (TRR),with two additional shocks,r'andd'(as shown in Fig. 4b). The additional shock,d', catches the incident shock (I) at the exit of the cavity and merge together into a single shock (see Fig. 4c).This process increases the shock velocity and energy and forms a new transmitted shock,I', hence the first velocity and energy jumps of the graphs. Note thatr'will catch the new transmitted shock (I'), and increases the velocity and the energy behind by forming a new transmitted shock,I''. This phenomenon is observed through the second velocity and energy jumps of the plots. The additional shocks,r'andd', from the TRR configuration, will successively be reflected from the upper boundary forming new reflected shocks,r''andd'', which will merge together into a more intense shock,d*. The new shock,d*, catches the incident shock,I'', and merge together into a single stronger shock,I*, at the exit of the channel (see Fig. 4(d, e)). The speed and the energy of the resulting shock are enhanced. This phenomenon is observed through the third velocity and energy jumps.
Forθw= 90°, we notice a drop in the shock velocity and energy towards a lower value. A peak appears att≈ 310 μs. Att≈216 μs, the incident shock, hits the upper right corner of the cavity giving birth to a direct-Mach reflection (DiMR) inducing to the formation of a reflected shockr1.r1catches the incident shock at the channel exit and merge into a single shock. This process increases the shock velocity and energy and formsI',hence the velocity and energy jumps of the graphs. The reflection process is highlighted in Fig. 5.
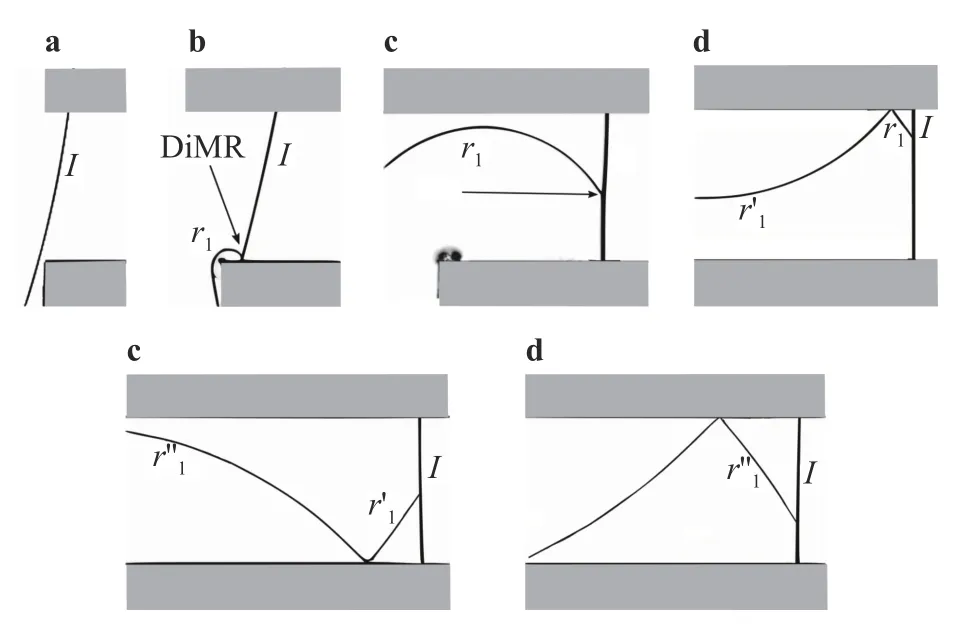
Forθw= 140°, two successive peaks appear att≈ 260 and 350 μs, respectively. As forθw= 90°, the incident shock, hits the upper right corner of the cavity leading to the formation of a DiMR inducing to the formation of a reflected shockr1.r1catches the incident shockIand merge together into a single shock (see Fig.6(a, b)) increasing the shock velocity and energy by the formation ofI', hence the first velocity and energy jumps. The reflected shockr1is again reflected by the upper boundary. The new reflected shock,r'1catches the transmitted shock,I', hence the second velocity and energy jumps. The reflection process is highlighted in Fig. 6.
Figure 7 represents spatial distribution, aty/R= 2, of energy along with numerical schlieren pictures for different configurations att= 378 μs. Forθw= 60°, presented in Fig. 7a, the energy is decreasing until a series of peaks appears. These peaks are due to the formation of secondary and reflected shocks. The most intense peak is located atx/R≈ 0.6, which is caused by the merger of the secondary shock, SS, and the reflected shock,r*.
As forθw= 60°, forθw= 90°, presented in Fig. 7b, the energy is decreasing until a secondary shock appears to increase the energy level. A bit further, atx/R≈ 1.6 , an intense peak appears due the reflected shockrthus increasing the energy level to a higher value. After this important peak, a series of less intense peaks appears due to the reflected shocks from the upper and the lower boundaries. It is important to mention that the transmitted shock energy forθw= 90° at the channel exit is reduced by 32% compared to that ofθw= 60°.
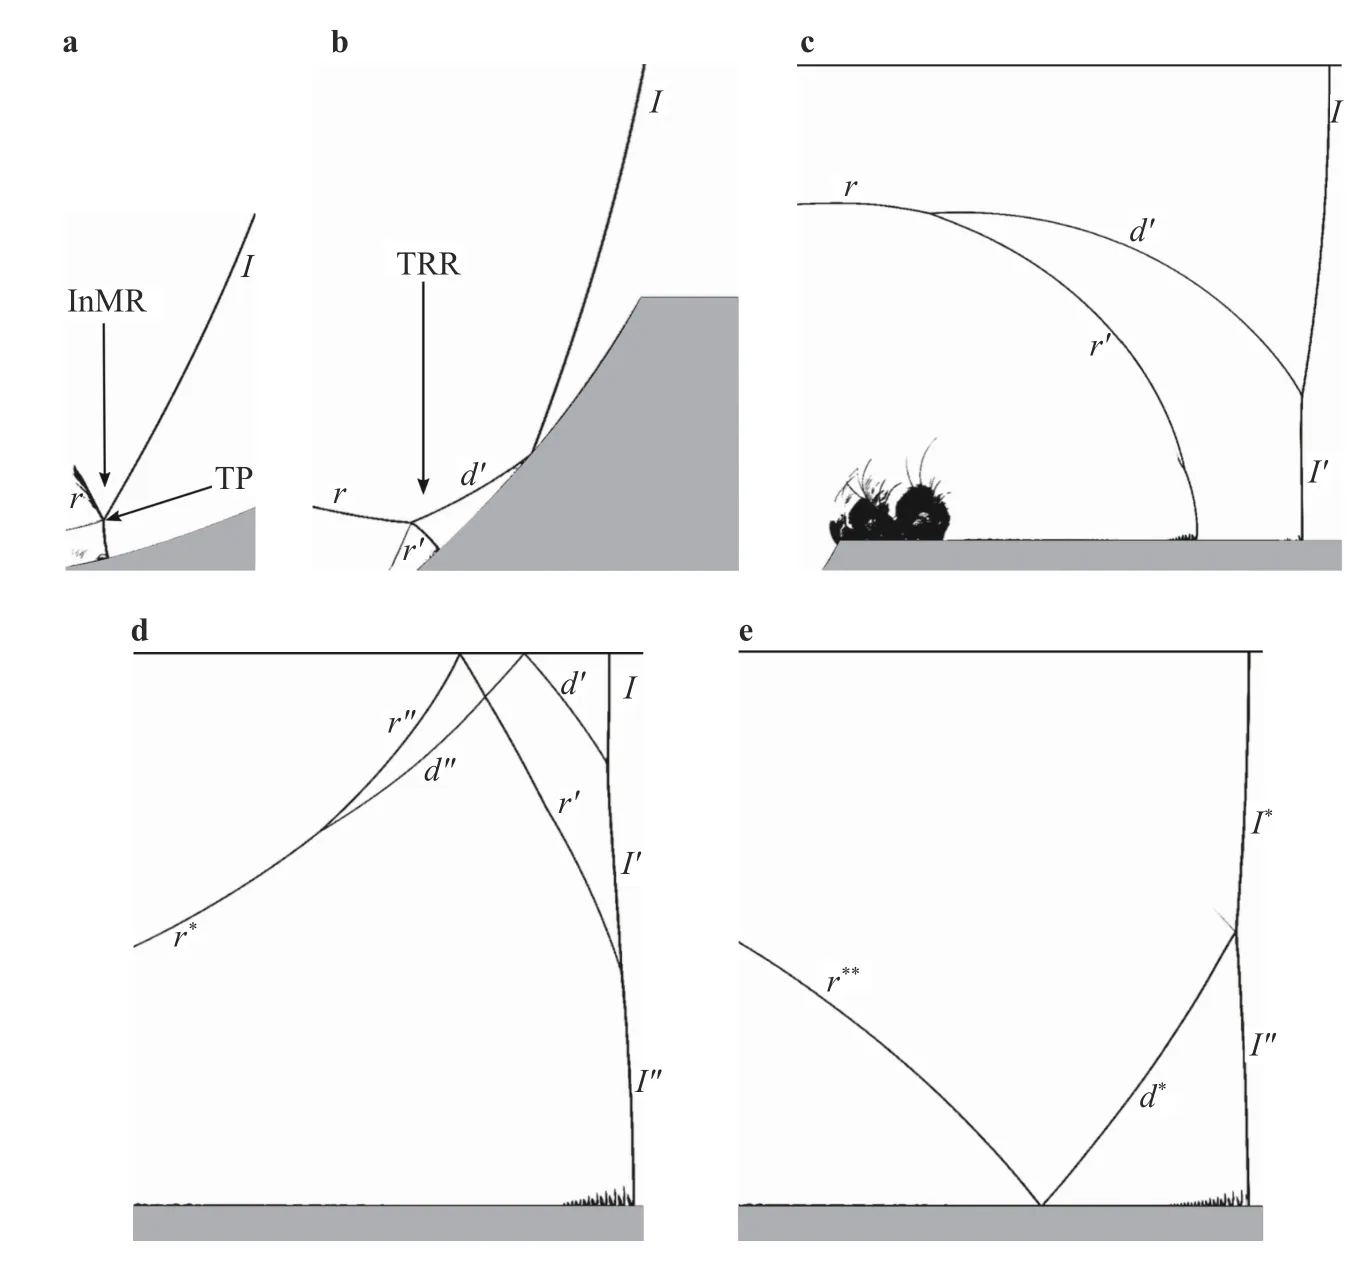
Fig. 4. Numerical schlieren pictures for θw = 60°. I: incident shock; r: reflected shock; TP: triple point; InMR: inverse-Mach reflection; TRR:transitioned regular reflection; r' and d': additional shocks created from TRR state; I′: new incident shock resulting from the merger of I and d';d'' and r'' and r*: reflected shocks from the upper boundary; I′′: new incident shock resulting from the merger of r′ and I′; r**: reflected shock from the lower boundary; d*: new shock resulting from the merger of r′′ and d′′; I*: new incident shock resulting from the merger of d* and I′′.
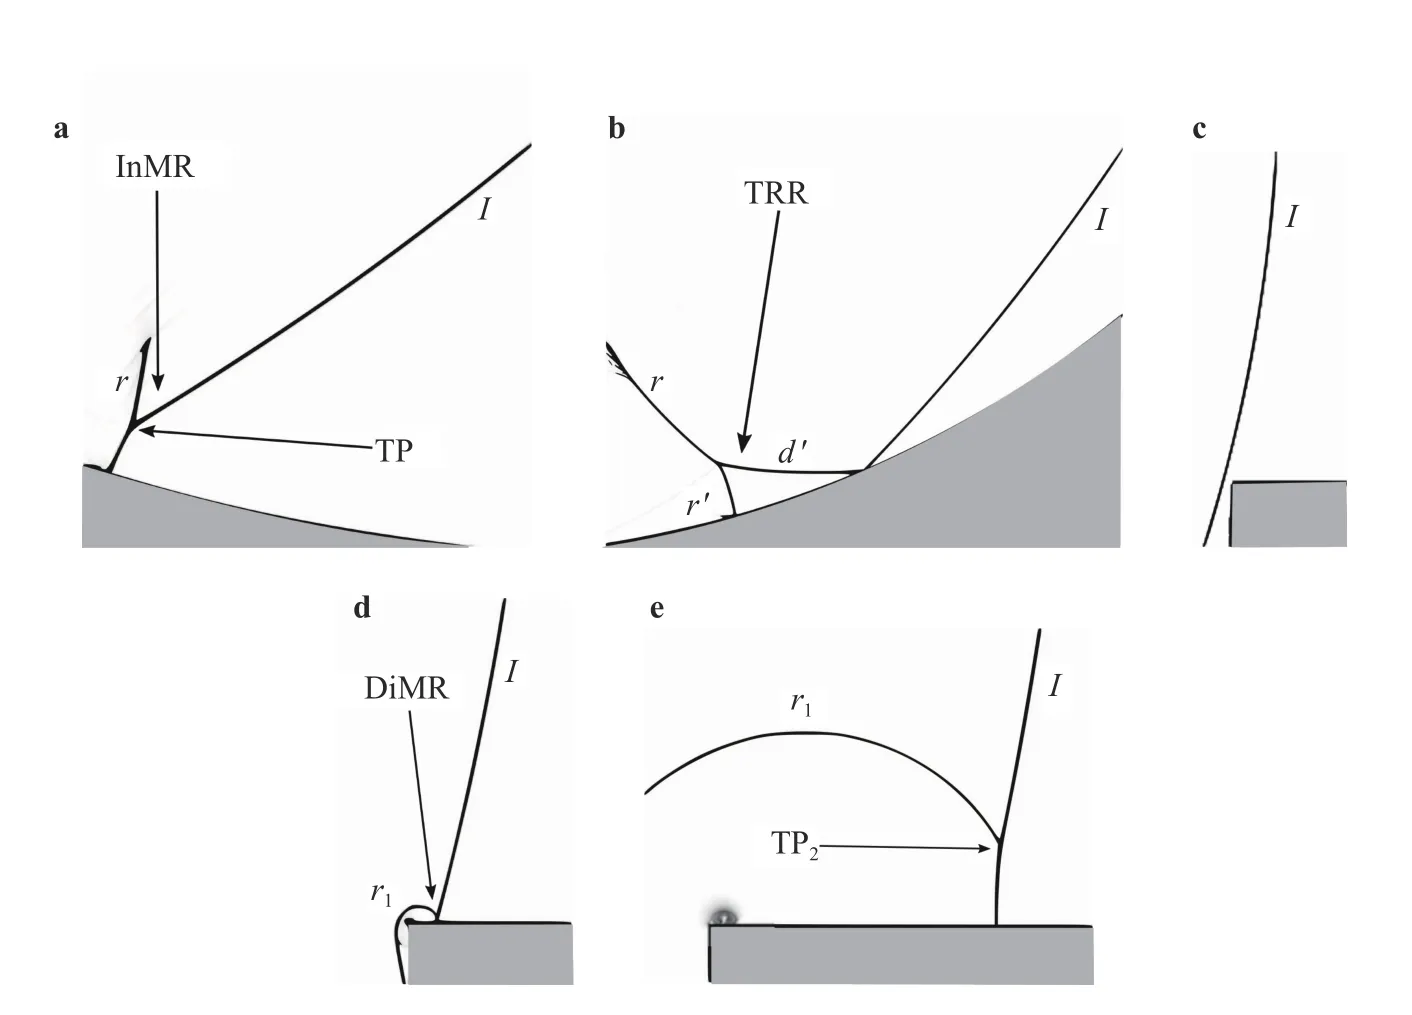
Fig. 5. Numerical schlieren pictures for θw = 90°. I: incident shock; r: reflected shock; InMR: inverse-Mach reflection; TP: triple point; TRR:transitioned regular reflection; r' and d': additional shocks created from TRR state; DiMR: direct-Mach reflection, r1: reflected shock; TP2: second triple point.
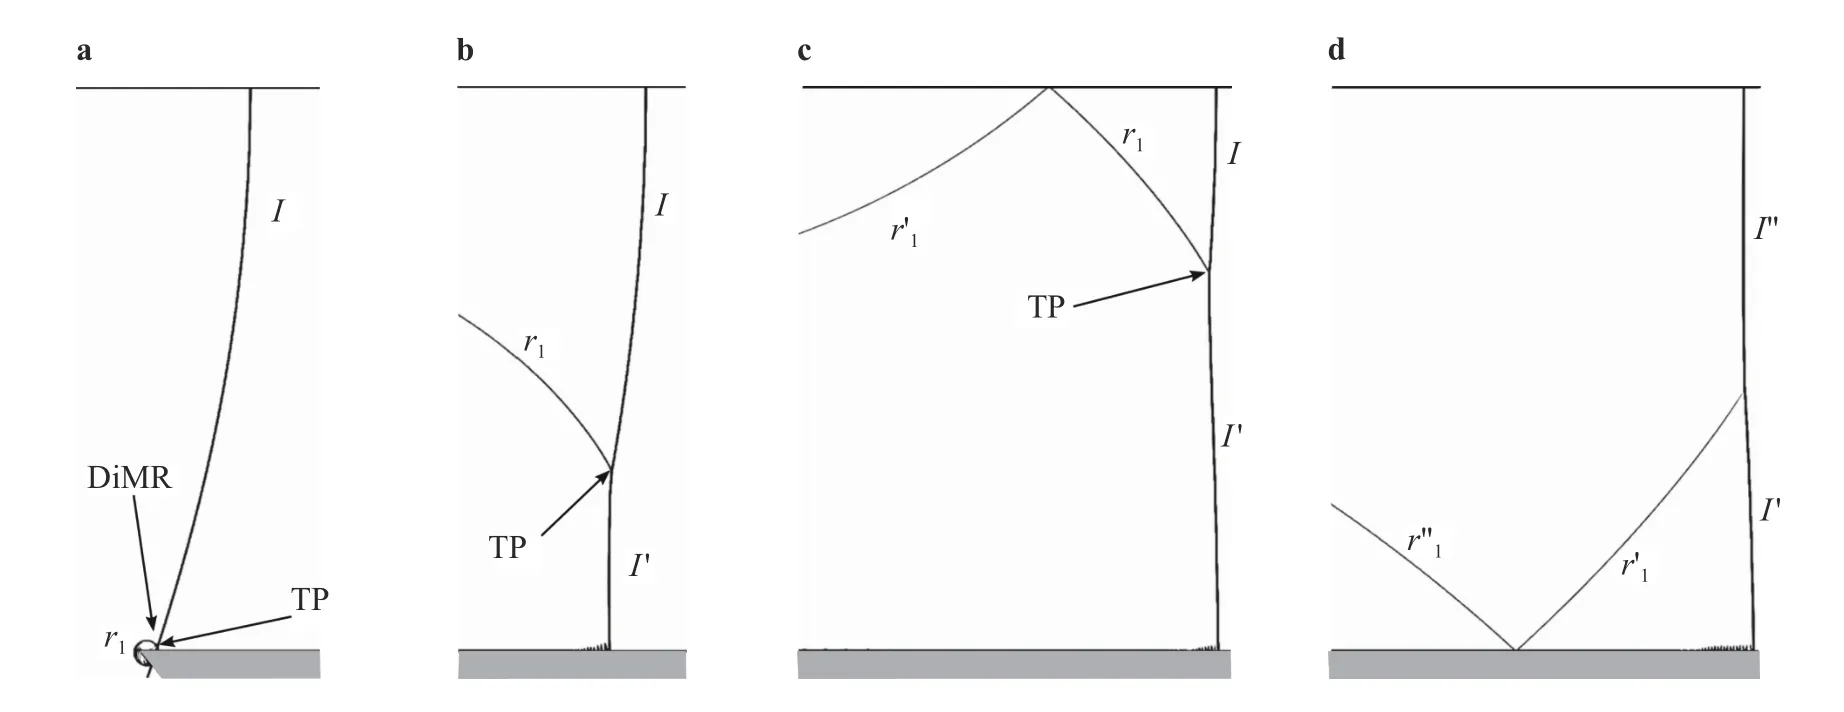
Fig. 6. Numerical schlieren pictures for θw = 140°. I: incident shock; r1: reflected shock; TP : triple point; DiMR: direct-Mach reflection; r'1: reflected shock from the upper boundary; r′′: reflected shock from the lower boundary.
For the last configuration,θw= 140°, presented in Fig. 7c, the energy decreases towards the lower value of the three configurations. Atx/R≈ 1.2, secondary shocks appear and increase the energy level to a quasi-constant value. No more considerable peaks are seen in the channel.
Although the energy level reaches its minimum forθw= 140°in the cavity zone, a better shock attenuation, in the channel exit,is achieved for the second configuration,θw= 90°, by a factor of approximately 38%, and this is due, as explained above, to the different reflection phenomena from one case to another, specially at the cavity exit.
In the first part of this study, we were interested in the effect of the cavity depth (d) and the initial diffraction angle (θw) while keeping the tunnel height (h) constant. In this second part we keptdandθwconstant while varyingh, for that we have defined:ζ=h/d, and we took two different values of the latter, namely:0.25 and 2.36. Six different cases are considered where basically the inlet and the outlet volumes have been varied to cover the most relevant situations. The problem setup is shown in Fig. 8.According to the results obtained in the first part, we chose to use the case withθw= 90° andd= 50 mm,.
Figure 9 presents numerical schlieren pictures for different configurations att= 288 μs. The incident shock wave starts to diffract over the top left corner of the cavity resulting in the formation of an end-wall corner vortex with a rolling-up of coherent structures. Roughly in the middle of the cavity, an InMR appears,whose termination leads to the formation of a TRR. More details are shown in Figs.5(a, b). At approximatelyt= 216 μs the incident shock waveIhits the upper right corner of the cavity giving birth to a DiMR inducing to the formation of a reflected shock.More details are shown in Fig. 5(c-e). After the passage of the shock, vortices are formed at the upper right corner of the cavity,and at the lower right end of the upper wall for C3 and C4 configurations. When the transmitted shock propagates further away from the cavity and approaching the channel exit, the developed flow field can be divided into two separated zones. In the first one, noted Zone A, the compressed gas expands over the cavity and forms a series of vortices that dominate the flow features in this region. The second region, named Zone B, is mostly characterized by a quasi-uniform flow, followed by a series of wave reflections arising from both InMR and TRR. Transverse waves are then created due to the reflection of the shock on upper and lower channel walls, for C2 and C4. These observations confirm the earlier findings of Berger et al. [25].
Here, we present the effect of the channel height and the position of the expanding area on the shock wave patterns. Figure 10a shows the space-time evolution of the shock wave. One can see that the transmitted shock reaches the channel exit earlier for C1, C5, C4, C6 and later for C2 and C3, respectively. These results are also highlighted through the variation of the shockwave speed, presented in Fig. 10b in terms of shock Mach-numberMs. For all cases, we first notice a constant shock speed and then a decrease just after the beginning of the diffraction process. As this process evolves in time, the shock dynamics differ from one case to another depending on the channel geometry.Thus, in order to understand the shock behavior, some important physical parameters are discussed, such as the variation of the pressure ratio,ps/p1(psbeing the pressure behind the shock wave andp1the initial pressure in the shocked gas taken as,ps=285.7 kPa). The results are presented in Fig. 11.
For case C1, depicted in Fig. 11a, the flow structures can be divided into three main parts. The first one (part I), identical for all cases, highlights the shock dynamics before the startup of the diffraction process which is represented by a short horizontal line corresponding to the initialization values of the shock. After the diffraction process starts (part II), an end-wall corner vortex is formed with a rolling-up of eddies. The formation of these vortices leads to a pressure decrease and the more this disturbed region spreads over the diffraction volume, the more the pressure decreases (see cases C2 and C3). At approximatelyt≈ 216 μs the incident shock wave (I) hits the upper right corner of the cavity giving birth to a DiMR inducing to the formation of a reflected shock,r1. The later catches up the incident shock (I) and merge into a single shock, the phenomenon is depicted in Fig. 12(a-c).This process increases the pressure ratio, hence the first pressure jump for the third phase (part III) of the graph. After that,the observed pressure state behind the propagating shock wave is fairly uniform.
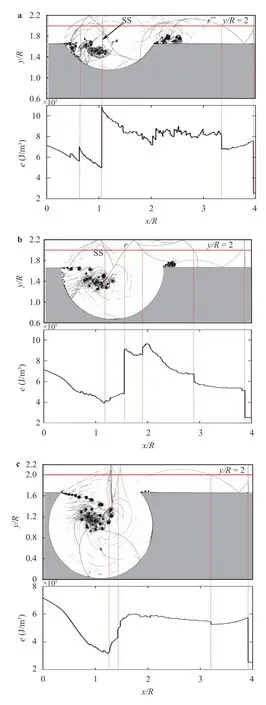
Fig. 7. Spatial distribution of energy along with numerical schlieren pictures for different configurations at t = 378 μs.
As for the first case, the pressure ratio evolution for the second one C2 can be divided into three parts (see Fig. 11b). Part I is identical to that of case C1. For part II, we notice a drop in the pressure ratio towards a lower value. By reducing the channel height toh1/d= 0.25, the formed vortex at the upper left corner of the cavity occupies a much larger volume, thus lowering further the pressure level in the cavity and behind the shock as well.For part III, we observe a presence of a series of successive three pressure jumps. The first pressure jump is caused by the DiMR,phenomenon as mentioned before. The two following pressure peaks are essentially due to the multiple shock reflections arising from the upper and the lower channel walls. These reflected shocks successively catch the transmitted shock and merge all together into a single stronger shock, the phenomenon is depicted in Fig. 12(d-f). The pressure as well as the speed of the resulting shock are bit enhanced.
As depicted in Fig. 1c, stages I and II of C3 are similar to that of C2. Indeed in stage III, we notice an additional decrease in the pressure ratio due to the formation of two vortices. The first one is initiated at the lower-right corner of the top wall and the second one takes place at the top-right corner of the cavity. The decrease of the pressure is followed by a small jump, at the start of the fourth phase IV, which is due, as explained above, to the reflected shock resulting from the DiMR configuration (r1). After this jump, the pressure ratio decreases quasi-linearly and reaches a value of approximately 0.43 at the channel exit.
Phases I and II in the fourth case, C4, presented in Fig. 11d,which in terms of geometry, is the inverse of the third case (C3),are similar to those in case C1. Phase III is similar to that of case C3. For part IV, we notice the presence of a series of successive pressure jumps. As reported previously, the first peak is caused by the reflected shock resulting from the DiMR configuration(r1). The other peaks are due to the multiple wave reflections as explained for C2.
In order to to shed more light on the effect of the cavity, we realized a case similar to C3 but without cavity. The results for this case, C5, are presented in Fig. 11e. As we can see, the pressure ratio evolution for this case is divided into two parts. The first one, I, is similar to the previous cases, the second one, II, is characterized by a drop in the pressure ratio. This pressure drop is caused by the shock-wave diffraction and the formation of vortex at the lower right corner of the upper boundary. The effect of the cavity is clearly visible by comparing the two cases where the best pressure attenuation is achieved with the cavity for C3. Note that the only difference between C3 and C5 is the absence of the cavity, all the other geometrical dimensions are kept the same.
The effect of another geometrical parameter has been investigated, namely the length of the tunnel at the inlet. The results for this case, C6, are presented in Fig. 11f. Compared to the previous case, the pressure ratio for this case starts decreasing earlier because of the early shock-wave diffraction and the formation of vortex at the lower right corner of the upper boundary. Although the pressure started decreasing earlier for C6, at the exit of the tunnel it reaches a value almost equal to that of C5. This configuration confirms the role played by the cavity in the pressure attenuation.
Table 1 shows the time variation of the pressure, defined as dp/dt=(pe-pmin)/(te-tpmin). Here,peis the pressure behind the transmitted shock at the exit of the channel,pminis the minimum pressure behind the shock,teis the instant when the shock arrives at the end of the channel andtpminis the instant when the pressure behind the shock reaches its minimum value.As shown in Table 1, the only configuration where a pressure reduction is achieved is C3. The most critical case is the one related to configuration C1, where an increase, of approximately 426 MPa/s, is obtained. Table 1 shows also the shock attenuation factorAdefined as the ratio of the relative pressure behind the transmitted shock (at the exit of the channel) to the initial shocked gas pressure such as,A=(p1-ps)/p1, wherep1=285.7 kPa andpsis the exit pressure. Comparison between all configurations indicates that the height and the expanded area position of the channel significantly affect the shock wave attenuation. The results show that a better attenuation factor is obtained for C3 (about 57%). However, for case C1 the attenuation effects are minor, about 3%.
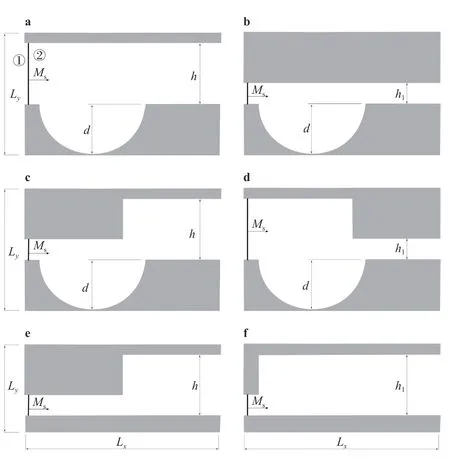
Fig. 8. Schematic illustration of the geometrical setups, a C1, b C2, c C3, d C4, e C5, and f C6. d = 50 mm: cavity depth, h: height of the first channel, h1: height of the second channel (Lx = 200 mm, Ly = 171 mm). The dimensions of the computation domain in x and y directions, respectively. ① shocked gas, ② gas at rest.
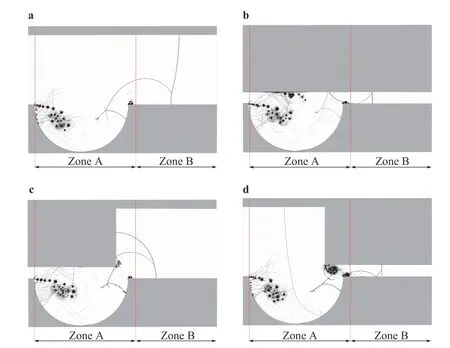
Fig. 9. Numerical schlieren pictures for different flow configurations C1, C2, C3, and C4 at t = 288 μs.
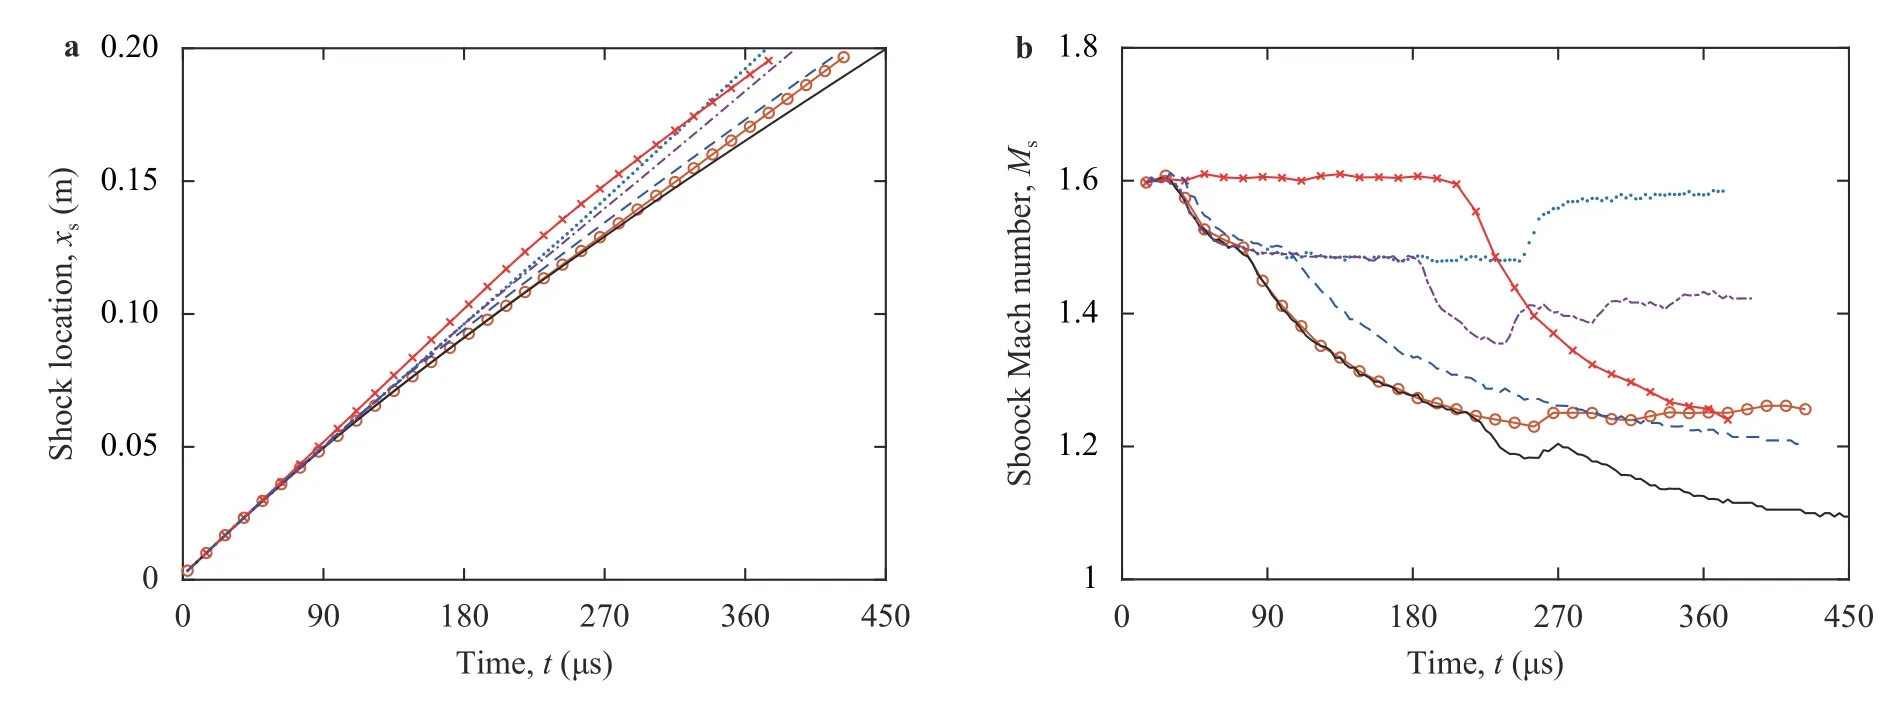
Fig. 10. Time variation of a shock location and b shock Mach number for blue dot line: C1, red "o" line: C2, black line: C3, black dash-dot line:C4, red "×" line: C5, blue dash line: C6.
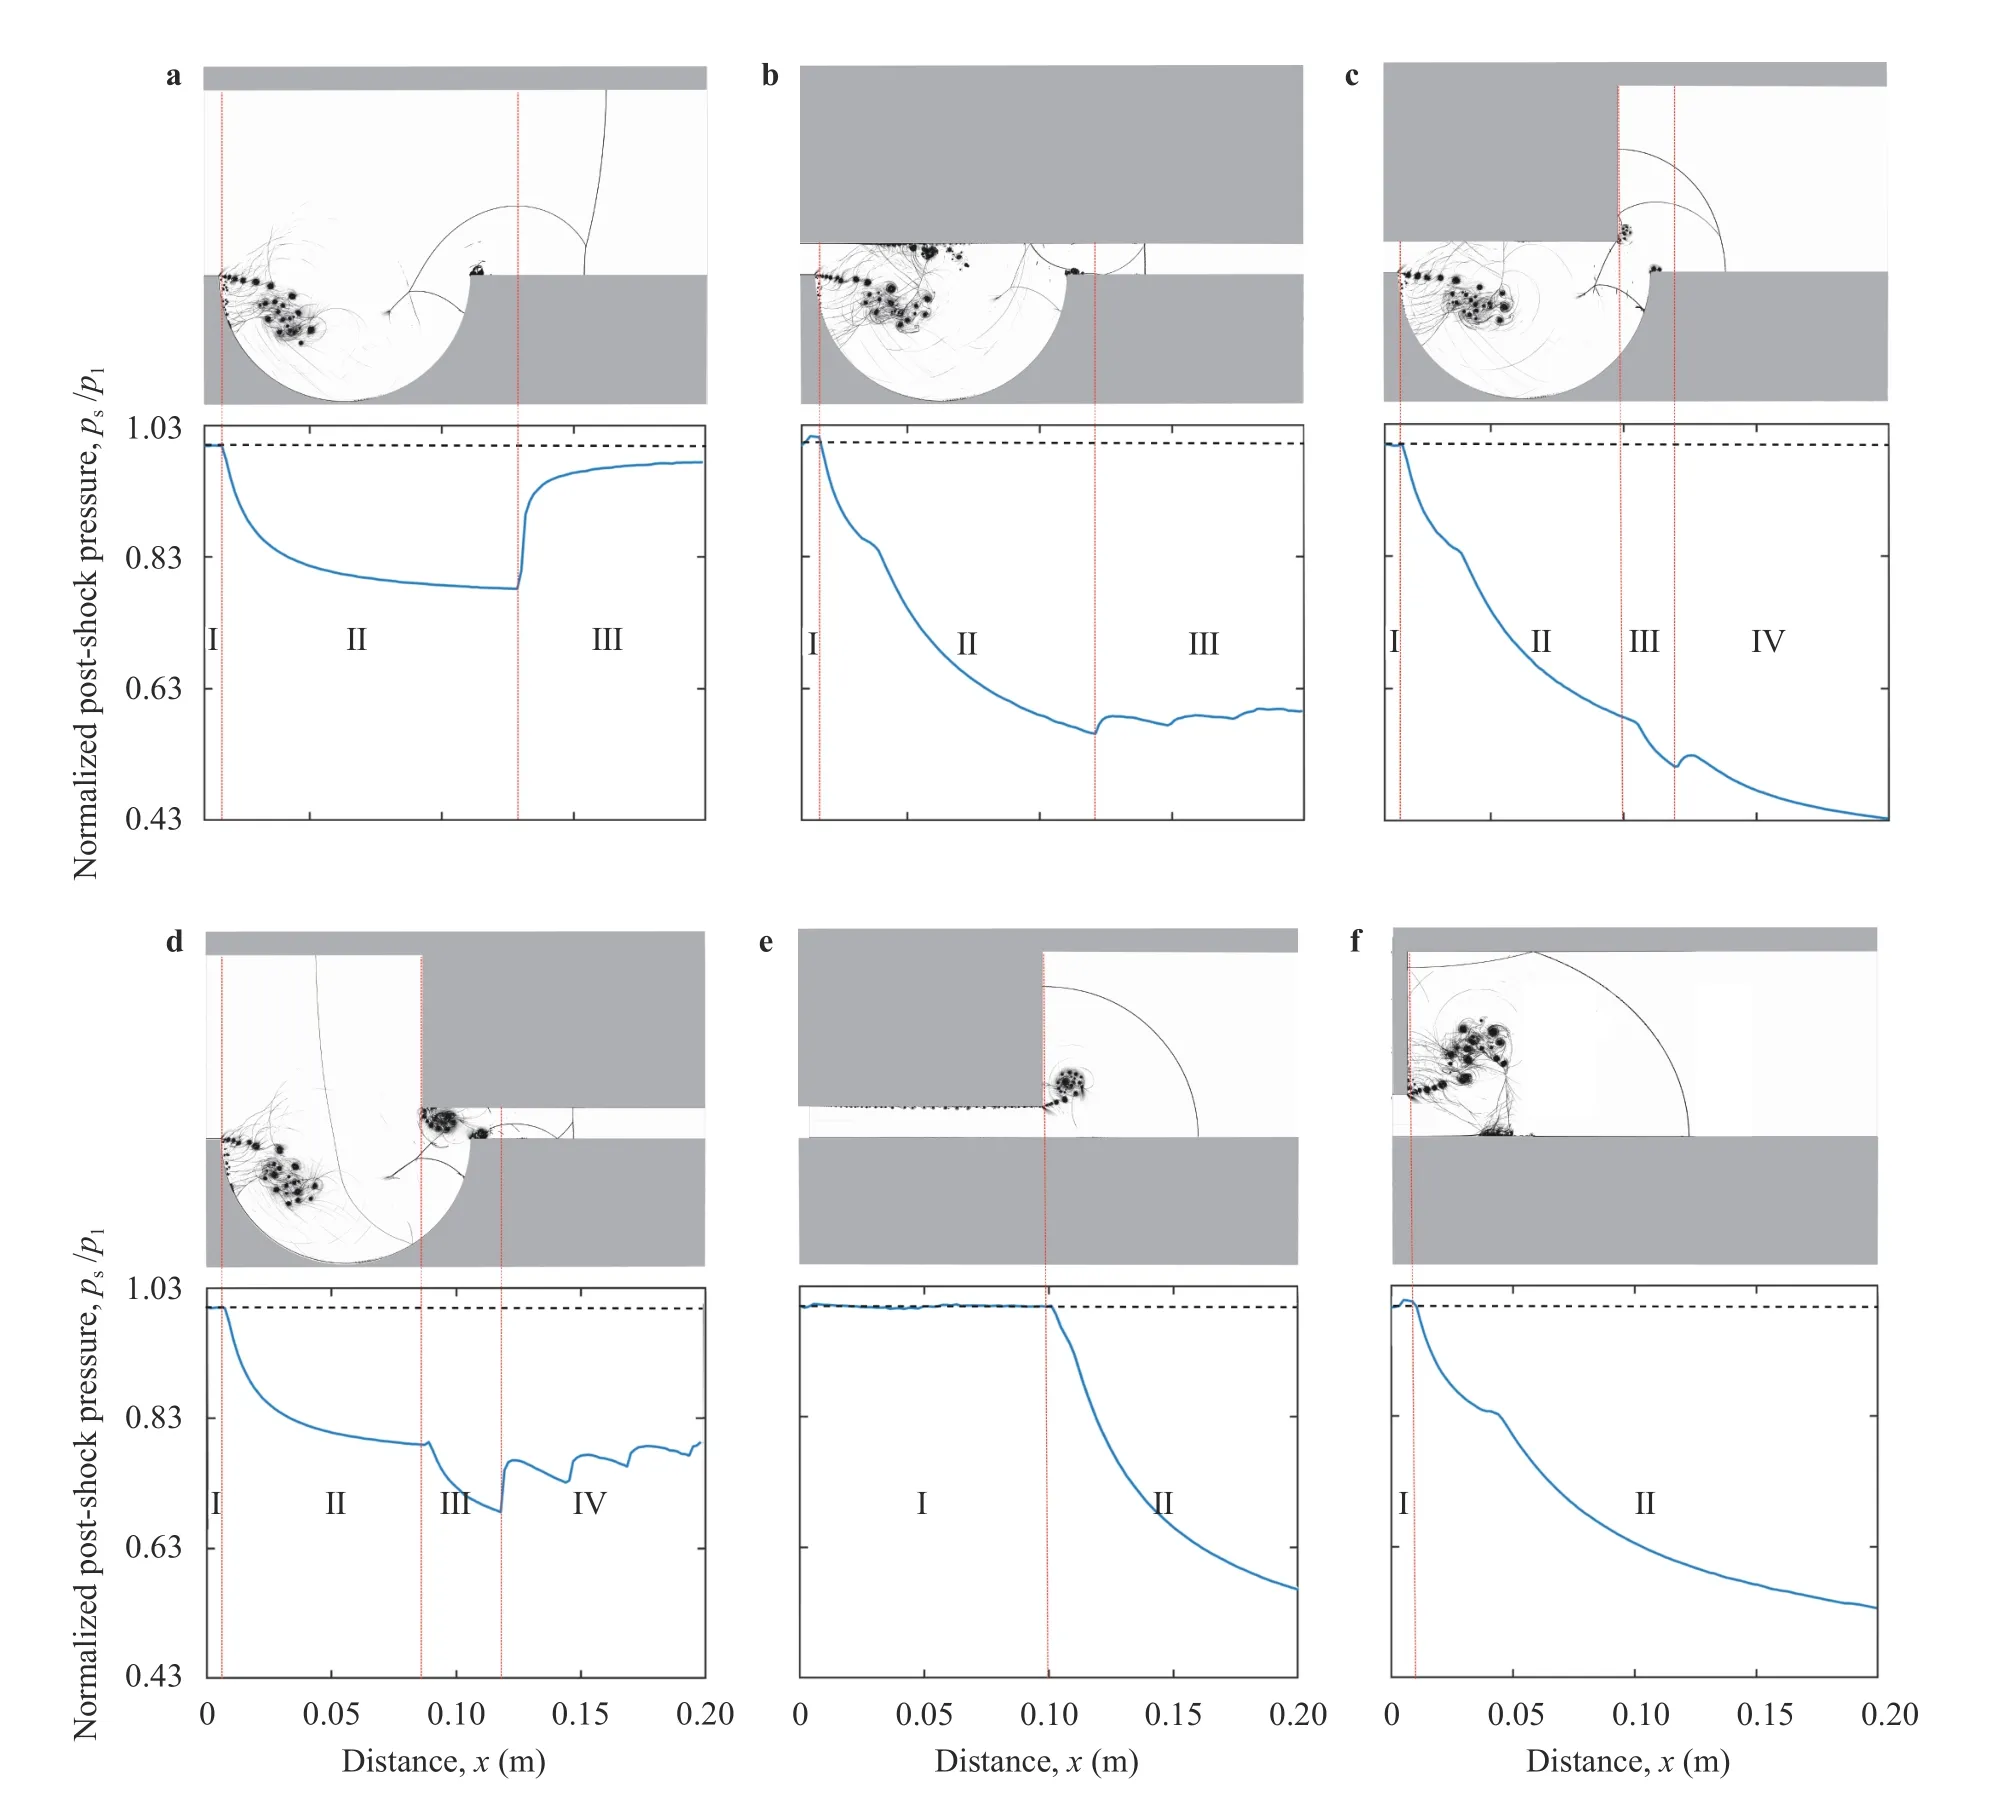
Fig. 11. Spatial distribution of the normalized shock pressure along with numerical schlieren pictures for different flow configurations at t = 288 μs. p1 is the initial pressure taken as p1 = 285.7 kPa and ps is the pressure behind the shock.

Table 1 Pressure variation d p/dt and attenuation factor A for Ms= 1.6.
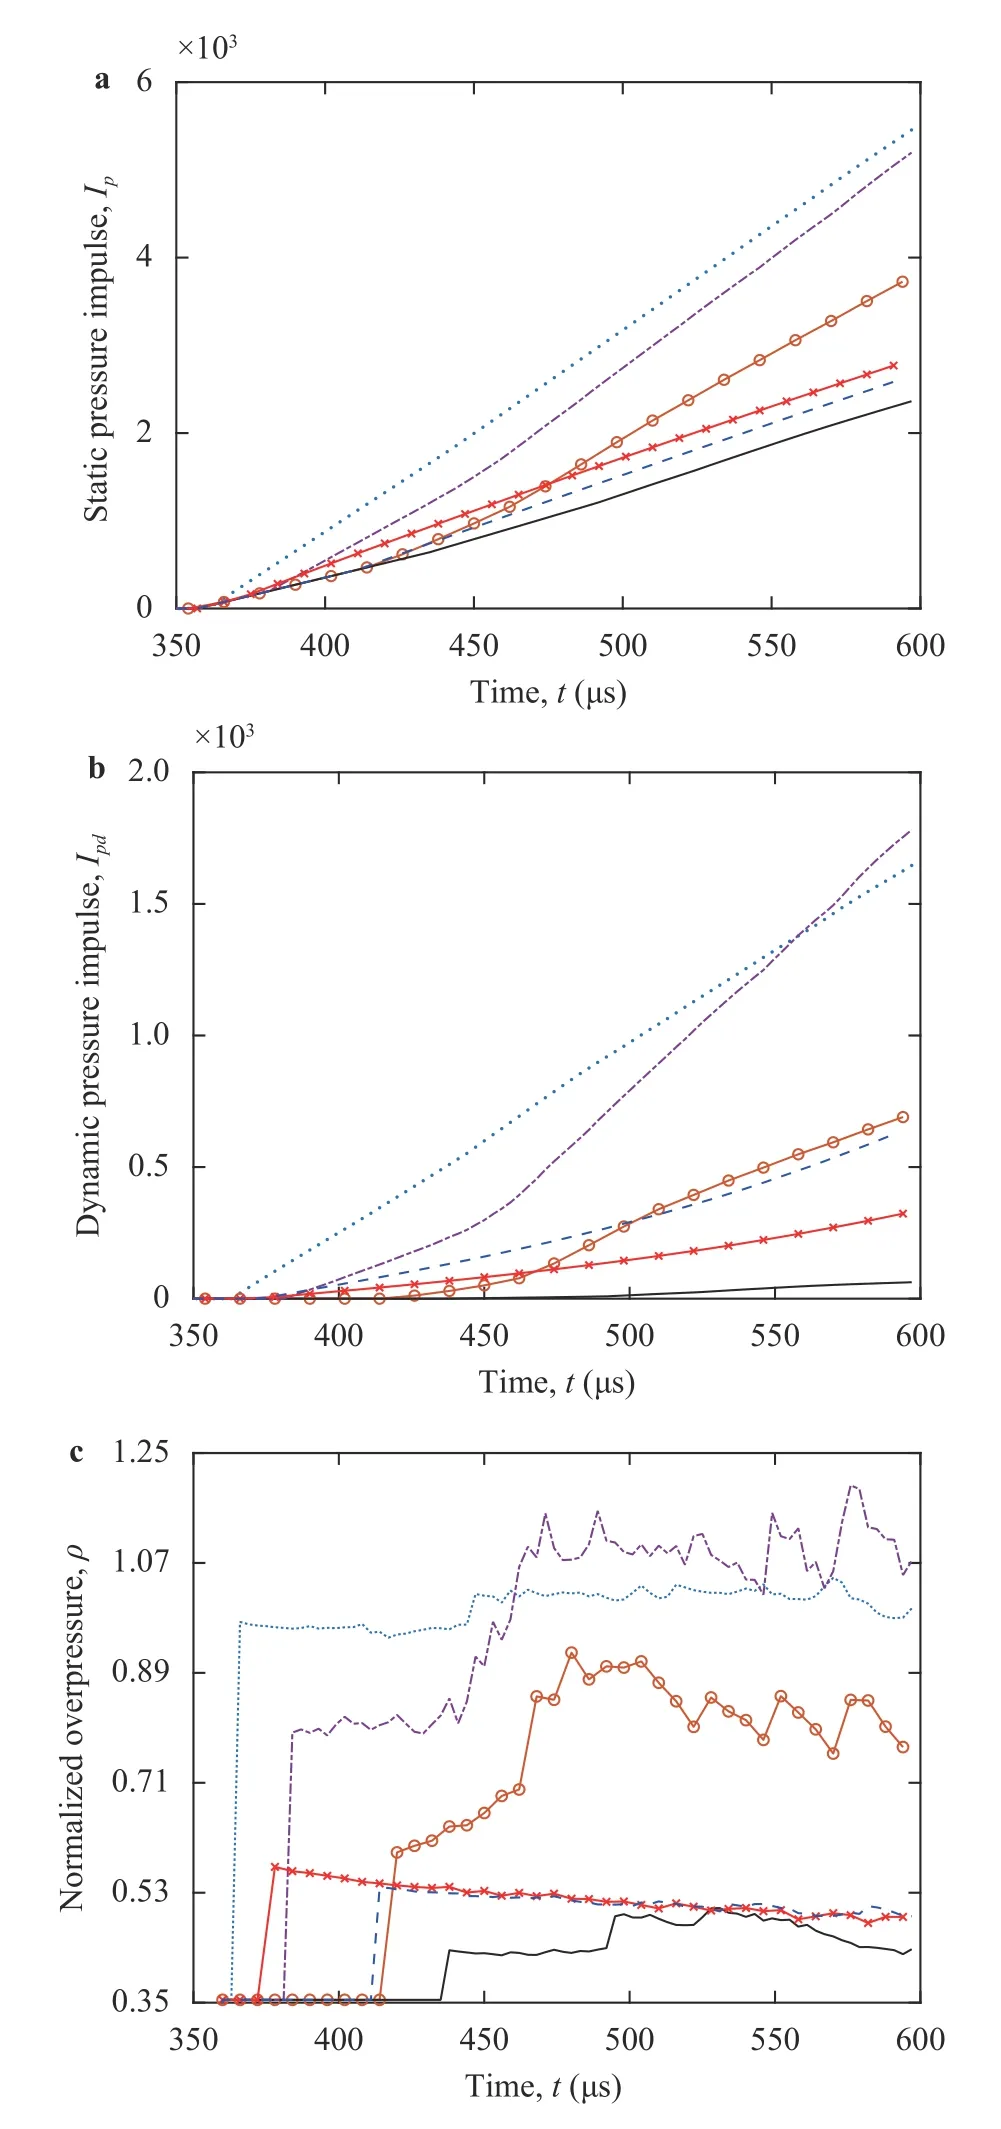
Fig. 13. Time evolution of a static impulses, b dynamic impulses,and c normalized over pressures at y /d=1.28 and x /d=4 for blue dot line: C1, red "o" line: C2, black line: C3, black dash-dot line: C4,red "×" line: C5, blue dash line: C6.
θw=90° ζ=0.25Fig. 12. Numerical schlieren pictures for and .
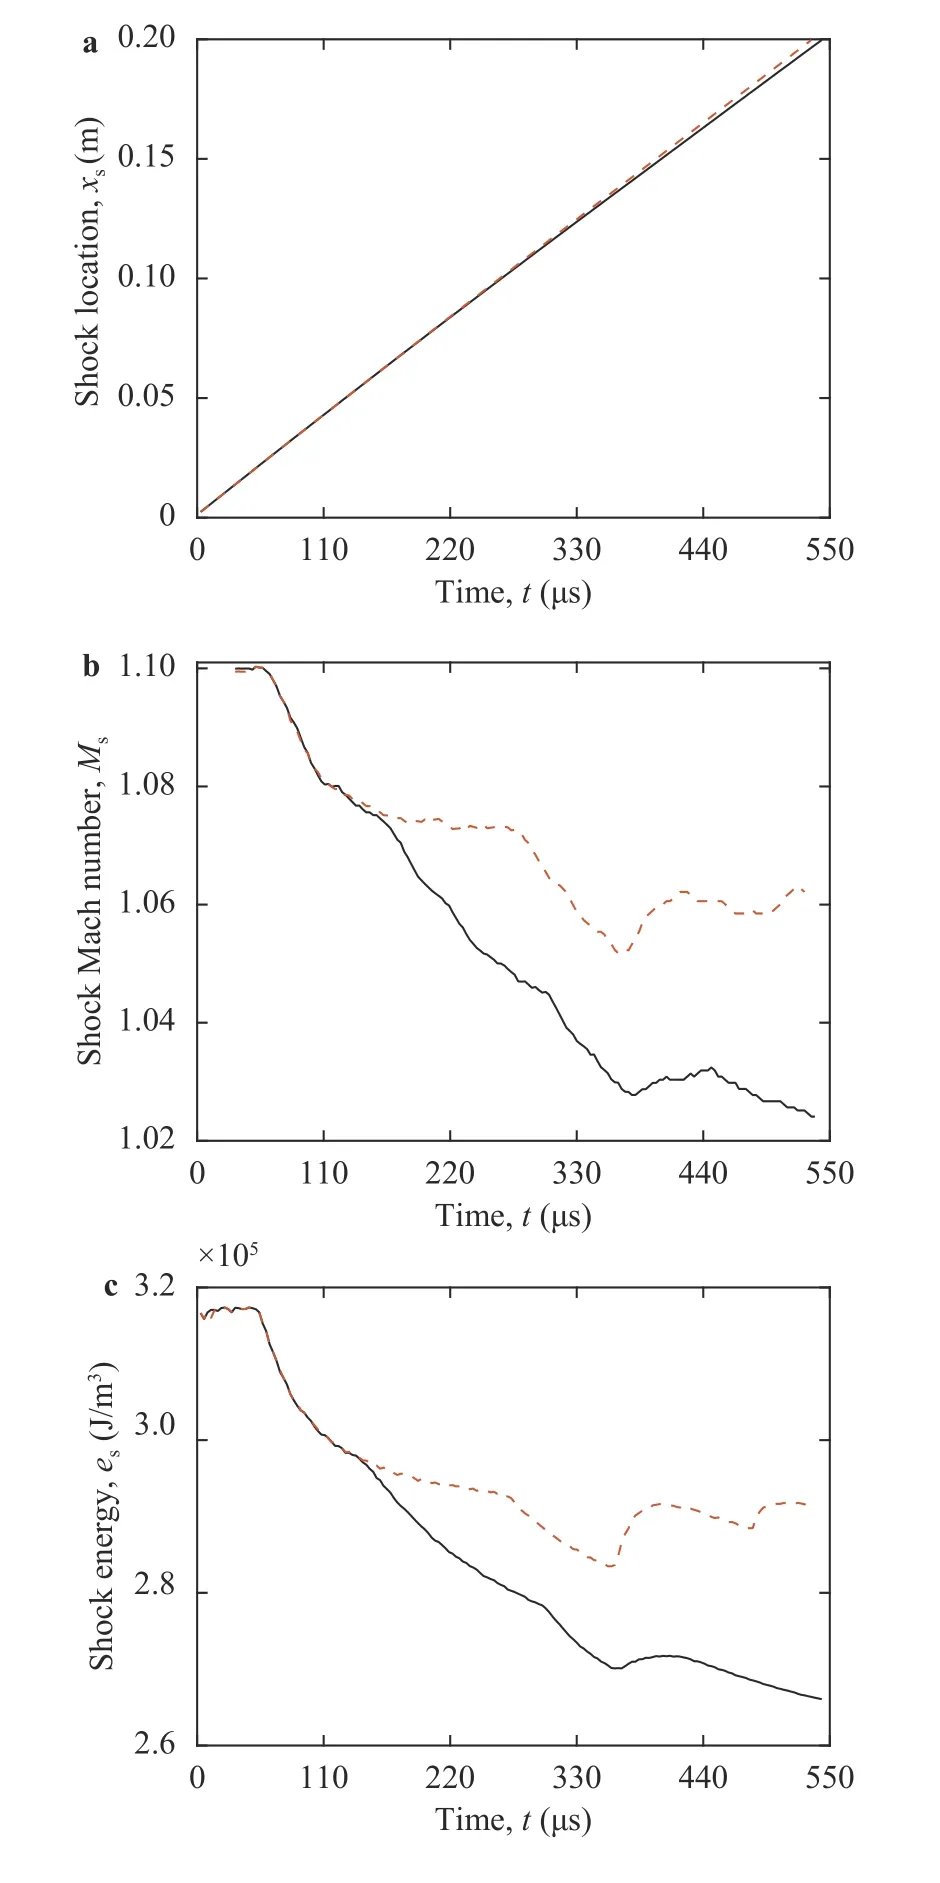
Fig. 14. Time history of a shock position, b shock Mach-number,and c shock energy for different diffraction cases. Black line: C3, red dash line: C4 for Ms = 1.1.
The effect of different configurations on shock strength is also investigated by computing the static,Ip, as well the dynamic,Ipd, pressure impulses along with the normalized over pressure,P. These three parameters are defined as,

wherep,ρandvare the pressure, density and velocity in the shocked region, respectively. The initial timet0is picked when the transmitted shock wave reaches the channel exit (x/d= 4)andtfis the final time of the simulations. The obtained pressure impulses are presented in Fig. 13(a, b). The general trends show that these quantities increase quasi-linearly after the passage of the shock. The exit of the channel is mostly comprised by a quasi-uniform gas, hence the quasi-linear behavior of static and dynamic impulses. As expected from previous results, the minimum value for both static and dynamic pressure impulses is obtained for C3. As for the normalized overpressure, Fig. 13c shows a sudden jump due to the passage of the incident shock,which remains almost constant later for C1, C5, and C6. For C2,C3, and C4, a successive peaks can be seen, these peaks are due to the reflection phenomena at the cavity exit as explained before. The intensity of the normalized overpressure attfvaries between a maximum value for C4 and a minimum value for C3.Note that, except the shock delay, no remarkable differences are seen between the normalized overpressure of C5 and C6.
Then we investigated the effect of the incident-shock Mach number by settingMs= 1.1 for C3 and C4. Figure 14a shows the space-time evolution of the shock wave. One can see that the transmitted shock reaches the end of the channel earlier for C4 and later for C3. These results are also highlighted through the variation of the shock-wave speed, presented in Fig. 14b in terms of shock-wave Mach number,Ms. For the two cases, we first notice a constant shock speed and then a decrease just after the beginning of the diffraction process. As this process evolves in time, the shock dynamics differ from one case to another depending on the channel geometry and the shock reflection phenomena at the cavity exit. Thus, in order to understand the shock behavior, some important physical parameters are discussed, such as the variation of the pressure ratio,ps/p1(psbeing the pressure behind the shock wave andp1the initial pressure in the shocked gas taken asp1= 126.15 kPa) along with schlieren pictures. The results are presented in Fig. 15. As we can see in this figure, no significant effect of reducing the shock Mach number. Among the remarkable effects, the reduction in the number of peaks for phase IV of C4. This reduction is mainly linked to the reduction of the speed of the shock wave as well as those of the reflected waves and their intensities as shown in Fig.16c and 16d. The reduction of the shock Mach number does not affect the reflection process in the upper right corner of the cavity where a direct-Mach reflection takes place as seen forMs=1.6, the reflection process is depicted in Fig. 16.
Table 2 shows the time variation of the pressure. As forMs=1.6 a pressure reduction is achieved with C3 and a pressure increase is obtained with C4. As for the attenuation factor,A, a shock mitigation is achieved with both cases. The results show that, as forMs= 1.6, a better attenuation factor is obtained for C3.
In summary, this paper reports new computational results on weak shock-waves propagation and their attenuation in channel flows with different heights. A circular section cavities with different depths and diffraction angles are added to the channel as to induce shock diffraction and to generate vortices responsible for the pressure drop behind the shock. A better shock mitigation is achieved with diffraction angleθw= 90°, where, the total shock energy is reduced by approximately 38%. A careful analysis of the flow structures reveals that in addition to the variation of the channel height, the position of these modifications play an important role in the shock mitigation. A subtle arrangement of channel position/height and cavity is found, leading to a significant attenuation factor of about 57% forMs= 1.6 and 16% forMs=1.1. In summary, the shock wave attenuation in an open channel with a cavity inside can be associated to the following mechanisms: (1) shock diffraction over the cavity that results in the formation of an end-wall corner vortex, leading to a large dissipative region responsible for the pressure decrease behind the shock, (2) appearance of an InMR due to the shock reflection which result in the formation of a TRR over the cavity, (3) appearance of a DiMR due to the shock reflection from the upper right corner of the cavity, and (4) formation of multiple transverse waves due to shock reflections from top and bottom channel walls owing to the confinement effect.
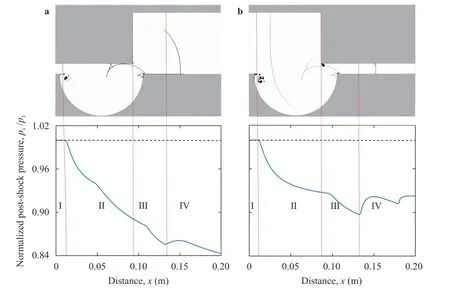
Fig. 15. Spatial distribution of the normalized shock pressure along with numerical schlieren pictures for different flow configurations at t=408 μs for M s=1.1 . p 1 is the initial pressure taken as p 1 = 126.15 kPa and p s is the pressure behind the shock.

Table 2 Pressure variation d p/dt and attenuation factor A for Ms= 1.1.
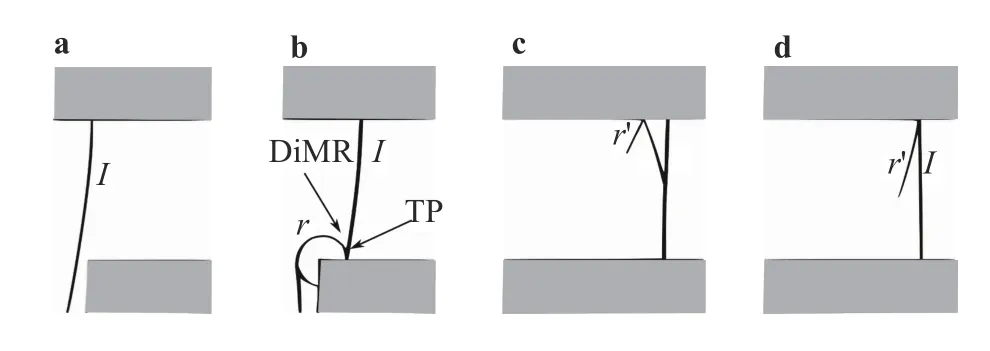
Fig. 16. Numerical schlieren pictures for θw = 90° and Ms = 1.1, for C4.
Based on the present numerical results, other forms of cavity can be proposed to further attenuate shocks in channel flows.The idea is to avoid the formation of the DiMR. This can be achieved by suppressing the rising part of the cavity.
Acknowledgement
The first author gratefully acknowledges support from the Algerian Government through a Ph.D Fellowship. Computational facilities from 'Centre Régional Informatique et d'Applications Numériques de Normandie (CRIANN), Rouen, France (Grant 1998022) are acknowledged.
杂志排行
Theoretical & Applied Mechanics Letters的其它文章
- A unidirectional SH wave transducer based on phase-controlled antiparallel thickness-shear (d15) piezoelectric strips
- A novel method for investigation of acoustic and elastic wave phenomena using numerical experiments
- A note on a family of proximal gradient methods for quasi-static incremental problems in elastoplastic analysis
- Modeling rock fragmentation by coupling Voronoi diagram and discretized virtual internal bond
- Dynamic mode decomposition and reconstruction of transient cavitating flows around a Clark-Y hydrofoil
- Numerical investigations to design a novel model based on the fifth order system of Emden-Fowler equations
