Dynamic mode decomposition and reconstruction of transient cavitating flows around a Clark-Y hydrofoil
2020-11-04RundiQiuRenfangHuangYiweiWangChenguangHuang
Rundi Qiu, Renfang Huang*, Yiwei Wang,*, Chenguang Huang
a Key Laboratory for Mechanics in Fluid Solid Coupling Systems, Institute of Mechanics, Chinese Academy of Sciences, Beijing 100190, China
b School of Future Technology, University of Chinese Academy of Sciences, Beijing 100049, China
c School of Engineering Science, University of Chinese Academy of Sciences, Beijing 100049, China
Keywords: Transient cavitating flow Dynamic mode decomposition (DMD) Reconstructed flow field
ABSTRACT The transient cavitating flow around the Clark-Y hydrofoil is numerically investigated by the dynamic mode decomposition with criterion. Based on the ranking dominant modes, frequencies of the first four modes are in good accordance with those obtained by fast Fourier transform.Furthermore, the cavitating flow field is reconstructed by the first four modes, and the dominant flow features are well captured with the reconstructed error below 12% when compared to the simulated flow field. This paper offers a reference for observing and reconstructing the flow fields,and gives a novel insight into the transient cavitating flow features.
When the local static pressure is less than the saturated vapor pressure, water would change from the liquid phase into the vaporous phase, which is termed as cavitation. Cavitation phenomenon generally occurs in the hydraulic machinery, marine propulsions together with underwater vehicles, and it presents various patterns like incipient cavitation, sheet/cloud cavitation,supercavitation by decreasing the cavitation number. The unsteady cavitating vortices shedding and the corresponding collapse would cause many problems, such as pressure fluctuations, vibrations, noise, erosion and even breakdown in the performance, which is a cutting-edge topic in the high-speed hydrodynamics area [1, 2].
Due to the cavitation significance in the hydraulic applications and marine applications, many efforts have been devoted to investigating the fundamental physics from the perspective of the Eulerian and Lagrangian viewpoints, proper orthogonal decomposition (POD) and dynamic mode decomposition (DMD),etc.
Both POD and DMD are data-driven modal analysis methods, which can capture the dominant characteristics of different flow modes and establish a dynamic reduced-order model to reconstruct the unsteady flows. POD is firstly applied to display the coherent structures of turbulent flows by Lumley et al. [3, 4].DMD is used to analyze the jet in crossflows, illustrating that the different spatial structures are associated with the shear layer and the near-wall region [5]. The physical mechanisms underlying fluid flows are studied by using DMD and found that different flow modes correspond to different flow structures, implying unique flow features and instability mechanisms [6]. Grilli et al.[7] investigate the unsteady behaviors in shockwave turbulent boundary layer interaction and analyze the flow dynamics by DMD. The result shows the presence of a low-frequency mode is associated with the separation bubble and shock. Liu et al. [8] investigate the coherent structure of cavitating flows around ALE15 hydrofoil by using both DMD and POD, demonstrating that the DMD is more favorable than POD to decompose the complex flows into uncoupled coherent structures.
Besides, lots of investigations have been made to improve the DMD capability for complex flows. Chen et al. [9] put forward an improved DMD method and test this method to a cylinder fluid flow at low Reynolds number. Sparsity-promoting dynamics mode decomposition is proposed by Jovanović et al. [10] for achieving a tradeoff between the number of modes and the calculation efficiency, and it performs well in Poiseuille flow,screeching supersonic jet and jet between two cylinders. DMD with criterion (DMDc) is introduced by Kou and Zhang [11] by using an improved criterion to arrange the flow modes, and performs accurately in airfoil flutter.
Although the cavitation phenomenon has been extensively studied, a brief review of these recent works indicates that the dynamic mode decomposition is a novel spatio-temporal coupling dynamic modeling method and there are inadequate applications in the unsteady cavitating flows. The objective of this work is to analyze the unsteady cavitating flows around the Clark-Y hydrofoil by DMDc. The relative errors between fast Fourier transform (FFT) and DMDc are calculated to show the accuracy of frequency information obtained by DMDc. The contours and vector diagrams of dynamic modes are presented to capture flow feature corresponding to different frequencies. Dominant modes are applied to reconstruct low-order flow field, and the simulated flow field is compared with the reconstructed flow field to investigate the source of reconstructed error.
DMD requires discrete data from simulations or experiments to construct a snapshot matrix. The snapshots should be rearranged as the columns of matrices X and Y such that

where xjrepresents the data at time instant t. Matrices X and Y both have m rows and n-1 columns. If we set the discrete time interval between each column of X as Δt, then Xjrepresents the data at time instant j×Δt. Applying the Koopman operator, the linear relationship between two snapshots is defined as

Matrix A is the dynamics matrix and is given by A =YX†,where X†is the pseudoinverse of X. By performing singular value decomposition and reducing the rank of A, DMD is performed,for details see Refs. [12, 13]. The i-th eigenvalue and eigenvector of A are μiand wi, respectively, and viis the i-th mode corresponding to μi. In this way, the dominant modes and their frequencies can be found and used to evaluate the flow mode and whether it is stable. Because each mode is related to only one eigenvalue, the present approach is useful to illustrate the coherent structures in a flow field and offers better correlation between spatial and temporal information.
Not all modes are equally important, meaning that we can exclude insignificant ones and retain only the dominant modes for flow-field reconstruction. However, there is as yet no clear consensus regarding a suitable criterion for selecting the dominant modes. From the many available criteria, herein we use DMDc to rank the modes [11]. DMDc considers the temporal evolution of each DMD mode by integrating time information. Because this method avoids having to use the matrix about dynamic matrix A, DMDc is computationally inexpensive. In Eq. (3),αirepresents which mode is important compared with the first snapshot. However, this parameter cannot reflect the temporal effect in the selection of modes. Therefore, we define a parameter to appraise the spatiotemporal relationship, namely

where μiis the i-th eigenvalue of A, andαiis the energy amplitude of mode i.
This criterion is used to extract the dominant DMD modes according to the order of the parameter Ii. Equation (3) can be expressed in discrete form as

After Eq. (4) is applied, the mode can be arranged by the amount of parameter I. If there exists a parameter, Ii, which is larger than any other I, the mode corresponding to Iican be considered as a dominant mode. The dominant modes can also be applied to reconstruct the flow data in a few periods. Before reconstructing the flow field, we should determine the amplitude of each ordered mode in the flow field. Calculating the amplitudes is equivalent to solving the following optimization problem

where Φ = [v1, v2, …, vr], Dαdenotes the diagonal matrix of vector α = [α1, α2, …, αr], where the subscript r denotes the rank of matrix A. Here, Vandis the Vandermonde matrix. The reconstructed flow field xjat time t is given by

where the superscript j represents the non-dimensional time.
In this letter, we perform DMDc to the data from a transient cavitation flow over a Clark-Y hydrofoil. After the modes are obtained by DMDc, the relative errors between dynamic mode decomposition and fast Fourier transform are calculated to prove that DMDc can identify dominant frequencies. Modes related to main frequencies can be used to reconstruct unsteady flow field exactly. Some of the settings about simulation are given below.The chord length of the hydrofoil is 0.07 m and its angle of attack is fixed at 8°. The inlet speed is set to 10 m/s, the Reynolds number is 7×10⁵, and the outlet pressure is used at the outlet plane with the corresponding cavitation number of 0.8. Based on the homogeneous hypothesis, the vapor/liquid mixtures are treated as continuous fluids that share the same pressure and velocity fields. The modified partially averaged Navier-Stokes(PANS) model is used in the simulation [14]. The cavitation is described using the Zwart cavitation model, which is based on the simplified Rayleigh-Plesset equation. The flow-field distribution and cavitation of the hydrofoil are calculated for the above conditions, and the results are sufficiently accurate for simulating unsteady flows. See Ref. [15] for detailed parameter settings,model usage and calculation set-up.
Based on the numerical simulation results, the transient flow fields at the middle span are used to decompose the velocity profile and then analyze the reconstructed results. 241 snapshots are selected for data decomposition, i.e. seven cavity-shedding cycles. In this flow, the velocity field fluctuates mainly in thexdirection, meaning that the data for thexcomponent of the velocity are more stable and robust for decomposition. Figure 1 shows the distribution of the eigenvalues of all modes on the complex plane. Note that the eigenvalues of the dynamics matrix A are conjugated, that is why the modes appear in pairs. Because of this property, the first seven eigenvectors are constructed as the first four modes; in other words, two conjugated eigenvectors correspond to the same eigenvalue. The blue dashed line in Fig. 1 is the unit circle that represents the stability of the eigenvalues. The black points inside the unit circle represent stable eigenvectors. If an eigenvector is outside the circle, this eigenvector may be unstable, which cannot happen in a periodic flow. Most of the points are located inside the unit circle, which shows that the cavitation flow under these flow conditions is quasi-periodic.
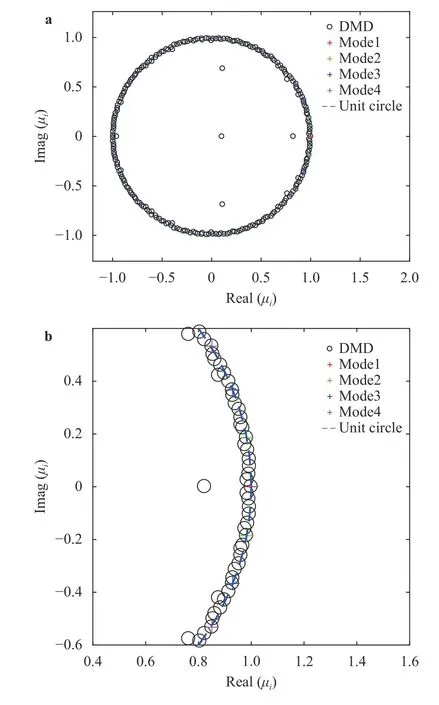
Fig. 1. Eigenvalue distribution on complex plane: a all eigenvalues and b magnified view.
Figure 2 shows the frequency-amplitude relationship for each eigenvector. The amplitude calculation is based on the aforementioned parameterα. Because the eigenvectors calculated earlier are normalized, the amplitude is represented by the absolute magnitude ofα. The colored points marked in Figs. 1 and 2 show the key eigenvectors chosen by DMDc. In the present work, four typical dynamic modes are chosen to characterize the coherent structures. These modes are selected and arranged according to DMDc. The black points provide the amplitude of each mode, and the colored points indicate the typical dynamic modes. The distribution of colored points shows that the amplitude cannot characterize the main frequency because whether a mode is a typical mode is not determined by its amplitude. Figure 2 shows that a mode can be a dominant mode even if its amplitude is relatively small. The modes that we seek are those that influence the flow field on the whole snapshots.Large amplitude and decay rate close to zero are two mainly requirements to choose dominant mode. Each mode corresponds to a value of the aforementioned parameterIi: the modes are arranged in sequence according to the order ofIifrom large to small, and the first four modes are considered as four dominant modes.
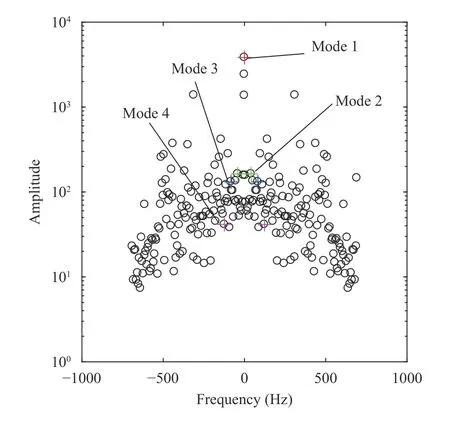
Fig. 2. Amplitude-frequency relationship for all eigenvectors. Different points visualize the selected dominant eigenvectors. Red =Mode 1, green = Mode 2, blue = Mode 3, purple = Mode 4.
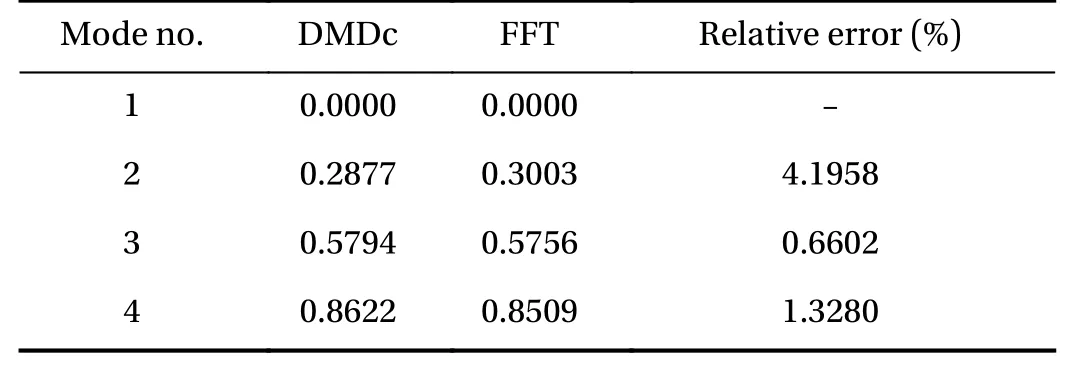
Table 1 Comparison of main Strouhal numbers (Sts) from DMDc and FFT.
Table 1 compares the frequencies obtained by FFT and DMDc, where the percentage accuracy is defined as 100|StDMDc-StFFT|/|StFFT|. The sampling point of FFT is in the observation section mentioned before, and sampling point is above the upper surface of the hydrofoil. The proposed method detects the first four modes accurately. In Table 1, the Strouhal number is defined as

whereu∞is the inlet speed,Lcis the chord length, andfiandStiare thei-th frequency and Strouhal number, respectively.
Figure 3 shows the contours and vectors of the first four modes. The first mode is usually the mean mode, which represents the background flow. The higher-order modes can be considered as disturbance flow fields. The real parts of the higherorder modes decompose the vortex shedding, which demonstrates that high-frequency shedding often generates relatively small flow structures. DMD has the advantage that it can show the relationship between the flow structure and the corresponding frequency.
To evaluate the reconstruction efficiency of the extracted modes, the overall residuals compared with the snapshot sequences are scaled by the loss function defined as

Here,lossmeans the error of the reconstructed flow field compared to the simulated flow field. The loss function changes with the number of selected modes. To clarify that relationship,Fig. 4 shows the convergence of the loss function for the first 150 eigenvectors. This shows that the first mode contains most of the information about the flow field, having an error of 12%compared with the data sequences. The first seven eigenvalues,including the conjugated modes, restore over 90% of the information about the flow field. However, as the number of modes increases, the accuracy of the reconstructed flow field does not improve significantly. Considering the efficiency and accuracy of the reconstruction, it is appropriate to use 9-15 eigenvectors to reconstruct this example. The efficiency does not rise after 15 eigenvalues because of the limitations of the DMD method. Cavitation is a complex physical phenomenon that involves the interaction of multiple physical phenomena,including turbulence, phase transition, and free-surface effects.Therefore, the nonlinear characteristics of cavitation cannot be ignored, even if cavitation is a quasi-periodic process. Nonlinear information is decomposed into high-order linear modes, but Fig. 4 confirms that DMD can extract the linear part of the cavitating flow in an efficient way.
In this study, the first four modes are used to reconstruct the flow field. The dominant modes are reconstructed using Eq. (6).To assess the accuracy with the existing data, every 24 steps are selected as the reconstruction time steps. To simplify,Trepresents a total of 241 steps in Figs. 5 and 6. The reconstructed errors in each time step are shown in Fig. 5. Note that the equation used in Fig. 5 is not the same as Eq. (8). In Fig. 5, the loss function is calculated in the specific snapshot, rather than all the snapshots in Eq. (8). The reconstructed errors fluctuate between 6% and 12%.
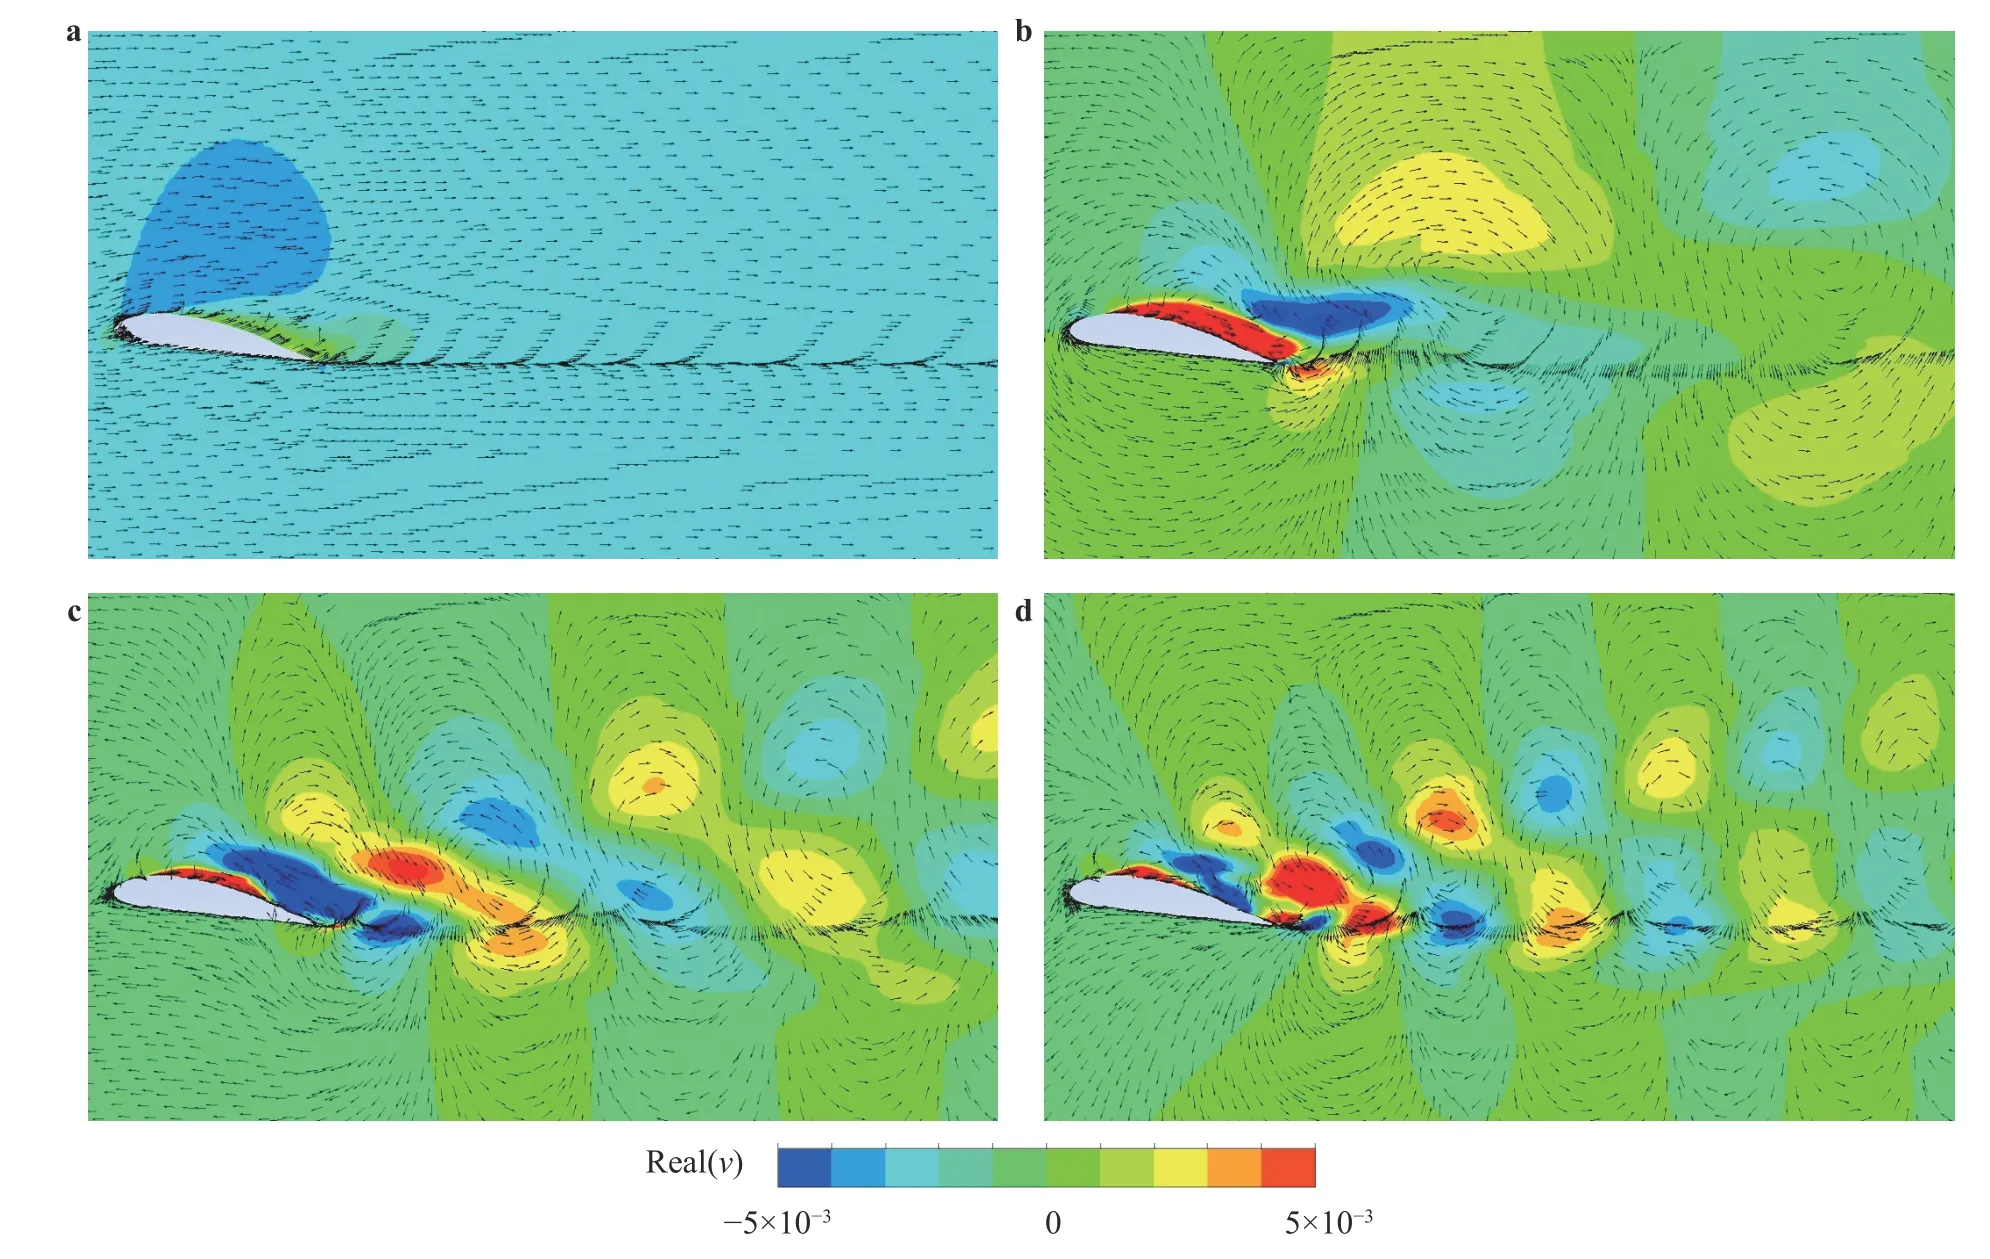
Fig. 3. Dynamic modes on surface: a Mode 1; b Mode 2; c Mode 3; d Mode 4.
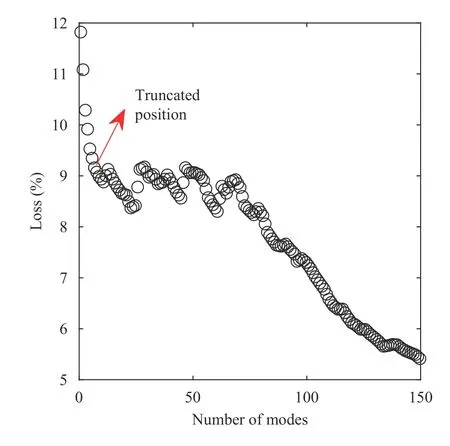
Fig. 4. Loss function corresponding to selected number of modes.The red arrow indicates the seven eigenvectors selected in this study.
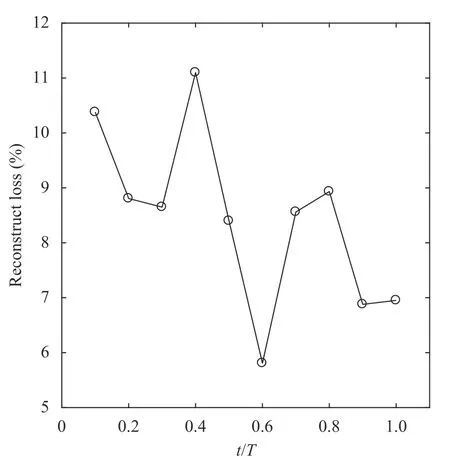
Fig. 5. Reconstructed errors in 10 reconstruction time steps.
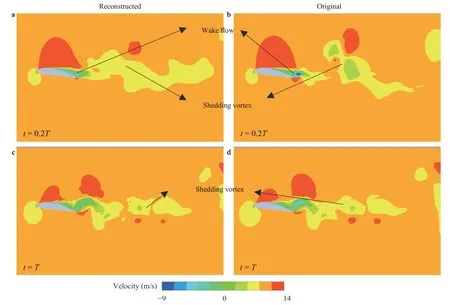
Fig. 6. Reconstructed velocity field and originally simulated velocity field in x direction. The reconstructed fields at a t=0.2T and c t=T compared to the originally simulated velocity field at b t=0.2T and d t=T.
Figure 6 shows the reconstructed flow field compared with the real flow field. Figure 6(a, c) is reconstructed fields from the first four modes, whereas Fig. 6(b, d) is the simulated flow fields.Comparing the reconstructed field with the simulated field, the differences between them are pointed out with black arrows.The reduced-order flow field captures the background flow-field structure, but some flow details are hidden in the higher-order modes, which is the main source of reconstruction errors. Figure 6 shows that the backflow region and turbulent region are not expressed clearly upon comparing the simulated and reconstructed flow fields, which is related to the characteristics of multiphase flow. The change in density is not considered in this study, whereas the cavitation equations include this term. For the reconstructed flow field, the decrease in the velocity field at the vortex cores is not very clear. Given the decreasing errors from 0.2T to T, the contours at T are smaller than those at 0.2T.
This letter reports the use of DMDc for a cavitating flow. The snapshot sequence is obtained from numerical simulations using the PANS method and the Zwart cavitation model. We extract the dominant fluctuation frequencies in a cavitating flow field with the cavitation number of 0.8. The FFT results confirm that the DMD-extracted temporal information is acceptably accurate. The first four modes restore over 90% of the information about the flow field. The reconstructed flow field has a relative residual in the range of 6%-12%, and the flow field describes the major features of the wake and vortex shedding of the simulated flow field. However, the gradient of the velocity field in the wake is not displayed well by the reconstructed flow, and improving the mode-selection criterion may result in better-reconstructed wake and vortices. A selection criterion based on machine learning is a possible direction to explore.
Acknowledgement
This project was supported by the National Key R&D Program of China (Grants 2016YFC0300800 and 2016YFC0300802).The authors would like to gratefully acknowledge the National Natural Science Foundation of China (Grants 11772340 and 11672315) and the Science and Technology on Water Jet Propulsion Laboratory (Grant 6142223190101).
杂志排行
Theoretical & Applied Mechanics Letters的其它文章
- A unidirectional SH wave transducer based on phase-controlled antiparallel thickness-shear (d15) piezoelectric strips
- A novel method for investigation of acoustic and elastic wave phenomena using numerical experiments
- A note on a family of proximal gradient methods for quasi-static incremental problems in elastoplastic analysis
- Modeling rock fragmentation by coupling Voronoi diagram and discretized virtual internal bond
- Numerical investigations to design a novel model based on the fifth order system of Emden-Fowler equations
- Ultrasound calibration with ladder phantom at multiple depths for breast biopsy navigation system
