Revealing the high-frequency attenuation mechanism of polyurea-matrix composites
2020-05-06ChengLiuLuoLiLiKangZhuang
J. Cheng · Z. L. Liu · C. C. Luo · T. Li · Z. J. Li · Y. Kang · Z. Zhuang
Abstract In this paper, a method for analyzing the high-frequency attenuation property of polyurea-matrix composites is developed by combining experimental, computational and theoretical approaches. First, the ultrasonic experimental platform is established by solving the difficulties of high-frequency ultrasonic testing as high-frequency signal distortion, insufficient driving voltage and sampling rate failure, to study the dynamic mechanical properties (1-5 MHz) of pure polyurea and polyurea-matrix composites. Then, the influences of composite parameters including the size and volume fraction of inclusions on wave attenuation performance under different frequencies are obtained and further verified by numerical simulations. Next, the contribution of inclusions to the wave attenuation performance is also theoretically analyzed. It is found that the increase of inclusion volume fraction and inclusion diameter will increase the attenuation coefficient of the composites. And the attenuation of composites with the inclusions of a 150-μm diameter and 30% as volume fraction can be 82% higher than pure matrix. This amplifying attenuation effect of inclusions is mainly attributed to the scattering effect, which is verified by comparing numerical and theoretical results.
Keywords Polyurea · Viscoelastic · Dynamic mechanical properties · Ultrasound
1 Introduction
Polyurea is a kind of block polymer formed from the isocyanate-terminated prepolymer and amino compound, with the polycondensation reaction, which was originally developed by Texaco Chemical Company in 1989 [1]. It is a sort of material which is easily manufactured and processed, as well as environmentally friendly. Thus, it is very popular in the areas such as underwater protection and motorsport [2]. In addition to these applications, the more advantageous use of polyurea is in the protection of high-frequency waves [3]. Many researchers have experimentally and computationally verified the good attenuation characteristics of polyurea for high-frequency waves [4].
In order to enhance its protection performance of highfrequency waves, the inclusions are generally added into polyurea, and many researchers have conducted the relevant studies [5]. Previous researchers tried to add fly ash particles to polyurea [6], which could increase the attenuation coefficient of polyurea by 50% at a frequency of 1 MHz [7]. However, the size of fly ash is not easy to control, and the structure is also relatively complicated, which is not convenient for the theoretical mechanism studies. Among the remaining materials, glass microspheres are common inclusions. However, the related comprehensive systematic studies of their experiments have not been conducted. In addition, glass microspheres are easy to obtain and produce, and enable easier fine production [8]. Consequently, they are more helpful to reveal the attenuation mechanism of the composites. The theory of phononic crystal has been well studied [9], but not applicable to three-dimensional composites with random inclusions, which is commonly used in protective equipment.
The use of ultrasonic methods for measuring the wave attenuation properties of viscoelastic matrix composites such as polyurea can be traced back to the early twentieth century [10]. The researchers pointed out that the ultrasonic methods can be used to measure the attenuation of waves, thereby deriving the storage and loss modulus of materials [11]. In recent years, researchers have done a lot of work on ultrasound equipment and technology [12, 13]. With technology advancement, more researchers have begun to use ultrasound methods [14] and further improve the theoretical work [15]. There are many forms of ultrasonic experiment methods, that mainly focus on low frequency [16], but there always are difficulties in high-frequency testing (1-5 MHz), such as insufficient driving voltage and severe signal distortion. [17].
In terms of simulation, the finite element method (FEM) is also often used to analyze the propagation and attenuation of waves in composites, which has advantages in the analysis of material models and geometric configurations [18]. For polyurea-matrix composites, many researchers have also done relevant works [19], and the constitutive model of viscoelastic solids is well studied at the microscopic level [20]. When substituting the polyurea constitutive, they used dynamic the rmomechanical analysis (DMA) data to obtain constitutive parameters by time-temperature superposition. However, due to the extra attenuation properties of polyurea at high frequencies [21], many constitutive parameters fitted by DMA data, cannot achieve as good consistency in the simulation as that in the experiment [2]. Moreover, FEM simulation cannot decouple the attenuation caused by scattering, viscosity, vibration, etc. [22]; that is, it cannot analyze various attenuation mechanisms and study the attenuation mechanism of composites.
In this paper, an ultrasonic experimental device has been developed using the technical means to solve three problems of high-frequency signal testing: high-frequency signal distortion, insufficient driving voltage, and sampling rate failure. The attenuation coefficients of polyurea and polyurea-matrix composite at high frequency are obtained by ultrasonic experiments. The relationship between attenuation coefficient and frequency, as well as composite parameters, are studied. The simulation and theory results are verified and extended. The attenuation mechanism of polyureamatrix composites on ultrasonic waves is explored. Our innovative contributions are as follows: (1) establishing an experimental device and conducting high-frequency ultrasonic experiments to explore the attenuation properties of polyurea-matrix composites, (2) establishing the FEM for simulation of ultrasonic experiments and achieving good agreement with experimental results, and (3) analyzing with a theoretical model the contribution of inclusions to wave attenuation.
2 Experimental instruments and results
2.1 Experimental samples and device
The pure polyurea sample was synthesized by the reaction between the isocyanate-terminated prepolymer (Isonate 143L) and the amino compound (Versalink P1000) by bulk polymerization with a reaction ratio of 1.05:1. Mixing and stirring were carried out under vacuum. Because of the high viscosity of the amino compound component, the stirring bottle was placed in a 60 °C oil bath beaker for a thorough stirring, with a duration of 3 h. The resulting mixture was poured into a polytetrafluoroethylene sample mold, cooled to 25 °C in a temperature chamber, and cured at 80 °C for 48 h. The sample has a flat cylindrical shape with a diameter of 30 mm and a thickness of 6 mm or 4 mm.
The glass microspheres have average diameters of 50 μm and 100 μm, a density of 2470 kg/m3, a Young’s modulus of 64.89 GPa and a Poisson’s ratio of 0.306. The composite containing glass spherical inclusions is prepared in a similar process to the above. The inclusions are added to the amino compound component and thoroughly stirred before mixing, then to the mixed amino compound with glass microspheres and the isocyanate-terminated prepolymer to ensure that the inclusions are well mixed in the matrix. Five kinds of material samples are prepared, namely (1) pure polyurea; (2) and (3) polyurea composites with inclusion diameter of 50 μm and volume fractions of 10% or 20%, respectively; (4) and (5) polyurea composites with inclusion diameter of 100 μm and volume fractions of 10% or 20%, respectively. A photograph of the obtained samples and electron micrographs are shown in Fig. 1. It can be seen that the inclusion distribution is random and uniform. There are no large clusters and large-area debonding occurring at the interface between the inclusion and matrix.
An ultrasonic experimental platform has been built based on the piezoelectric effect and inverse piezoelectric effect for signal transduction and multi-waveform input satisfying a 1-5 MHz frequency. The experimental device is assembled from a series of components including a waveform generator (Rigol DG5102), power amplifier (Wattsine WSPA-500), ultrasonic transducer (Jiangsu Daobo) and oscilloscope (Rigol DS4034). In the experiment, the waveform generator generates a simple harmonic electrical signal with a specific frequency and amplitude. After being amplified by the power amplifier, it is converted into an ultrasonic signal by the ultrasonic transducer, and then transmitted to the other end of the ultrasonic transducer after the sample is propagated. The signal is converted into an electrical signal and finally passed to the oscilloscope. In order to avoid the signal loss caused by the impedance mismatch between the ultrasonic transducer and sample, and the signal delay in the device and the line, in the experiment, two identical samples, except for the thickness, are simultaneously tested, and the influence of sample thickness on the attenuation of the wave is separated. In the oscilloscope, the signal input from the waveform generator is compared with the last accepted signal to obtain the propagation properties of the ultrasonic signal in the sample. The block diagram of the test and the schematic view of the experimental device is illustrated in Fig. 2.
Three improvements were made to solve the problems faced by high-frequency signal testing (1-5 MHz). For the first problem of high-frequency signal distortion, the integrated circuit oscillator and the frequency-locked amplification module in the signal source eventually make the in-band ripple ≤ 0.3 dB and the second harmonic wave suppression ≥ 30 dB (1-5 MHz). For the second problem of insufficient driving voltage, by using the pre-power amplifier, the small-attenuation-ratio passive probe and the impedance regulator (50 O) achieve a voltage output close to 5 V (after passing through a 5-MHz probe). For the third problem of sampling rate failure, by using an oscilloscope for improvement, two-channel common sampling is thereby achieved (internal parallel), and the current sampling frequency can reach 2 Gsa/s, which can meet the sampling requirements of high-frequency signals.
2.2 Experimental methods
Ultrasound transducers with various center frequencies were used in the experiments, including 1 MHz to 5 MHz (2 pairs each) to generate and receive ultrasound signals. The ultrasonic transducer diameter is 15 mm. In order to ensure sufficient transmission of the ultrasonic signal at the interface, coupling agents were added between the transducer and sample. The frequency to be tested is 1-5 MHz. During each experiment, the waveform generator generates five consecutive sinusoidal longitudinal waveforms and ensures that the sample thickness is greater than two wavelengths. The process was repeated five times for each test to ensure repeatability. In each of the actual tests, two samples with thicknesses of 4 mm and 6 mm were used, as shown in Fig. 3. For the same incident signal, two accepted signals were obtained for two thickness samples, and two signals were compared for obtaining the conductivity of the signal in the sample. The wave speed and attenuation coefficient could be obtained directly.
The attenuation coefficient of unit thickness can be obtained by the following formula:

where A0is the amplitude of the output signal through a 4-mm sample, and A is the amplitude of the output signal through a 6-mm sample, both of which are the average values of five consecutive waveforms to ensure the accuracy of the data. Δd = 2 mm is the thickness difference between two samples.
2.3 Results and discussions
The attenuation coefficients for different samples are different, and the attenuation coefficient is also a function of frequency. As the frequency increases, the attenuation coefficient increases in an approximately linear relationship, which is similar to the results of other research on viscoelastic materials [23]. Among different samples, as the volume fraction of inclusions increases, the attenuation coefficient increases correspondingly, which indicates that the addition ratio of glass microspheres can improve the attenuation performance. This is similar to the conclusions of some researchers [7]. Although the addition of inclusions reduces the volume fraction of polyurea as a viscoelastic matrix, it introduces the attenuation of energy by scattering and ultimately leads to an increase in the attenuation coefficient, as can be found in Fig. 4.
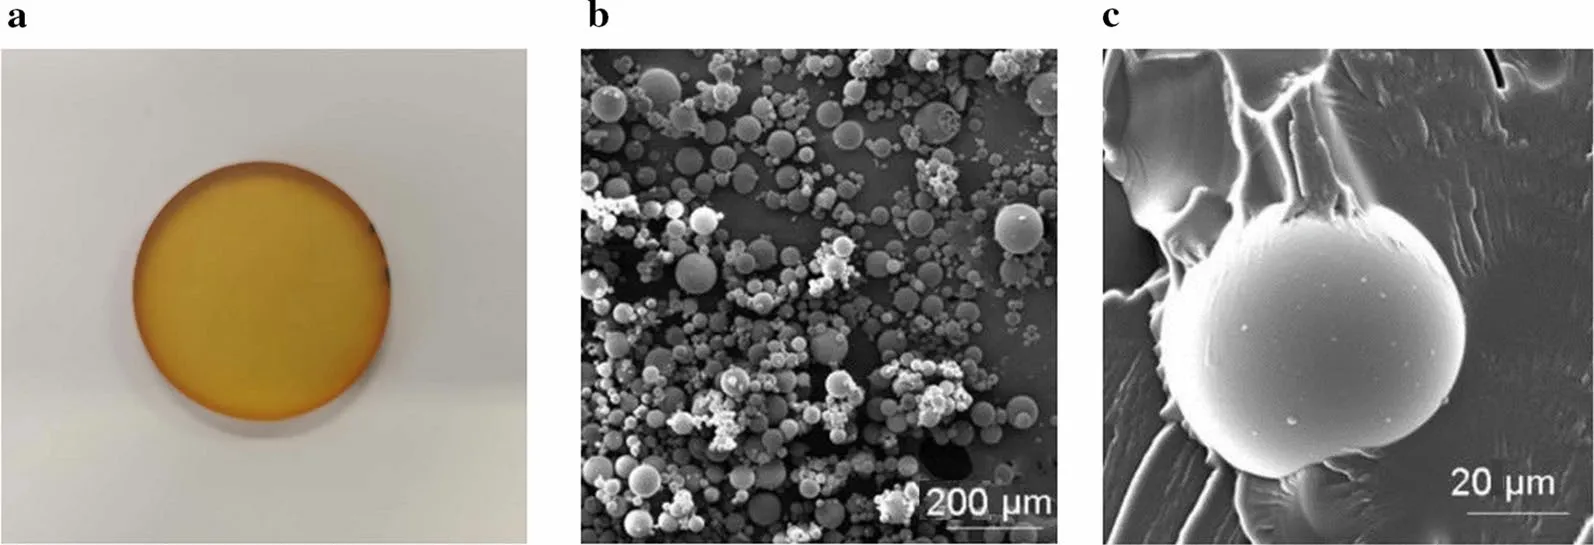
Fig. 1 a Photograph of an ultrasonic experimental sample of a polyurea-matrix composite with inclusions of 50 μm diameter and 10% volume fraction. b Electron micrographs. c Electron micrographs focusing on the interface of glass microsphere and polyurea-matrix
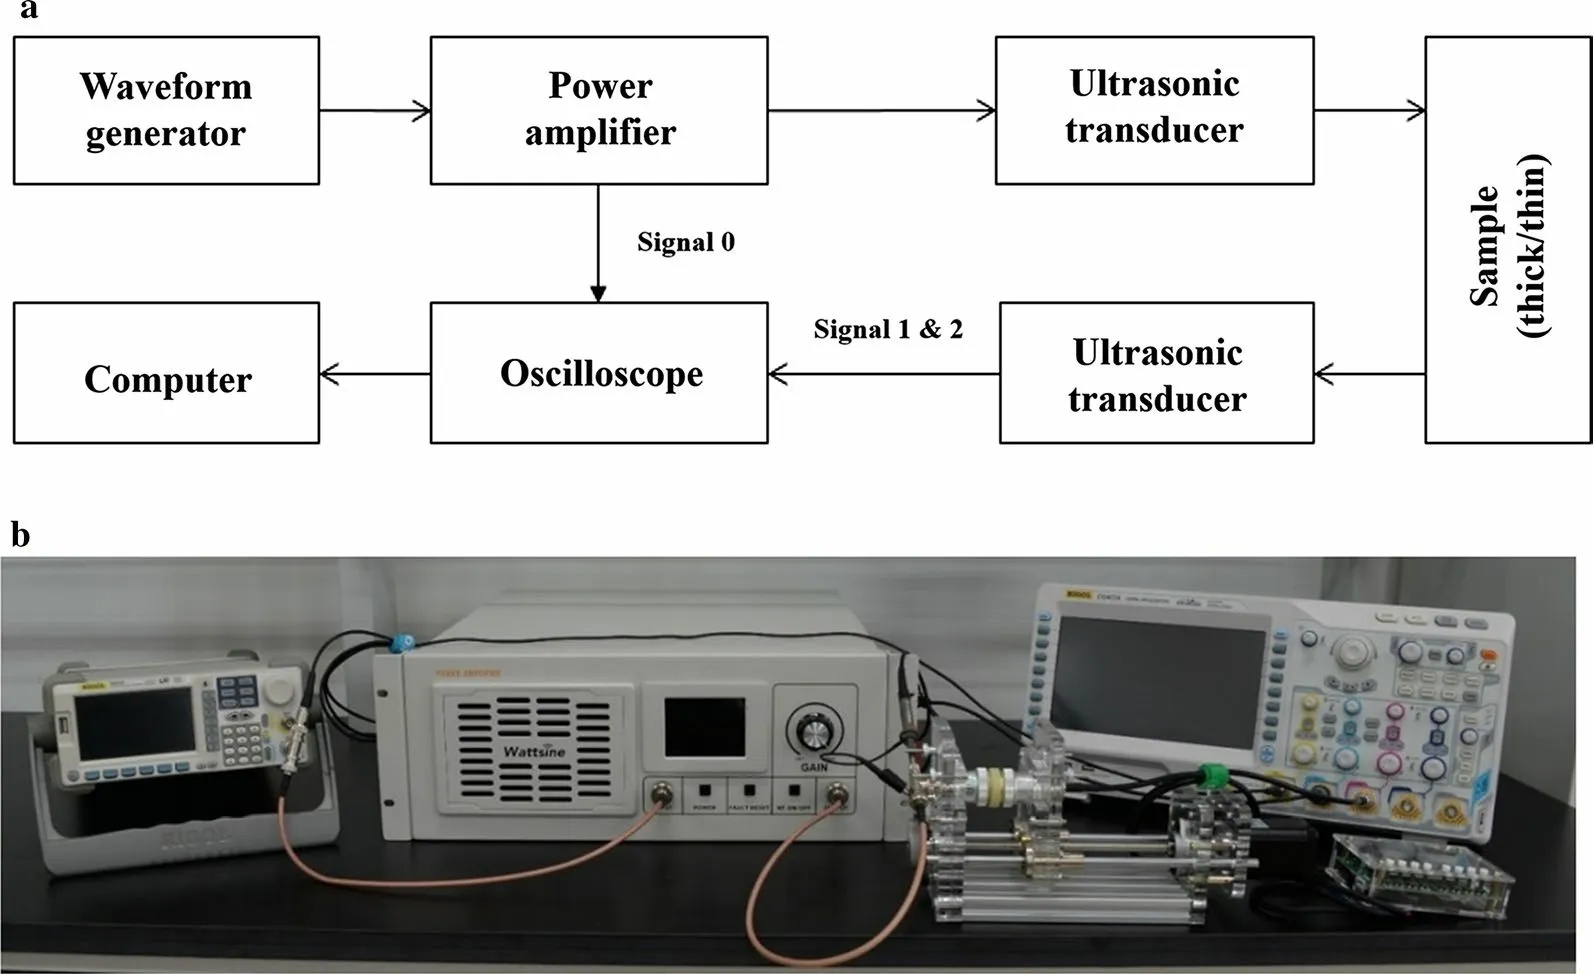
Fig. 2 a Block diagram of the test. b Schematic view of the experimental device. The device is used to separately test thick and thin samples. The results are compared to eliminate the interface impedance and the influence of signal delay in the device. The wave attenuation effect of the material is separated
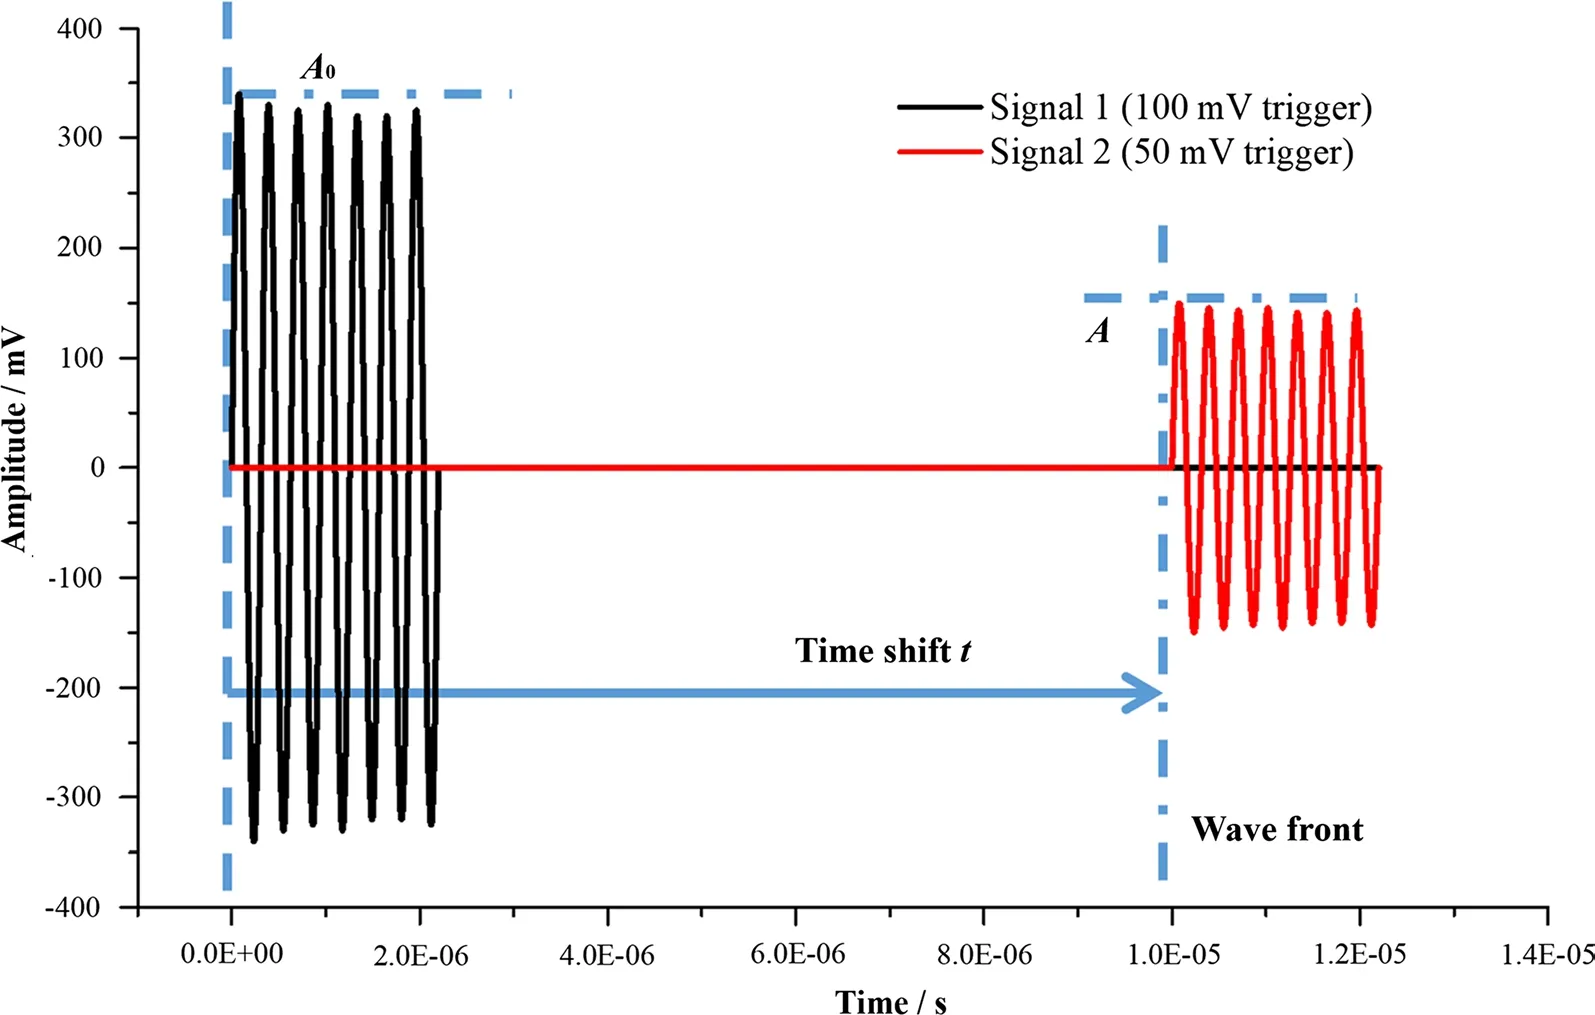
Fig. 3 Output signals for 4- and 6-mm samples under the same input signal. Signal 1 is the output curve after the 4-mm sample (obtained with a 100-mV triggering threshold value), and signal 2 is the output curve after the 6-mm sample (obtained with a 50-mV triggering threshold value), with the same input signal
3 Simulation of wave attenuation compared to experimental results
3.1 Constitutive fitting
In the simulation calculation, the glass spherical inclusion was treated as a linear elastic material with a density of 2470 kg/m3, an elastic modulus of 64.89 GPa and a Poisson’s ratio of 0.306. Since the sample of the ultrasonic experiment is in a small strain condition, the polyurea is fitted by the linear viscoelastic constitutive. In Ref. [24], the researchers used DMA for low-frequency experiments combined with the time-temperature superposition to fit the viscoelastic properties of polyurea. However, polyurea has extra attenuation properties at high frequencies, such that it can’t match well with experimental data. To achieve a better simulation for the experiment, constitutive fitting is directly performed with the usage of ultrasonic experimental data and described with the usage of a Prony series constitutive model, because it can better express the frequency and relaxation characteristics of the material [25]. The general expression of a Prony series form constitutive model is

among which τiis the relaxation time of each item, giis the weighting coefficient,N is an instantaneous modulus, and N is the number of Prony series items.
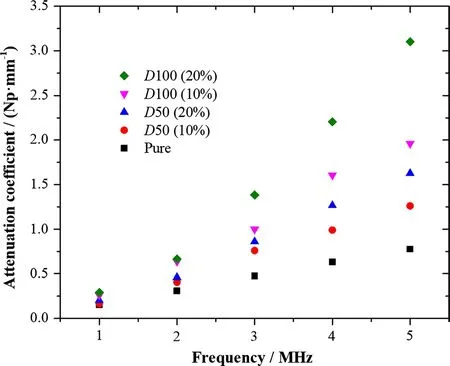
Fig. 4 Attenuation coefficient variation with frequency (1 Np = 8.686 dB)
Fitting the coefficients of the Prony series by least square method according to the attenuation coefficient of polyurea obtained by ultrasonic experiment [26, 27]:

where N is the number of Prony series items, K is the bulk modulus, c is the wave velocity andis the angular frequency.
The coefficients of the fitted Prony series constitutive model are obtained as shown in Table 1. It is substituted in the calculation as a constitutive relationship of polyurea as the matrix.
3.2 Model establishment
Ultrasonic experiment was carried out on composite samples. Then the experiment was simulated by using the FEM, which can be compared with the experimental data. The factors affecting attenuation performance can be studied in a larger parameter range.
The geometric model used in the simulation is a 0.5 × 0.5 × 0.5 mm cube, the matrix material is polyurea, and the spherical glass inclusions are placed in it by a random release procedure. After the cube, we set a 0.5 × 0.5 × 15-mm cuboid made of pure polyurea to prevent waves from reflecting at the end of faces, as shown in Fig. 5. In the experiment of Sect. 2.1, the thin sample and the thick sample are tested separately (signal 1 and signal 2 of Fig. 3), and the results are compared to eliminate the influence of wave reflection at the sample-transducer interface. In this simulation model, the absorbing boundary is simulated by adding a long section of pure polyurea material in the latter stage instead. The inclusions are randomly distributed equivalent to the cubic arrangement. When the volume fractions are 10%, 20% and 30%, the corresponding distances between inclusions are 86.82, 68.91 and 60.20 μm, respectively, as the inclusion diameter is 50 μm; in turn, when the inclusion diameter is 100 μm, the corresponding distances between inclusions are 173.65, 137.82 and 120.40 μm, respectively. The boundary conditions are also given in Fig. 5. A simple harmonic longitudinal wave with an amplitude of 200 kPa and a frequency of 1-5 MHz is applied on the end edge x = 0, which is free on the other end edge x = 15.5 mm. The remaining boundaries are fixed in the normal direction to simulate a one-dimensional wave propagation problem. For the FEM, each cube mesh has a side length of 20 μm, a simulation duration of 3 × 10⁻³s and a time step of 10-6s to ensure simulation stability.

Table 1 Prony series constitutive parameters of polyurea
In the simulation, the inclusion material (glass) uses a linear elastic constitutive. The matrix material (polyurea) uses a linear viscoelastic Prony series constitutive. The constitutive parameters are shown in Table 1. The elastic modulus is 67.1 MPa, the Poisson’s ratio is 0.4977 and the density is 1029 kg/m3. The viscous properties of the bulk modulus are neglected. Polyurea has temperature sensitivity [23], but there is basically no temperature change in the ultrasonic experiment, so the influence of temperature changes on material properties is ignored in the simulation.
3.3 Simulation results
In the calculation, the time-history curves of average stress were extracted from x = 0 mm to x = 0.5 mm sections. The amplitudes of two time-history curves are A1and A2, respectively. A2is significantly smaller than A1due to the attenuation effect in the composite during wave propagation. The attenuation coefficient characterizing the degree of attenuation for a wave in a unit thickness of material can be extracted from the simulation results

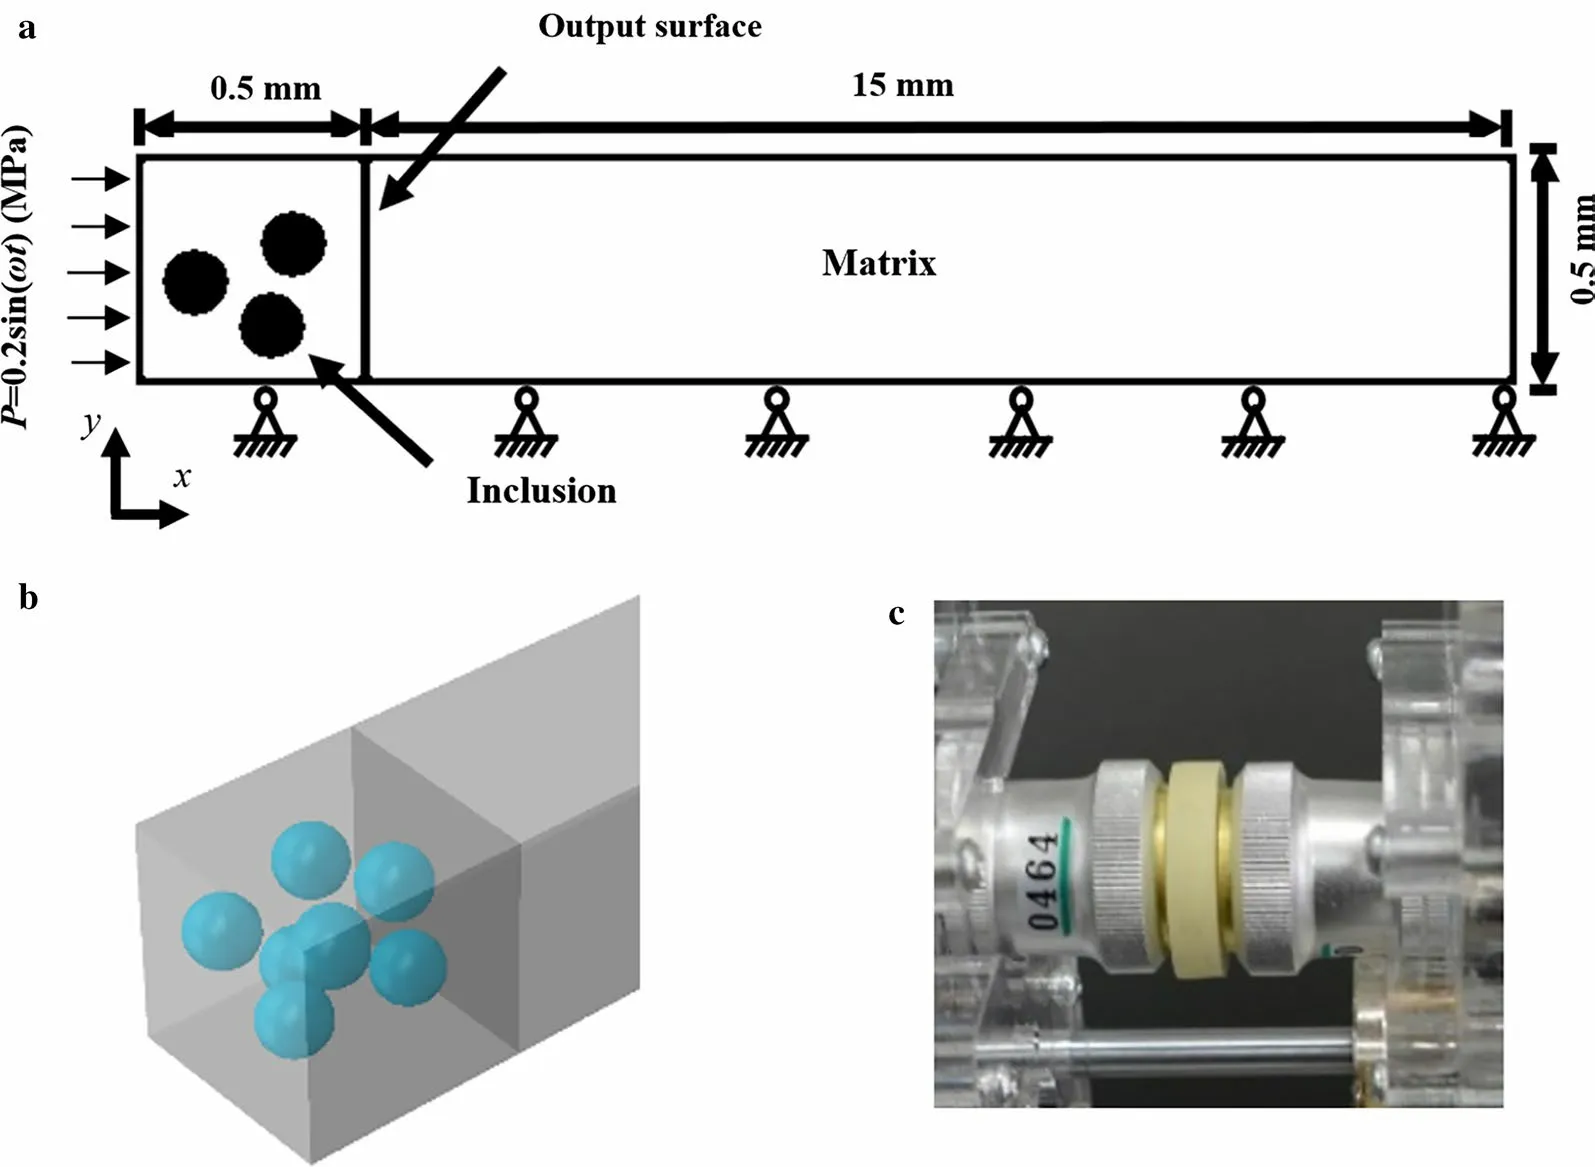
Fig. 5 Finite element simulation of wave attenuation. a Boundary conditions and dimensions of the simulation. b Inclusions generated by the random release procedure in the model. c Experiment corresponding to this simulation
among which d = 0.5 mm. The attenuation coefficients of the composites with different parameters are shown in Fig. 6, and the results of ultrasonic experiment are also plotted in the figure. It can be found that the simulated results are in a good agreement with the results of the ultrasonic experiment, indicating that the FEM simulation can well characterize the results of the ultrasonic experiment. In Fig. 6, for D100 (10%) and D100 (20%) at frequency of 5 MHz, the FEM results are larger than the experimental results, except for these two points; the FEM results of all other points are smaller than the experimental results. It is speculated that it is due to the cluster generated during the production of experimental samples. The composite samples used in the experiment are obtained by stirring and vacuuming after mixing the inclusions, so that the cluster phenomenon (that is, the synechia appears out of the adjacent inclusion) may occur in the preparation of the experimental sample, which may cause experimental error, but the cluster can not be considered in the finite element simulation. The cluster phenomenon occurs as the adjacent micro-inclusions are adhered to each other because of adsorption force, and the adhered inclusions are equivalent to the single inclusion with larger diameter. When the volume fraction is constant, the attenuation coefficient increases equivalently as a result of the cluster phenomenon, that is, the extraordinary attenuation coefficient produced is greater as the cluster phenomenon is more obvious. From the perspective of chemical production theory, (1) the cluster phenomenon is more obvious as the volume fraction is larger, as the relative distance between inclusions is smaller and the inclusions are denser; (2) with the same inclusion volume fraction, the cluster phenomenon is less obvious as the inclusion diameter is larger; (3) as the frequency increases, the wavelength becomes smaller, and the scale corresponding to the cluster is larger, so the effect of the cluster becomes less obvious. In Fig. 6, as the inclusion volume fraction of the composite sample is larger, the cluster is more obvious, which may lead to greater extraordinary effect. In Fig. 6, except for the data of the D100 (10%) and D100 (20%) samples at a frequency of 5 MHz, all other data points conform to the above rules, considering the extraordinary effort of the cluster’s existence during the preparation of experimental samples. As for the two points of the D100 (10%) and D100 (20%) samples at a frequency of 5 MHz, the simulation result of the attenuation coefficient is higher than the experimental result of the attenuation coefficient, which may be due to: (1) the extraordinary effect caused by the cluster being smaller than other samples, as mentioned above, such that the extraordinary effect is weaker as inclusion diameter increases and frequency increases; (2) the error of experimental results. At a frequency of 3 MHz, the experimental result of D100 (20%) is obviously higher than the simulation result. The possible explanation may be that the scale of the cluster of the D100 (20%) sample used in the experiment is sensitive to the frequency of 3 MHz. It is the uniqueness of the sample used in the experiment that leads to the error at this point, which is familiar in many ultrasound experiments. At the same time, it can be found that the increase of volume fraction and inclusion diameter will increase the attenuation coefficient of the composites. This effect will be more significant when the volume fraction increases, as shown in Fig. 7.
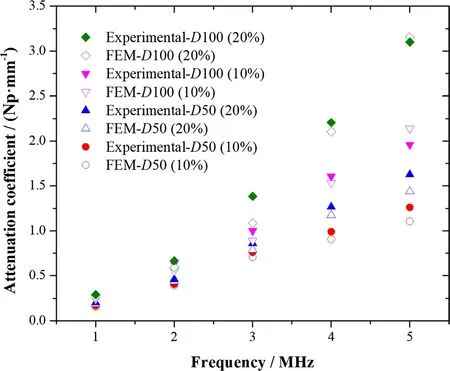
Fig. 6 Comparison of finite element simulation and experimental results for composites with different parameters. The solid icon is the result of the ultrasonic experiment and the hollow icon is the result of FEM simulation, where D is the diameter of inclusion
4 Contributions of inclusions to the attenuation properties
4.1 Contributions of inclusions
Compared with pure polyurea, the insertion of inclusions produced extraordinary effects on attenuation properties. The differences between the attenuation coefficients of the composite and the pure polyurea were represented by αc. Composites with different parameters have different αc, as shown in Fig. 8.
The insertion of inclusions has great influence on the attenuation coefficients. On one side, the inclusions occupy the volume of polyurea, which may decrease the viscous attenuation; on the other side, the insertion of inclusions introduces the scattering and vibration attenuation, which may increase the attenuation.
4.2 Analysis theories
A meso-mechanical model was used to analyze the ultrasonic attenuation mechanism of composites. The attenuation of composites on waves is the result of several main mechanisms such as scattering, viscosity and vibration [28]. The insertion of inclusions will influence the total attenuation properties by the three mechanisms above. However, it is difficult to separate these mechanisms in the calculation and experiment, so they can only be analyzed by the theoretical method. Based on the previous theoretical models [29], the contribution of inclusions to wave attenuation properties of polyurea-matrix composites is analyzed. The theory used is mainly based on the work of Biwa et al. [30] to calculate the displacement field generated when the wave propagates through the composites.

Fig. 7 Finite element simulation of the composites with different parameters. a Composites in which the inclusions volume fraction is 10%. b Composites in which the inclusions volume fraction is 20%. c Composites in which the inclusions volume fraction is 30%

Fig. 8 Contributions of the insertion of inclusions to attenuation properties. a Composites in which the inclusions volume fraction is 10%. b Composites in which the inclusions volume fraction is 20%. c Composites in which the inclusions volume fraction is 30%
It is found that there is a coupling mechanism, and the attenuation generated by the three mechanisms can’t be separated well [31]. Regarding the composites study, the spherical inclusions are considered to be randomly distributed. The material of inclusion is isotropic linear elastic, and the material of matrix is isotropic linear viscoelastic. We propose a hypothesis to simplify the problem, which is to separate the energy dissipation of the harmonic wave into three parts: scattering, viscosity and vibration dissipation. That is, the viscous dissipation is mainly generated by the matrix. It is considered that the dissipation of matrix is proportional to the volume fraction of matrix and is not related to the inclusion scattering. The scattering dissipation is generated by the interface between the inclusion and matrix, while the dissipation is not related to the viscosity of the matrix. The vibration is generated by the vibration of inclusions, which is related to the parameters of the inclusions and the viscosity of the matrix. In this way, three dissipation mechanisms are clearly described.
For the attenuation coefficient caused by inclusion vibration, the energy dissipation occurs only when there is energy localization (resonance) [32]. Based on Ref. [32], the resonant frequency of the inclusion mesoscopic model is calculated by

for the composites used, among which Esis the Young’s modulus of matrix, ρsand ρincare the densities of matrix and inclusion, respectively, R is the inclusion radius and tsis the equivalent inclusion distance. Based on the calculation work of Wang et al. [32], for high-frequency ultrasonic loading conditions (1-5 MHz), the resonance frequency is far from the loading frequency, so there is no energy localization effect, and the energy dissipation caused by resonance is negligible. So, suppose only the attenuation caused by scattering and viscosity is considered here as given in the following sections.
4.3 Dissipation mechanism analysis
The research problem is actually a spherical inclusion presented in an infinite matrix, as shown in Fig. 9. For the scattering problem of a single inclusion, it can be seen as an elastic solution for a spherically symmetric problem. The details of this work are expressed in Ref. [33], based on the work of Biwa et al. [34]:
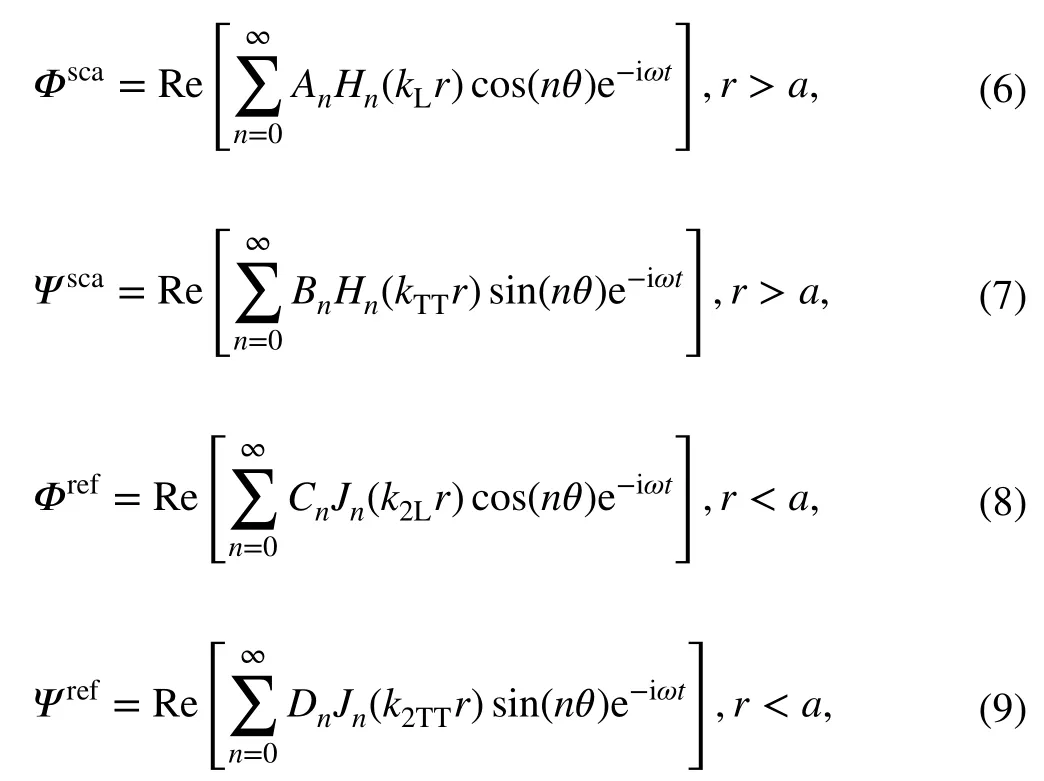
where Φ and Ψ represent the potential energy of expansion and rotation, respectively, the superscripts sca and ref represent the parameters of scattered and refracted waves, respectively, Jnand Hnrepresent the n-order Bessel and Hankel functions, respectively, and k2Land k2TTare the wavenumbers of longitudinal and transverse waves, respectively, in the inclusion. According to the fluctuation equations and boundary conditions, An, Bn, Cnand Dncan be obtained. The specific derivation process can be seen in Ref. [17]. In the actual calculation, these equations are solved numerically, where n takes 0, 1, 2,…, 50. The results are substituted into the displacement and stress fields. The scattering cross-sectional area of a single inclusion is calculated. The reflected stress part is dissipated as a result of scattering, and then the attenuation coefficient caused by scattering is obtained

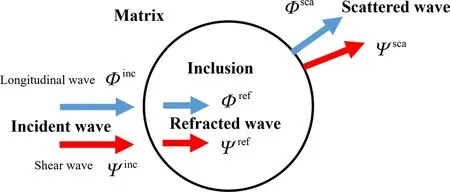
Fig. 9 Simplified analysis model of scattering-induced wave attenuation

For the dissipative part caused by viscosity, the attenuation coefficient is considered to be proportional to the volume fraction occupied by the matrix, and is irrelevant to the scattering effect

where α0is the experimentally measured attenuation coeffi-cient and φ is the volume fraction. The relationship between the volume fraction φ and inclusion diameter d is

Combining Eqs. (11) and (12), the whole attenuation coefficient of the composite is expressed as

4.4 Theoretical results
The parameters used in the theoretical analysis are as follows: (1) matrix parameters: E0= 67.1 MPa, v0= 0.4977, ρ0= 1029 kg/m3; (2) attenuation coefficient: α0= 1.56 × 10⁻⁴Np·s/m; (3) inclusion parameter: E1= 64.89 GPa, v1= 0.306, ρ1= 2470 kg/m3.
By substituting these parameters into Eq. (14), the specific harmonic wave energy dissipation can be obtained, which results in the viscosity and scattering of composite material. For example, for composites with inclusion diameters of D = 50 μm and D = 75 μm and volume fractions of 10% and 20%, the attenuation coefficient caused by viscosity and scattering, respectively, is given in Fig. 10. The total attenuation coefficient of material with frequency is also given in Fig. 10. The comparison with experiment and simulation results is shown in Fig. 11, in which it is found that there is good consistency, indicating that the superposition of the dissipation effect from scattering and viscosity is effective. That is, at high frequencies, the attenuation caused by inclusion scattering is not coupled to the attenuation caused by the viscosity of the matrix, while the attenuation caused by inclusion vibration is negligible here. In Fig. 11, when the inclusion size is 100 μm, the difference between the results of theory and the experiment becomes large, because the theoretical model in this paper is based on the semi-infinite general assumption and the neglect of the interaction between the inclusions. When the inclusion volume fraction is constant, the mutual influence between the inclusions is greater as the inclusion diameter is larger and the load frequency is higher. Therefore, it could be qualitatively explained that for the D100 (10%) sample and D100 (20%) sample, the difference between theoretical and experimental results is greater when the frequency is higher (4 MHz or 5 MHz). When the frequency is 5 MHz, the theoretical results may not be accurate.
The total attenuation coefficients of different materials are shown in Fig. 12. It can be seen that when the volume fraction increases and the inclusion diameter becomes larger, the total attenuation coefficient increases. For the composites concerned, the attenuation coefficient increases as frequency increases, which is consistent with the simulation and experimental results. Also, the increase of attenuation coefficient is attributed to the scattering part, which offsets the decrease of attenuation coefficient caused by viscoelastic matrix. This reflects the role of scattering in the overall attenuation process.
To further investigate the role of attenuation caused by scattering, the parameter pscais introduced to characterize the effect of attenuation caused by scattering in the overall attenuation

The pscavalues of composites with different parameters are shown in Fig. 13. It can be seen that the results of the scattering proportion increase when the frequency, inclusion diameter and inclusion volume fraction are increased. For the volume fraction of 20%, inclusion diameter of 100 μm and frequency of 5 MHz, the contribution of scattering to attenuation can reach to more than 80%.
5 Summary and conclusion
In this paper, the viscoelastic properties of polyurea and polyurea-matrix composites are measured by ultrasonic experimental equipment with high frequency. The variation curves of attenuation coefficients for different materials with frequency (1-5 MHz) are obtained. The polyurea viscoelastic constitutive is obtained from the ultrasonic experimental data. Through the experiments, it is found that the attenuation coefficients of polyurea and polyurea-matrix composites increase linearly with increasing frequency, which have good attenuation properties. Using the viscoelastic constitutive parameters and the explicit dynamic analysis of the FEM, the results of the ultrasonic experiments are well simulated. The variation law of the attenuation coefficient with the parameters of composites is obtained. It is found that within the range of measurement (1-5 MHz), the larger the volume fraction and diameter of inclusions are, the larger the attenuation coefficient becomes, which is consistent with the results of ultrasonic experiments.
By theoretical analysis, the scattering attenuation and the viscous attenuation are decomposed. The mechanism of composite attenuation is explained, and the results of experiment and calculation are mutually verified. Theoretical analysis shows that with the increase of volume fraction and inclusion diameter, the part of scattering in the attenuation coefficient of composite increases obviously, which partly offsets the decrease of matrix viscosity caused by parameter variation. Thus, the overall attenuation coeffi-cient is increased. It is worth noting that the polyurea-matrix composite has good attenuation properties for shock waves because of two characteristics. On one hand, polyurea itself exhibits a phenomenon of microphase separation and has good viscoelastic wave dissipation properties. On the other hand, because the modulus of polyurea is low, there will be a strong impedance mismatch between the glass spherical inclusions, causing a large attenuation due to scattering. By controlling the parameters of polyurea synthesis further, including the content of soft or hard segments to modify the properties of polyurea, such as modulus and viscoelasticity, we expect to achieve a better performance of wave protection.
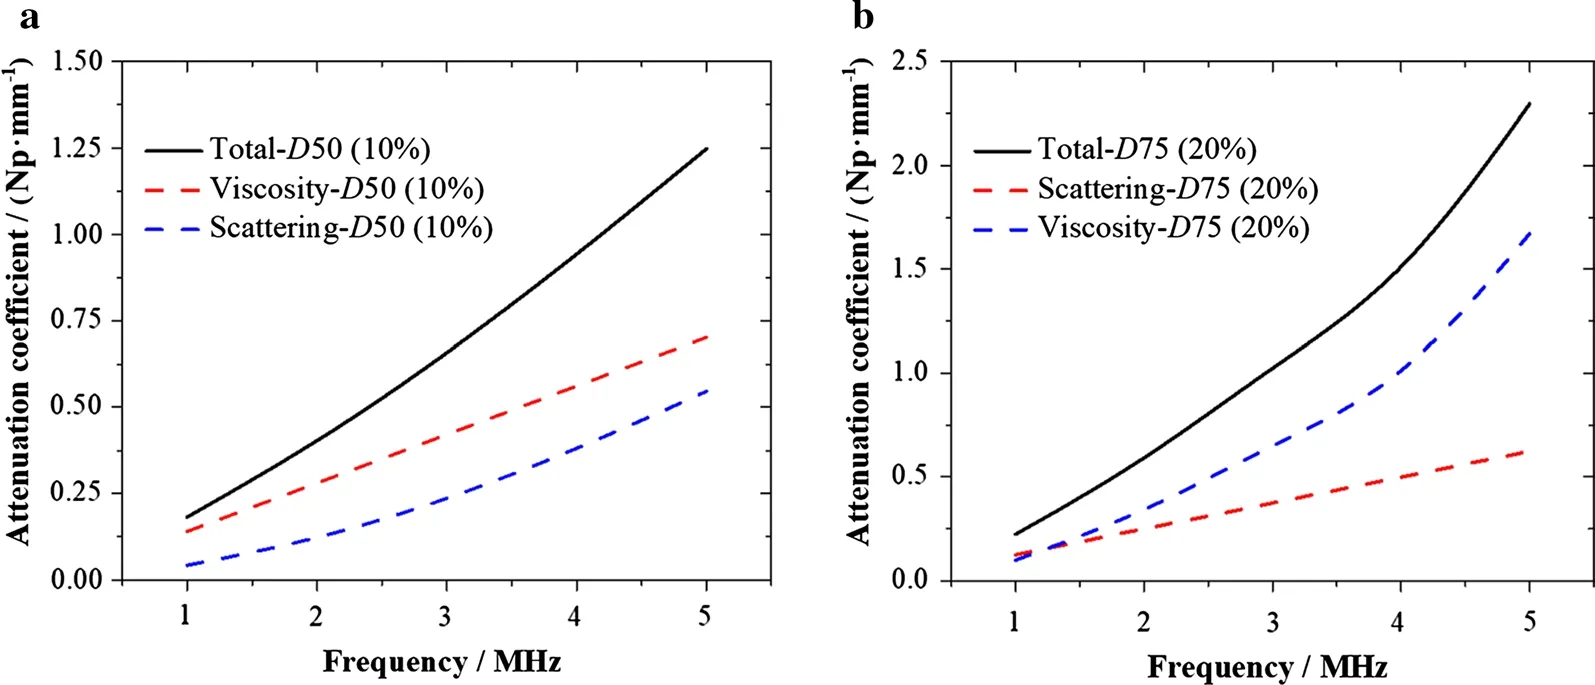
Fig. 10 Contribution ratios of scattering and viscosity in the attenuation coefficient. a Composites with inclusion diameter D = 50 μm and volume fraction 10%. b Composites with inclusion diameter D = 75 μm and volume fraction 20%
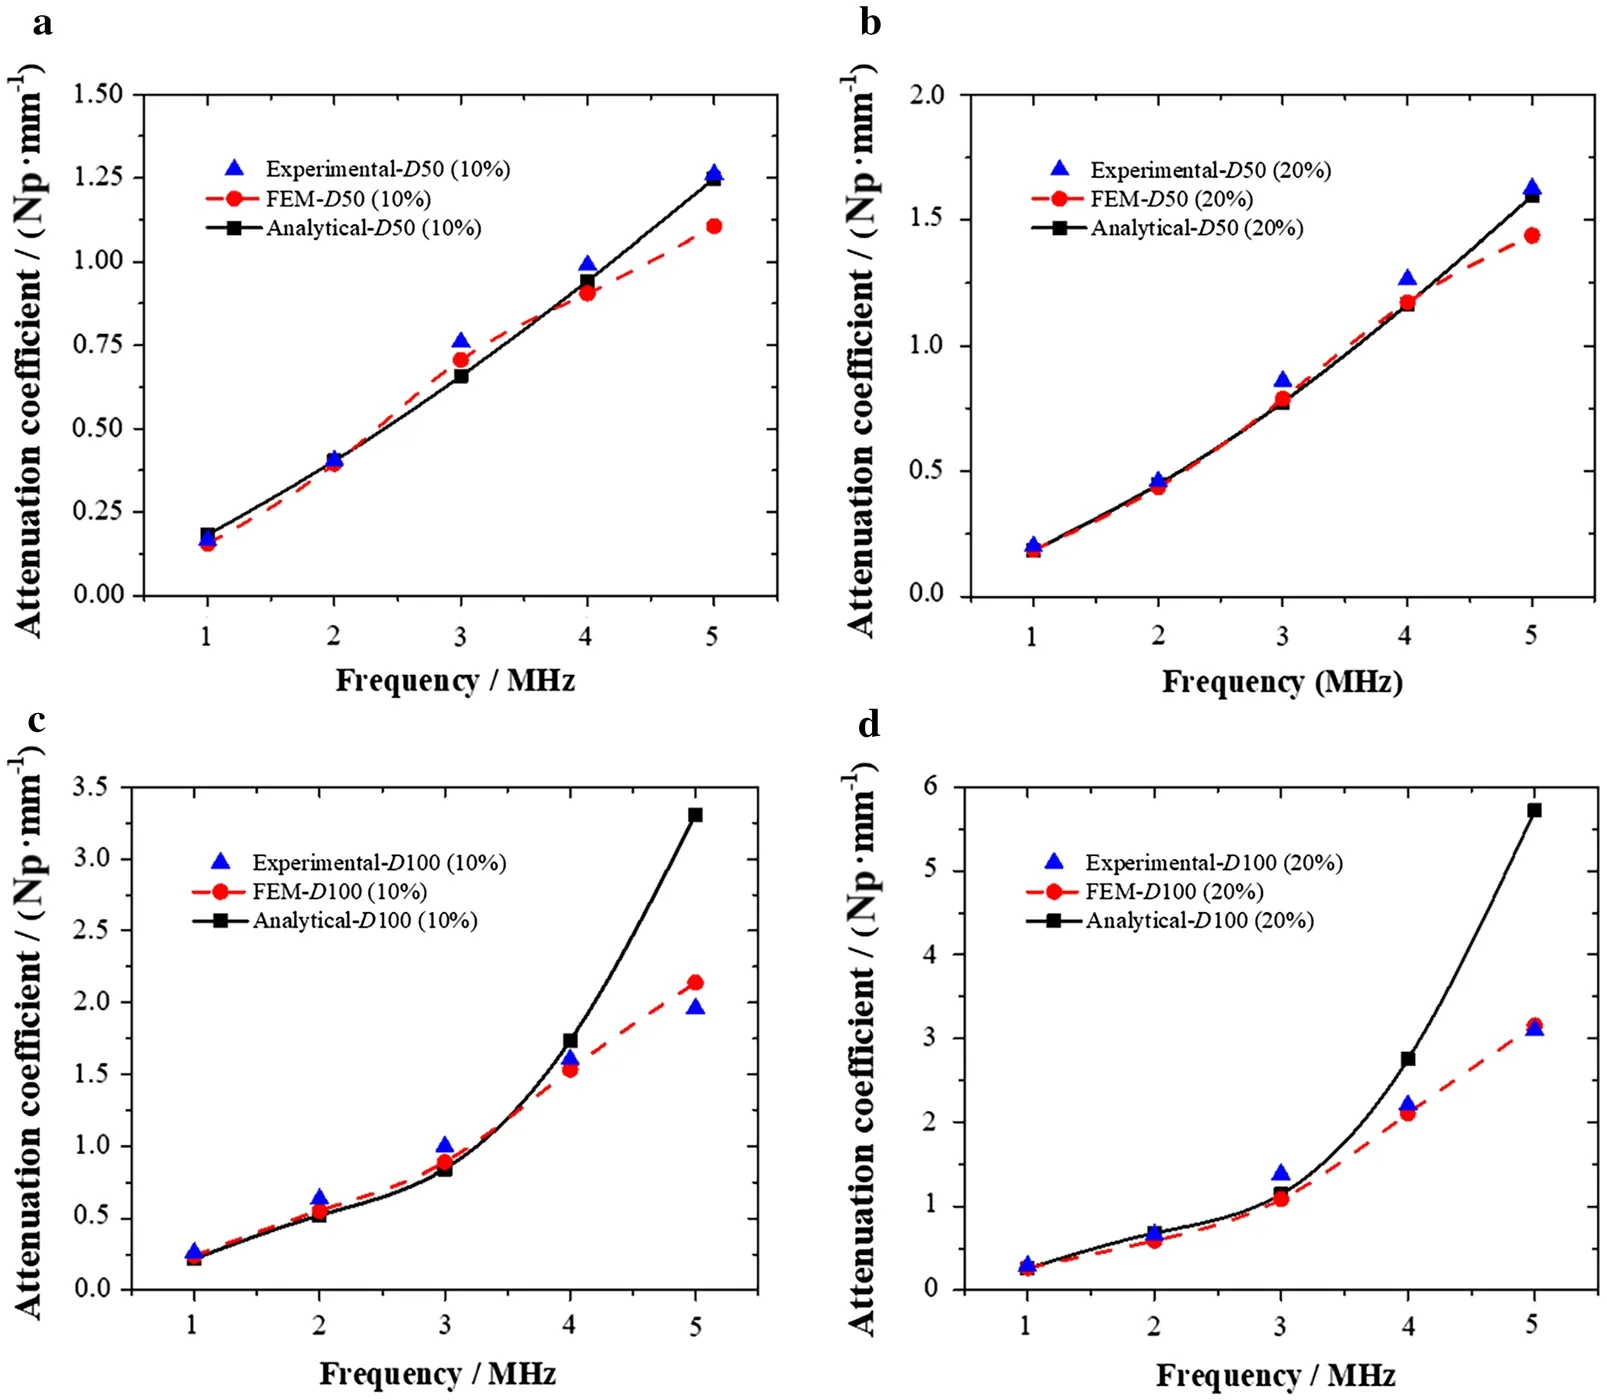
Fig. 11 Comparison of attenuation coefficients with experimental data. The blue scatters indicate experimental data, the red dotted lines indicate FEM results and the black solid lines indicate theoretical analysis results. a Composites with inclusion diameter D = 50 μm and volume fraction 10%. b Composites with inclusion diameter D = 50 μm and volume fraction 20%. c Composites with inclusion diameter D = 100 μm and volume fraction 10%. d Composites with inclusion diameter D = 100 μm and volume fraction 20%

Fig. 12 Attenuation coefficients of composites with different parameters

Fig. 13 Proportion of scattering fractions in the attenuation coefficients of composites with different parameters
杂志排行
Acta Mechanica Sinica的其它文章
- Geometric and material nonlinearities of sandwich beams under static loads
- Coupled thermoelastic theory and associated variational principles based on decomposition of internal energy
- Transient growth in turbulent particle-laden channel flow
- Experimental and theoretical investigation of the failure behavior of a reinforced concrete target under high-energy penetration
- Efficient algorithm for 3D bimodulus structures
- Generalized stiffness and effective mass coefficients for power-law Euler-Bernoulli beams
