Effect of particle motion on the hydraulic collection of coarse spherical particles
2020-05-06YuxiangChenHongXiongHuiChengChunliangYuJiahuaXie
Yuxiang Chen · Hong Xiong · Hui Cheng · Chunliang Yu · Jiahua Xie
Abstract Deep-sea mining, through which shattered coarse solid mineral resources are hydraulically collected and transported, is a promising solution for problems associated with resource exhaustion. This study reports some interesting phenomena observed in a series of upward pumping experiments conducted on a coarse sphere with a 2-cm radius. The sphere was hydraulically lifted using a vertical pipe with a 5-cm radius suspended above the sphere. Remarkably, the tangential motion benefited the collection. The discrete element method-computational fluid dynamics was used to investigate the collection mechanism; this method was used to simulate the collecting processes of the sphere under different initial motion conditions. The simulated results agreed well with the experimental observations. The vortices over the sphere induced by its motion coupled with the main stream mainly provide sufficient lift force to raise the sphere.
Keywords Solid-liquid two-phase flow · Deep-sea mining · CFD-DEM
1 Introduction
Mineral resource exhaustion problems have long captured the public attention. Such problems might be solved by mining oceans, which hold a veritable treasure trove of valuable resources [1]. Dispersed on huge areas of deep seabed, polymetallic nodules of minerals (mainly manganese and iron) range from the size of a potato to the size of a lettuce head [2]. The estimated total weight of polymetallic nodules on the seabed is approximately 500 billion tons. In 1978, research findings of the Ocean Mining Incorporation indicated that mineral mining by the hydraulic collection method is more effective than the direct mechanical method, environmentally friendly, and adaptive to complex seabed terrains [3]. Subsequently, many researchers collected mineral nodules using mechanical and hydraulic collection machines in the early 1980s.
Oebius [4, 5] conducted a series of laboratory experiments on the hydraulic collection of nodules detached from seabed sediments. Grupe [6] measured the lift forces that drag nodule samples from the sediment during the hydraulic collecting method under laboratory conditions. Hong et al. [7, 8] established a 2D flume tank to understand the hydraulic collection method. They noted that the position and shape of the baffle plates are primary determiners of the collecting efficiency. Yang et al. [9] analyzed the geometric parameters of a collecting device and their influences on the device through laboratory tests; they found that an appropriately shaped hydraulic collecting device can increase the collecting rate. Numerous engineering experiments have revealed the relations between the collecting efficiency and factors such as particle size, bottom clearance, geometric parameters of the collecting device, and flow rate. However, details of the flow field and mechanism of particle motion during the collecting process have rarely been discussed. Zhao et al. [10, 11] performed collection tests on a fixed sphere under conditions, such as varying bottom clearance and collection flow rate, both experimentally and numerically; they reported that the variation in the wake vortex primarily induced an unsteady lift force. Further, Zhao et al. [12] collected several particles simultaneously and visualized the characteristics of the suction flow field. They considered that vortex formation strengthened the suction force. Chen et al. [13] studied the lift-off of a single particle from the bottom in hydraulic collecting. They analyzed the influence of particle size, bottom clearance, and particle density on the particle starting velocity and flow field by particle image velocimetry (PIV). The continuum approach in computational fluid dynamics (CFD) can be applied to the mixtures of the fluid and fine particles based on the solution of underlying conservation equations. However, this approach is not suitable for depicting the coarse particles-water mixture. An encouraging approach for modeling such mixture flows is the coupled CFD and discrete element method (DEM) [14, 15], in which the DEM models the behavior of granular materials and the finite volume model in CFD models the continuous fluid component. A CFD-DEM model executed using open-source CFD-DEM coupling software has predicted the hydraulic lifting of a coarse sphere through a suspended vertical pipe [16].
The present paper aims to investigate the mechanism of particle motion during hydraulic collection. Section 2 presents the upward-pumping experimental setup and the experimental findings. In Sect. 3, the motion of the sphere induced by the pumping flow is simulated using coupled CFD-DEM and the flow characteristics and lift force around the sphere are analyzed. The results are analyzed in Sect. 4, and a brief conclusion is presented in Sect. 5.
2 Experimental apparatus and observed phenomena
To obtain details regarding the motion coarse particles and their flow characteristics-in particular, to understand the fluid-solid coupling effect-a series of experiments were conducted on a hydraulically collected coarse sphere with a 2-cm radius. The experimental apparatus comprised a glass tank containing recycling water, a transparent vertical pipe with a radius of 5 cm, and stainless steel bench frames (see Fig. 1). The experimental water tank was 2-m long, 1.5-m wide, and 1-m deep. The fluid flow was driven using a centrifugal slurry pump, HYSB 4/3-AH, with a variable speed drive (Emerson EV2100-4T0110A). The flow rate was measured using a magnetic flow meter (Meacon LDG-MIK-DN80). The distance between the bottom of the collecting tube and center of the sphere was precisely controlled using two lift platforms. The honeycomb baffle near the flow inlet in the water tank served two purposes: decreasing the height of the surface waves and improving the uniformity of the water replenishment. The mixture flow was recorded using a high-speed digital camera (Photron FASTCAM Mini WX50) with a maximum frequency of 675,000 fps and an image resolution of 2048 × 2048 pixels.
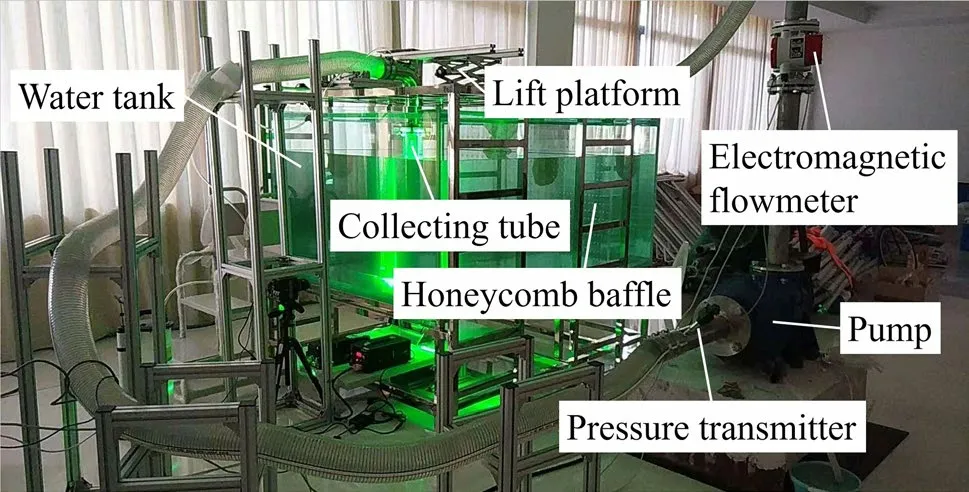
Fig. 1 Experimental apparatus (Institute of Deep-sea Science and Engineering, Chinese Academy of Science)
The relationships between the bottom clearance h , pipe diameter D , sphere diameter d , and volume flow rate QVwere determined via experiments. When the bottom clearance h and flow rate QVwere fixed (e.g., h=7 cm , ( QV=56.5 m3∕h ), the sphere placed beneath the pipe was lifted directly, but when h was varied (e.g., increased from 6 to 7 cm in a 1.0-cm increment), the sphere remained near its original position under the pipe. In some variableheight cases, the sphere moved slightly to and fro; in others, it moved spirally under the bottom edge of the pipe and was quickly sucked into the pipe after a sudden acceleration (see Fig. 2). The motion tangent to the circle was conjectured to benefit the hydraulic collection. To verify this conjecture, the sphere was placed under the bottom edge of the pipe and driven along a velocity tangent in a concentric circle around the edge of the pipe. The sphere was elevated into the pipe following a spiral-like trajectory (see Fig. 3). Several subsequent experiments under the same conditions ( h=7 cm , QV=56.5 m3∕h ) exhibited similar phenomena.
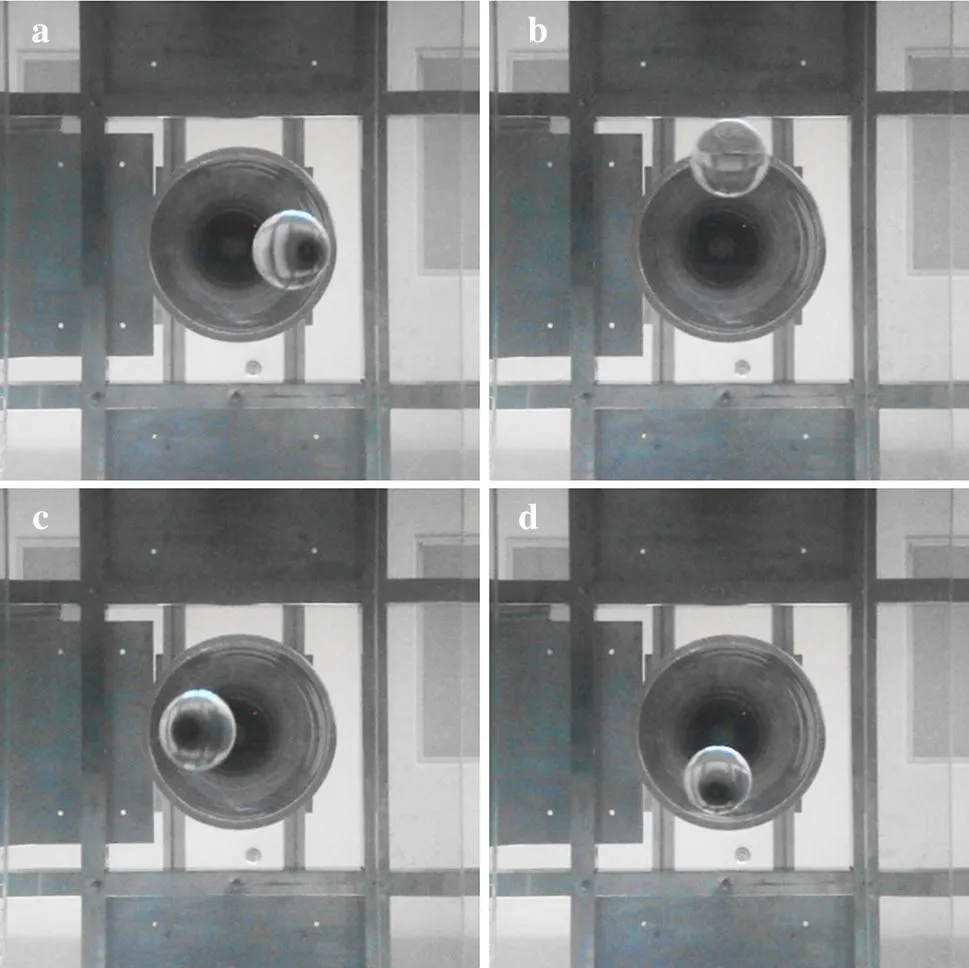
Fig. 2 Circular movement of a sphere (a sequence of photos labelled (a-d) in chronological order, which is observed from beneath)
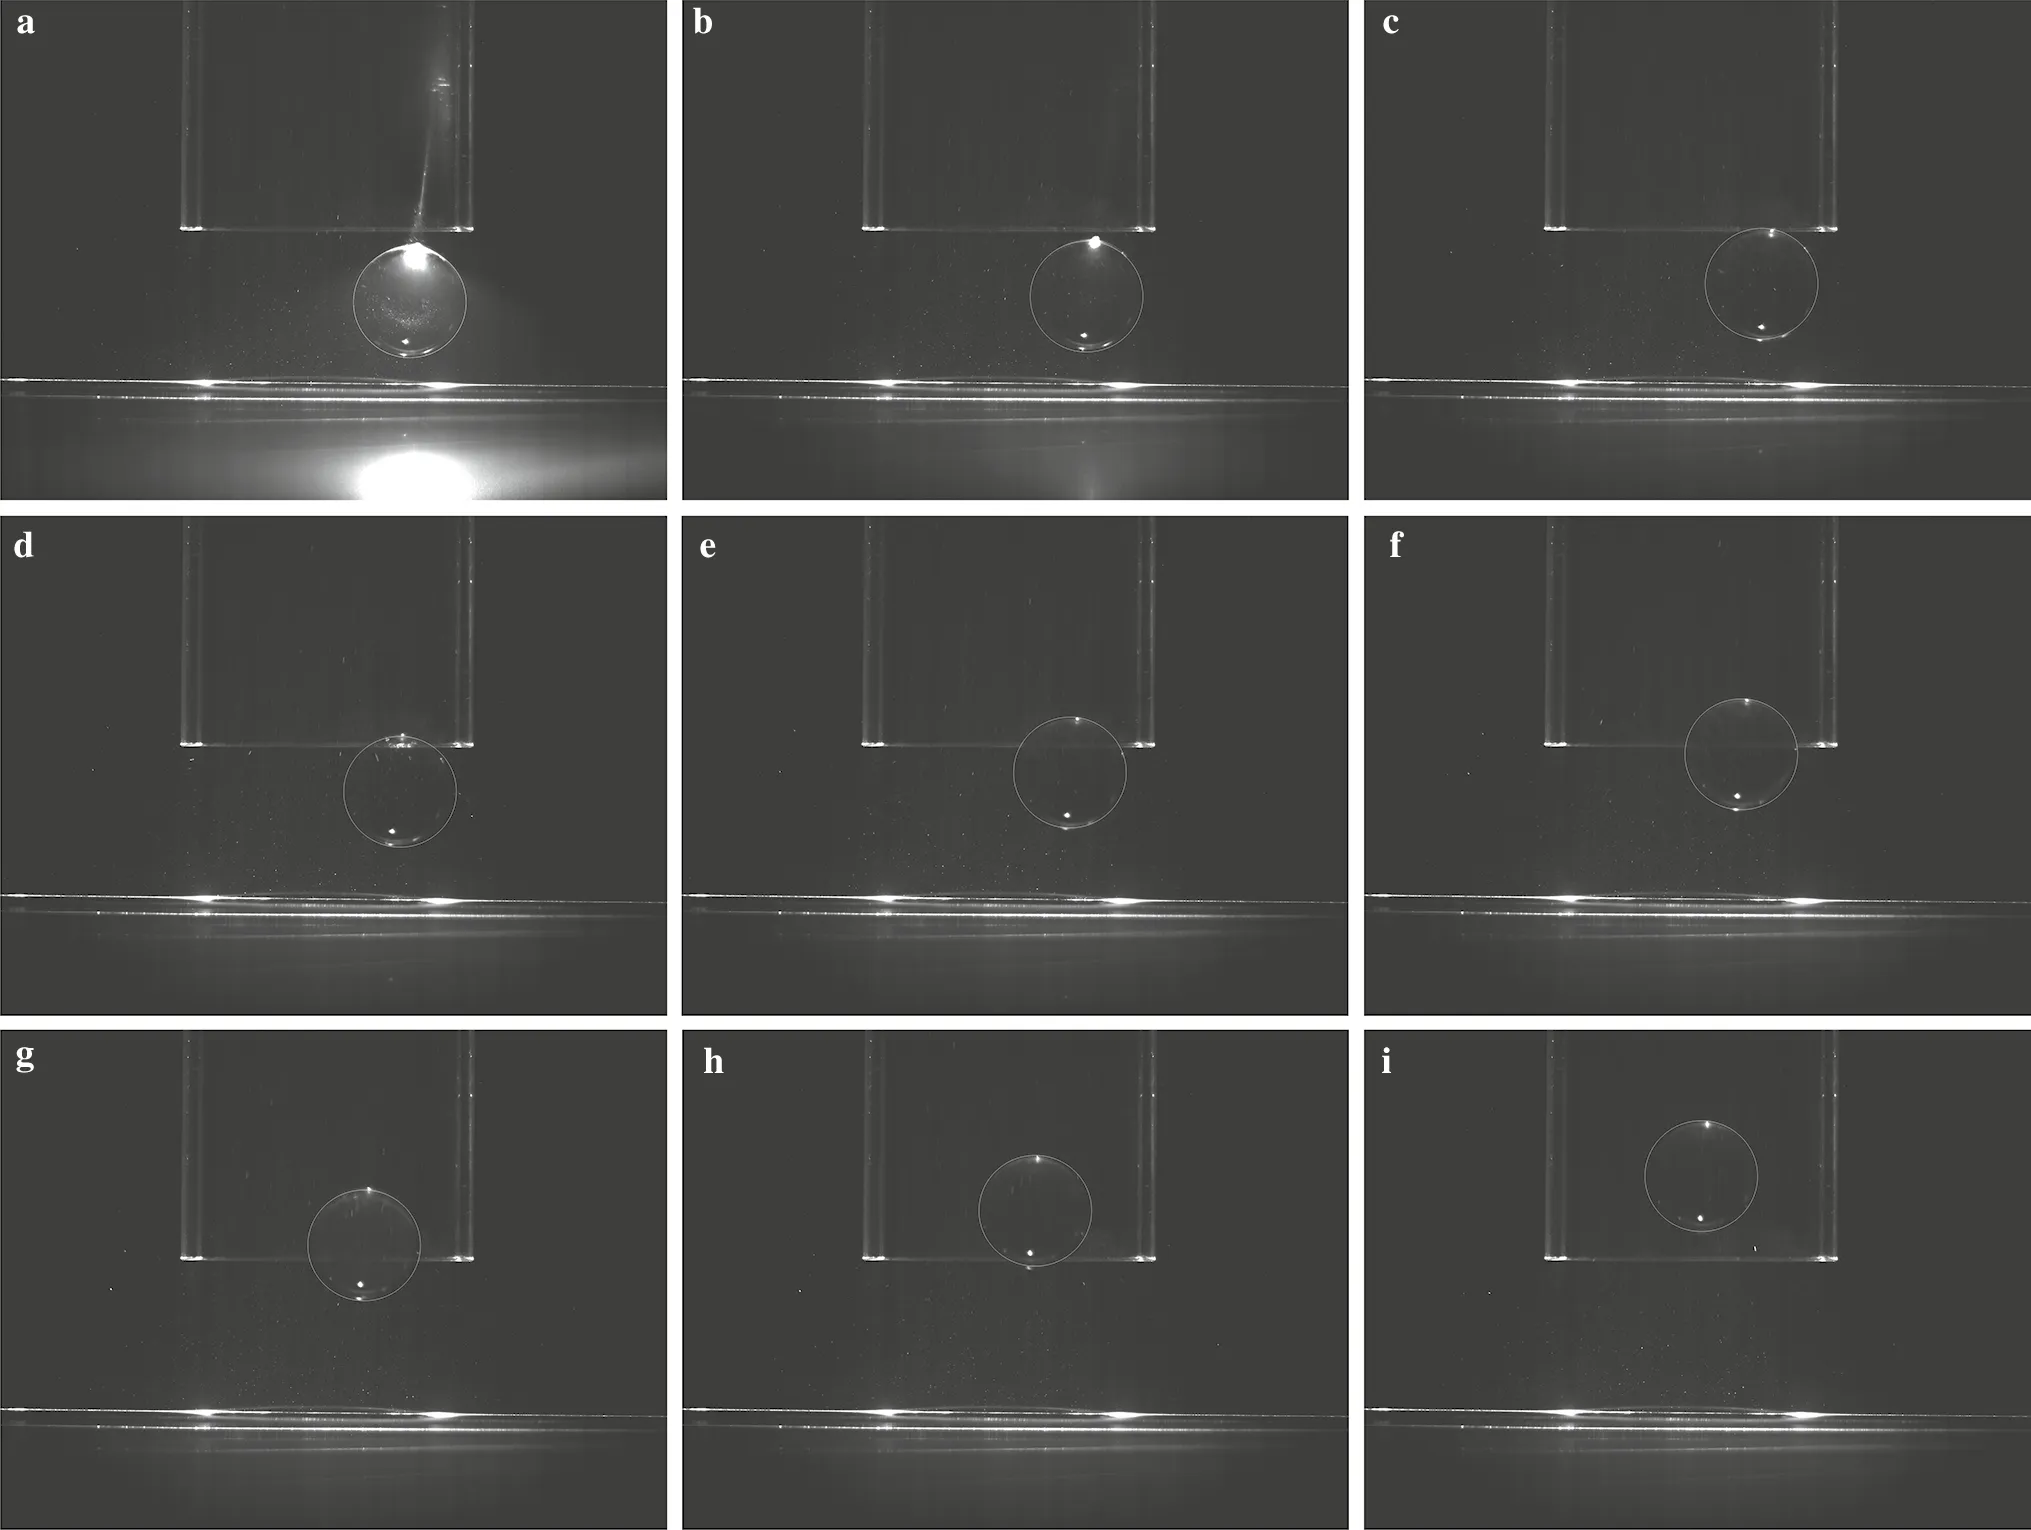
Fig. 3 A sequence of images of the sphere movement captured at 0.01-s intervals, which are labelled (a-i)
3 Numerical method and model
3.1 Numerical method
The measurement techniques of the apparatus cannot capture the complete motion process; in particular, these techniques cannot accurately monitor the flow field. Thus, the CFD-DEM method is adopted for further analysis.
The particle phase of the CFD-DEM is based on the softsphere model originally proposed by Cundall and Strack [17]. In this model, the particles are allowed to be minutely deformed; these deformations are used for calculating the elastic, plastic, and frictional forces between the particles. A characteristic feature of soft-sphere models is their ability to handle multi-particle contacts, which are important when modeling quasi-static systems.
The CFD-DEM model is based on a strategy that describes the momentum exchange between the fluid and solid phases. At any given instant, it finds the velocities and pressures of the fluid in each computational cell as well as the positions and velocities of all particles in the cell. The momentum exchanges that occur in the solid and fluid phases are calculated as

where ρfis the fluid density, Fpfis the volume fraction of the fluid, u is the fluid velocity, and Fpfis the volumetric particle-fluid interaction force, which is related to the particle-fluid interaction fpf, p is the local mean fluid pressure, τ is related to the stress tensor, and g is the gravitational acceleration, miand viare the mass and velocity of particle i , respectively, and kcis the number of particles interacting with particle i . Finally, fc,ijis the inter-particle elastic force and fd,ijis the viscous damping force [18-20]. In the single-sphere case discussed here, the equations can be simplified. The CFD-DEM accurately obtains the flow resolution and represents the particulate phase by a fictitious domain method [21] that assigns a single velocity and pressure field to both phases. The velocity in the regions covered by a particle is equivalent to the velocity of the particle itself (see Fig. 4).
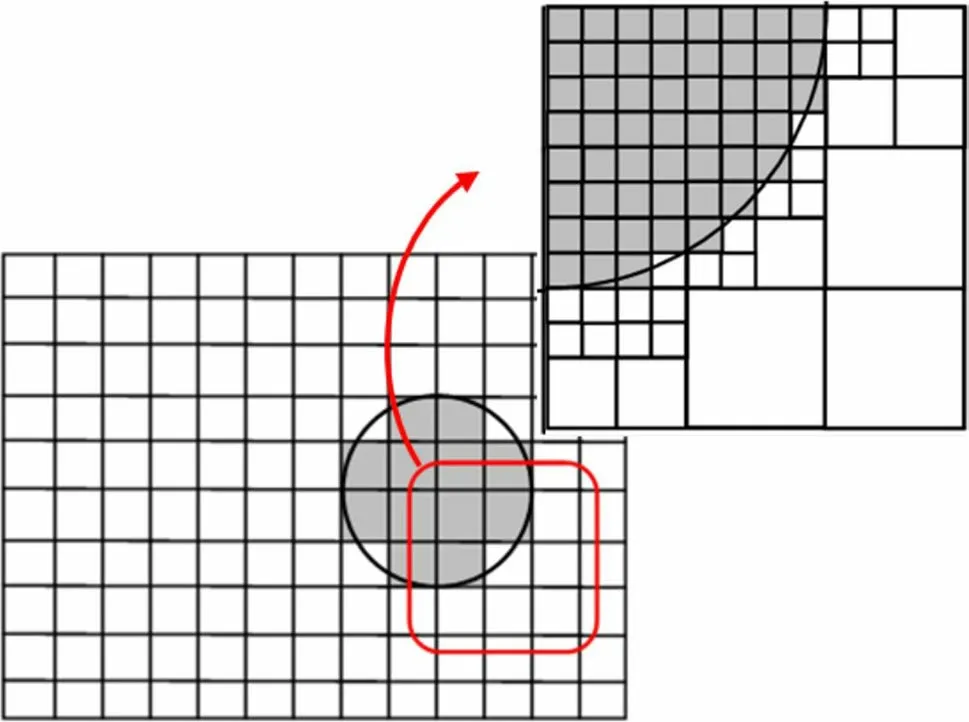
Fig. 4 Resolved CFD-DEM approach
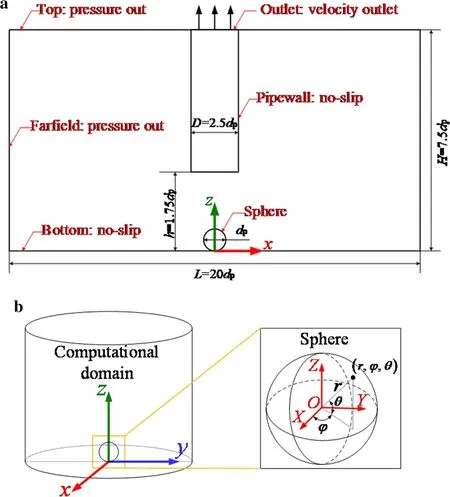
Fig. 5 Computational domain, boundary conditions, and coordinate systems. a (x, z)-plane view of the computational domain and boundary conditions. b The coordinate systems
Following the experimental setup, the computational zone was established and the sphere diameter dpwas set to 4 cm (see Fig. 5a). In the computational zone, no-slip boundary conditions were set along the pipewall and the bottom, pressure-out boundary conditions were set at the top and in the farfield, and velocity outlet conditions were set at the outlet.
Furthermore, a fixed coordinate system (x, y, z) and a moving coordinate system (X, Y, Z) were defined. The origin of the moving coordinate system coincided with the center of the sphere, and the axes of the moving coordinate system were parallel to those of the fixed one. Meanwhile, the origin of the fixed coordinate system was the intersection point of the bottom surface and extended centerline of the vertical pipe. The sphere rotation was described using the (X, Y, Z) coordinate system, and the other motions were described using the (x, y, z) coordinate system.
The sphere density was 2450 kg/m3, and the fluid density and dynamic viscosity were 1000 kg/m3and 0.001 Pa·s, respectively. In this study, the elaborate information about eddies in the flow field was obtained by the delayed detached eddy simulation method [22, 23].
3.2 Modelling and validation
The generation of the computational mesh is as shown in Fig. 6.
The fluid domain around the sphere was simulated on a dynamic mesh with 80 cells in the region enclosed by each diameter. When the sphere moved to a new position, the neighboring mesh was automatically refined; however, the mesh structures in other computational zones remained fixed.
To measure the effect of the mesh on the numerical simulation results, we set the flow velocity to 2 m/s and conducted the numerical simulations at three different grid densities (Ng) . The grid density Ngwas defined as dp∕ΔL , where ΔL is the grid size. In the evaluation, we compared the values of the sphere’s vertical force in each case.
Table 1 presents three cases of the vertical forces computed using grids of different densities (G1, G2, and G3). The difference between the vertical forces reduced as the grid density increased from 60 to 80 and from 80 to 100. The difference between the results of cases G2 and G3 was only ~ 0.5%, meaning that the grid density of G2 marginally affected the simulation results and that mesh independence was reached at the density of G2. Therefore, the final calculations were performed using the grid density of G2.
The initial mesh number and time step in G2 were set to 1,061,947 and 0.0002 s, respectively.
For validation, the results of four numerical cases were compared with those of Zhao’s physical experiments [10]. Zhao et al. [10] measured the vertical forces on a fixed sphere at different average outflow velocities. The numerical and experimental results are compared in Table 2; the errors are less than 6%.
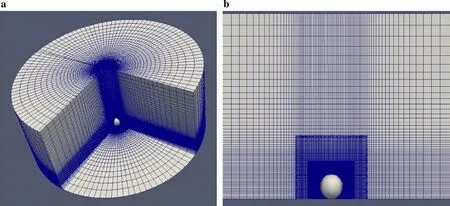
Fig. 6 Cutaway view of the grid structures. a General view. b Grids around the sphere
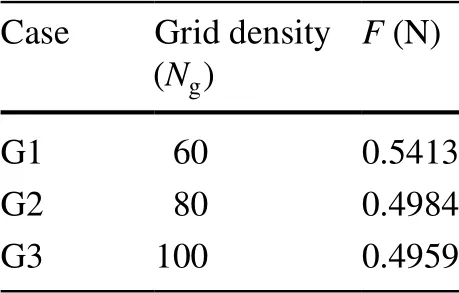
Table 1 Validation of mesh independence of three grids with different densities
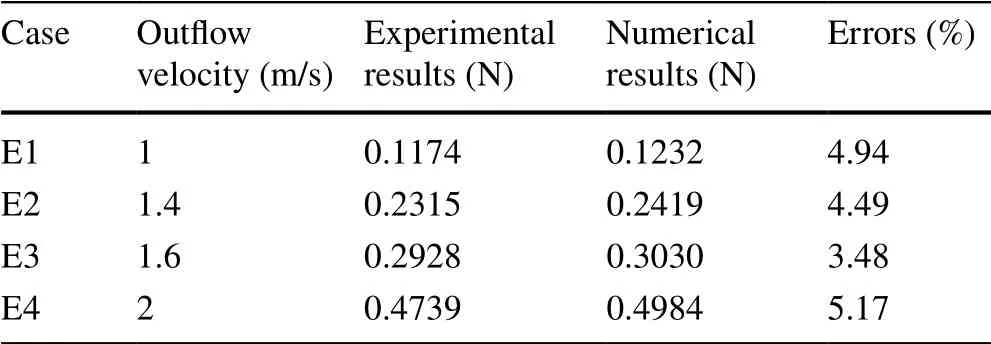
Table 2 Comparison between numerical and experimental results
4 Results and discussion
4.1 Nondimensionalization
To present the computational results in the dimensionless form, the scaling parameters are presented and listed in Table 3.
The pressure coefficient is defined as

where p∞is the pressure of the ambient fluid and U is the outflow velocity. F′, S′, V′, ω′, and t′ denote the dimensionless force, displacement, velocity, angular velocity, and time, respectively.
Consistent with the experiments, the outflow velocity U in the following cases was set to 2 m/s, which is the average flow velocity at the outlet of the pipe under a flow rate of 56.5 m3/h.

Table 3 Dimensionless parameters
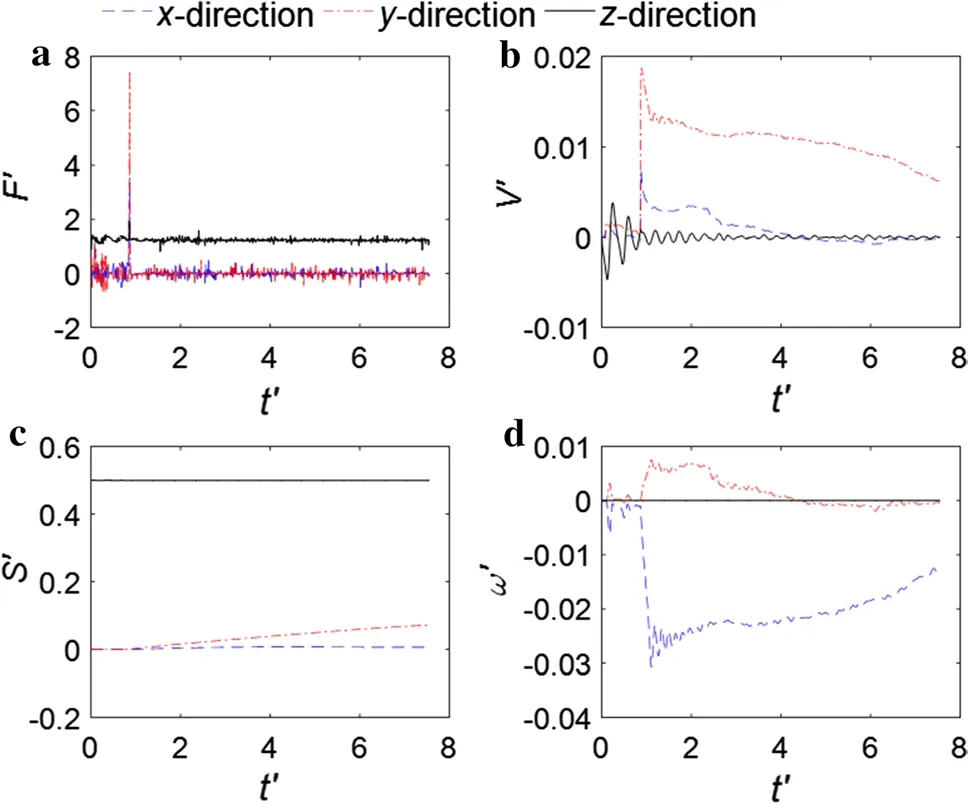
Fig. 7 Time-history curves of the non-dimensional forms of the numerical results. a Hydrodynamic forces. b Translational velocities. c Particle position. d Angular velocities
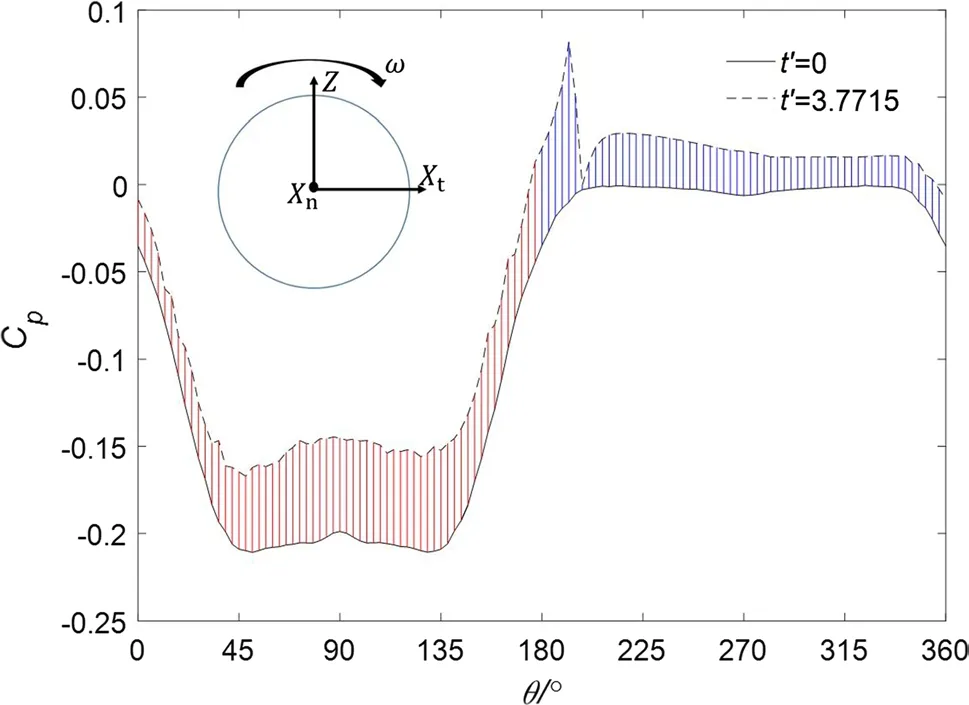
Fig. 8 Distributions of Cp on the sphere surface (in the ( Xt , Z) plane)
4.2 Case 1
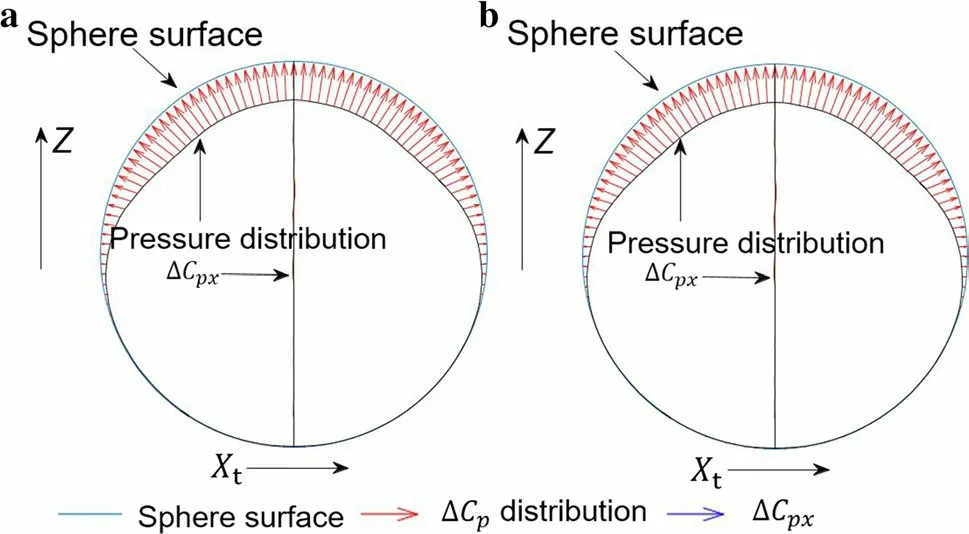
Fig. 9 Sketches of Cp distribution and ΔCpx along the vertical axis of the particle at different times. a t′ = 0. b t′ = 3.7715
In case 1, the sphere was located at (0, 0, 0.02) in the (x, y, z) coordinate system. The flow field was computed in two stages: steady flow followed by flow around a freely moving sphere.
Figure 7 presents the time-history curves of the nondimensional forms of the numerical results. The force fluctuated during the first stage before being damped to a roughly steady value. The time-history curves of the translational velocity V′ and angular velocity ω′ confirm that the position of the sphere over the recorded time tends to be stable. Similar to the case observed in experiments, in this case, lifting the sphere was difficult.
To clarify the description, we defined a new coordinate system ( Xt, Xn, Z), in which the Z axis coincided with that of the (x, y, z) coordinate system and the Xtand Xnaxes were oriented parallel and perpendicular to the angular velocity of the sphere, respectively.
Figure 8 shows the pressure coefficients Cpon the sphere’s surface in the ( Xt, Z)-plane at t′ = 0 and t′ = 3.7715. The pressure coefficients on both the upper and lower halves of the sphere were larger at t′ = 3.7715 than at t′ = 0, signifying a freely moving sphere. The Cpand ΔCpxon the sphere at the two times, derived from the computed data, are plotted in Fig. 9a, b, respectively. The reversal of the Z-axis projection of the pressure on both sides of the sphere caused the rotational motion.
As shown in the streamlines and wake structure in Figs. 10a and 11a, respectively, the flow field was moderately axisymmetric at t′ = 0. Once the sphere was released, its motion greatly disturbed the flow field and a vortex was generated from the top of the sphere to the center of the pipe. Finally, the wake structure became chaotic (see Figs. 10b and 11b). The sphere tended to remain at a certain position during the recorded time, but if the motion changed some flow field parameters, its motion varied as observed in the experiments.
4.3 Case 2
In case 2, the sphere was located at (0, 0.05, 0.02) in the (x, y, z) coordinate system. The flow field was first calculated in the steady state and subsequently around a sphere in free motion at the initial tangent velocity Vx=0.2 m∕s in the (x, y, z) coordinate system.

Fig. 10 Streamlines of the flow (relative to sphere) in the longitudinal section at different times. a t′ = 0. b t′ = 3.7715
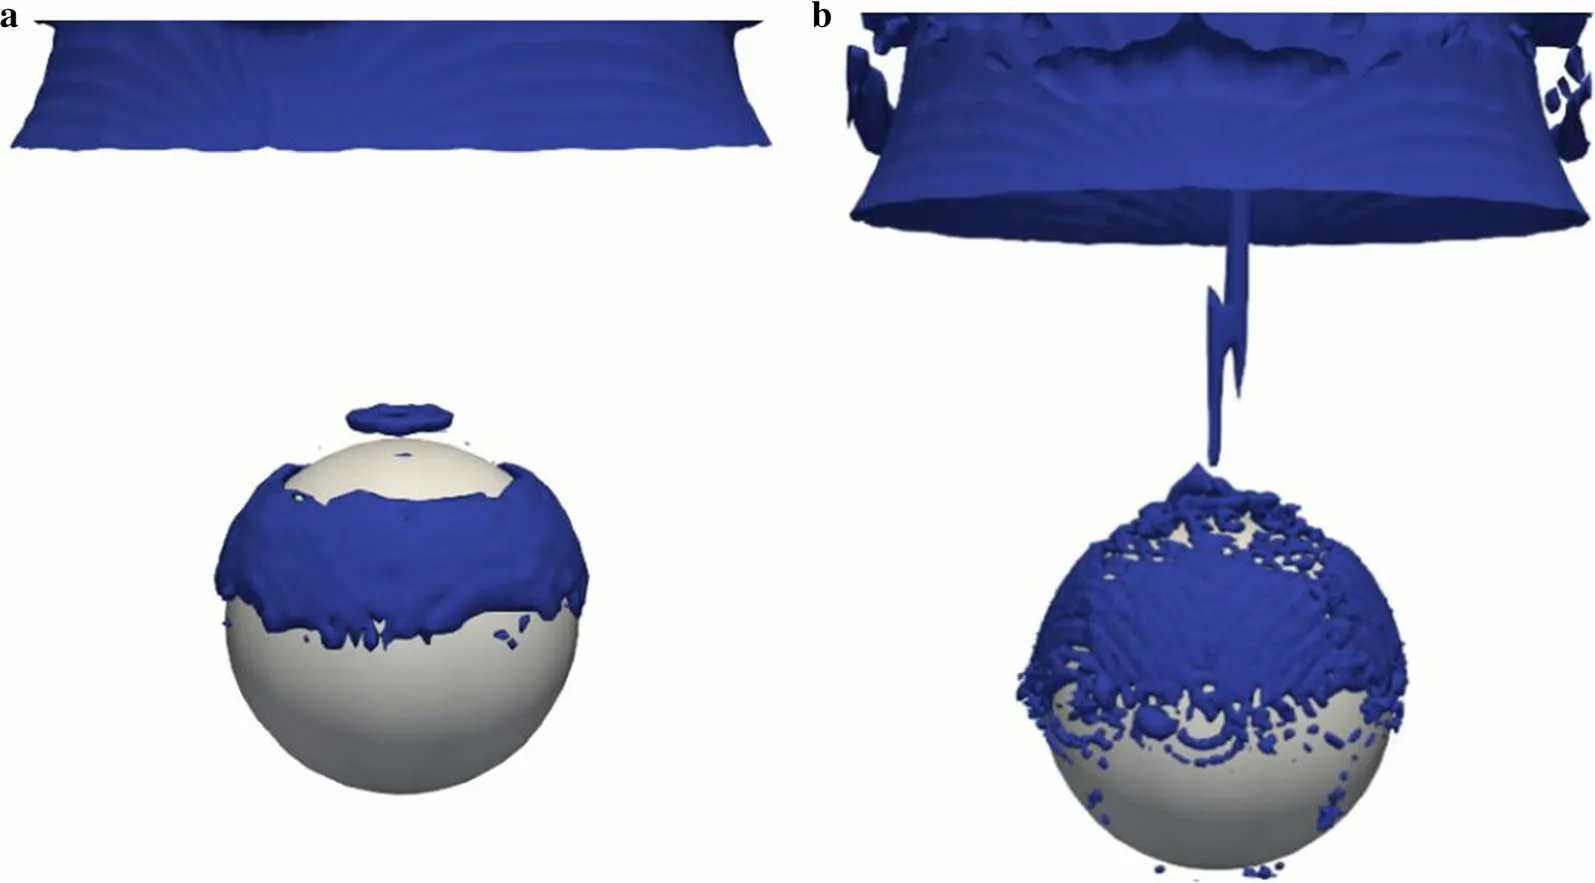
Fig. 11 Wake structure around the sphere, represented by the iso-surface of the Q-criterion (Q =0.5U2∕dp2 ) at different times. a t′ = 0. b t′
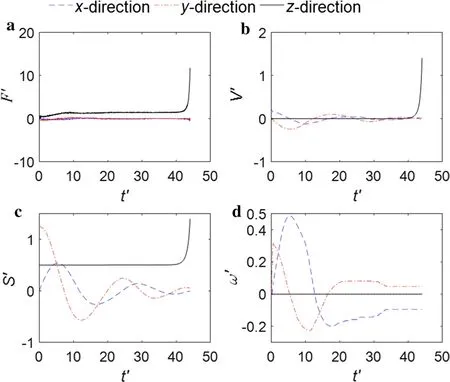
Fig. 12 Time-history curves of the non-dimensional forms of the numerical results. a Hydrodynamic forces. b Translational velocities. c Particle position. d Angular velocities
Figure 12 shows the time-history curves of the simulated non-dimensional variables (forces, velocities, angular velocities, and displacements). The hydrodynamic force along the Z axis increased until it equaled the wet weight of the sphere at t′ = 9, and the sphere floated up and down until it was lifted into the pipe. The other two force components were negligibly small. The fluctuations in F′, S′, V′ and ω′ along the X and Y axes in Fig. 12 were related to the trajectory of the sphere, as shown in Fig. 13.
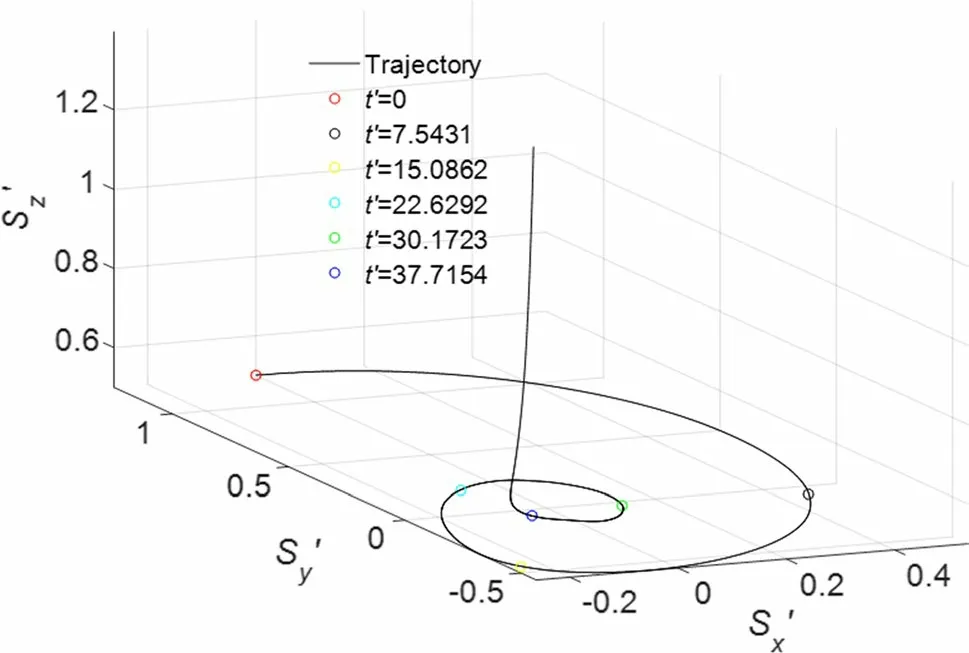
Fig. 13 Trajectory of the sphere
As shown in Fig. 13, the sphere had a spiral-like trajectory and was quickly sucked into the pipe; this is consistent with the experimental phenomena.
The acceleration and rotation of the sphere were much higher in case 2 than in case 1 and exerted a larger influence on the flow field (Figs. 14 and 15). Vortices of different sizes were dispersed over the sphere, and the vortices from the top of the sphere to the pipe induced a negative pressure that coupled with the main stream. When the sphere moved near the centerline of the pipe, it was quickly lifted.
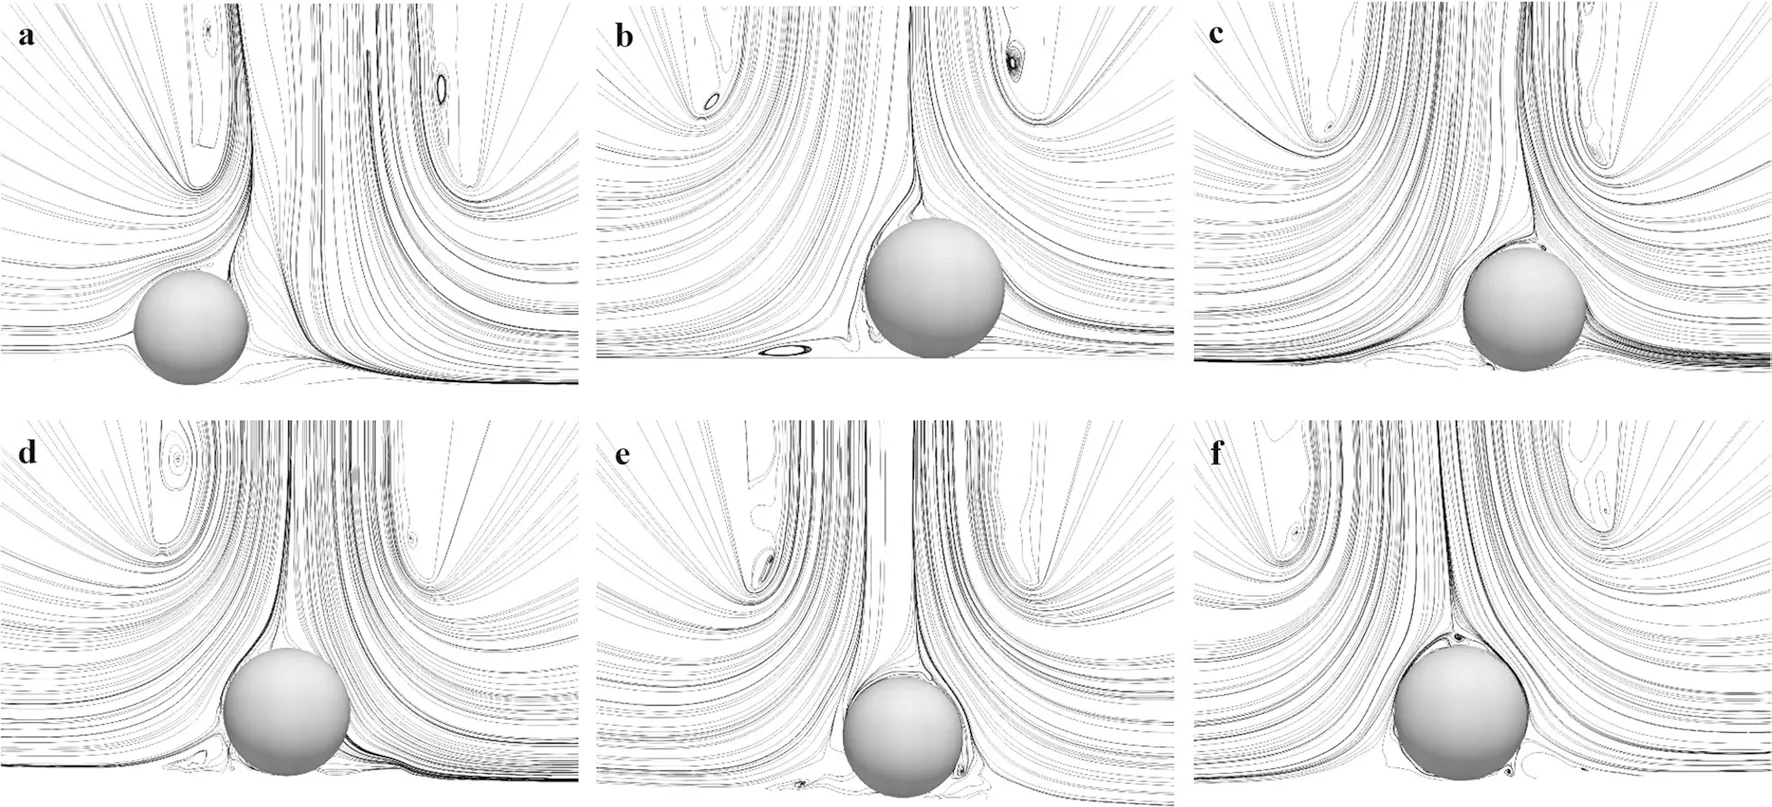
Fig. 14 Streamlines of the flow at different times. a t′ = 0. b t′ = 7.5431. c t′ = 15.0862. d t′ = 22.6292. e t′ = 30.1723. f t′ = 37.7154
The Cp, ΔCpx, and ΔCpzon the sphere at different times, derived from the computed pressure data, are plotted in Fig. 16a-f. When the sphere was moving, the ΔCpxamplitudes computed by horizontally projecting the pressure were larger than those in case 1. The consequent Magnus force induced a large rotational motion and lift force.
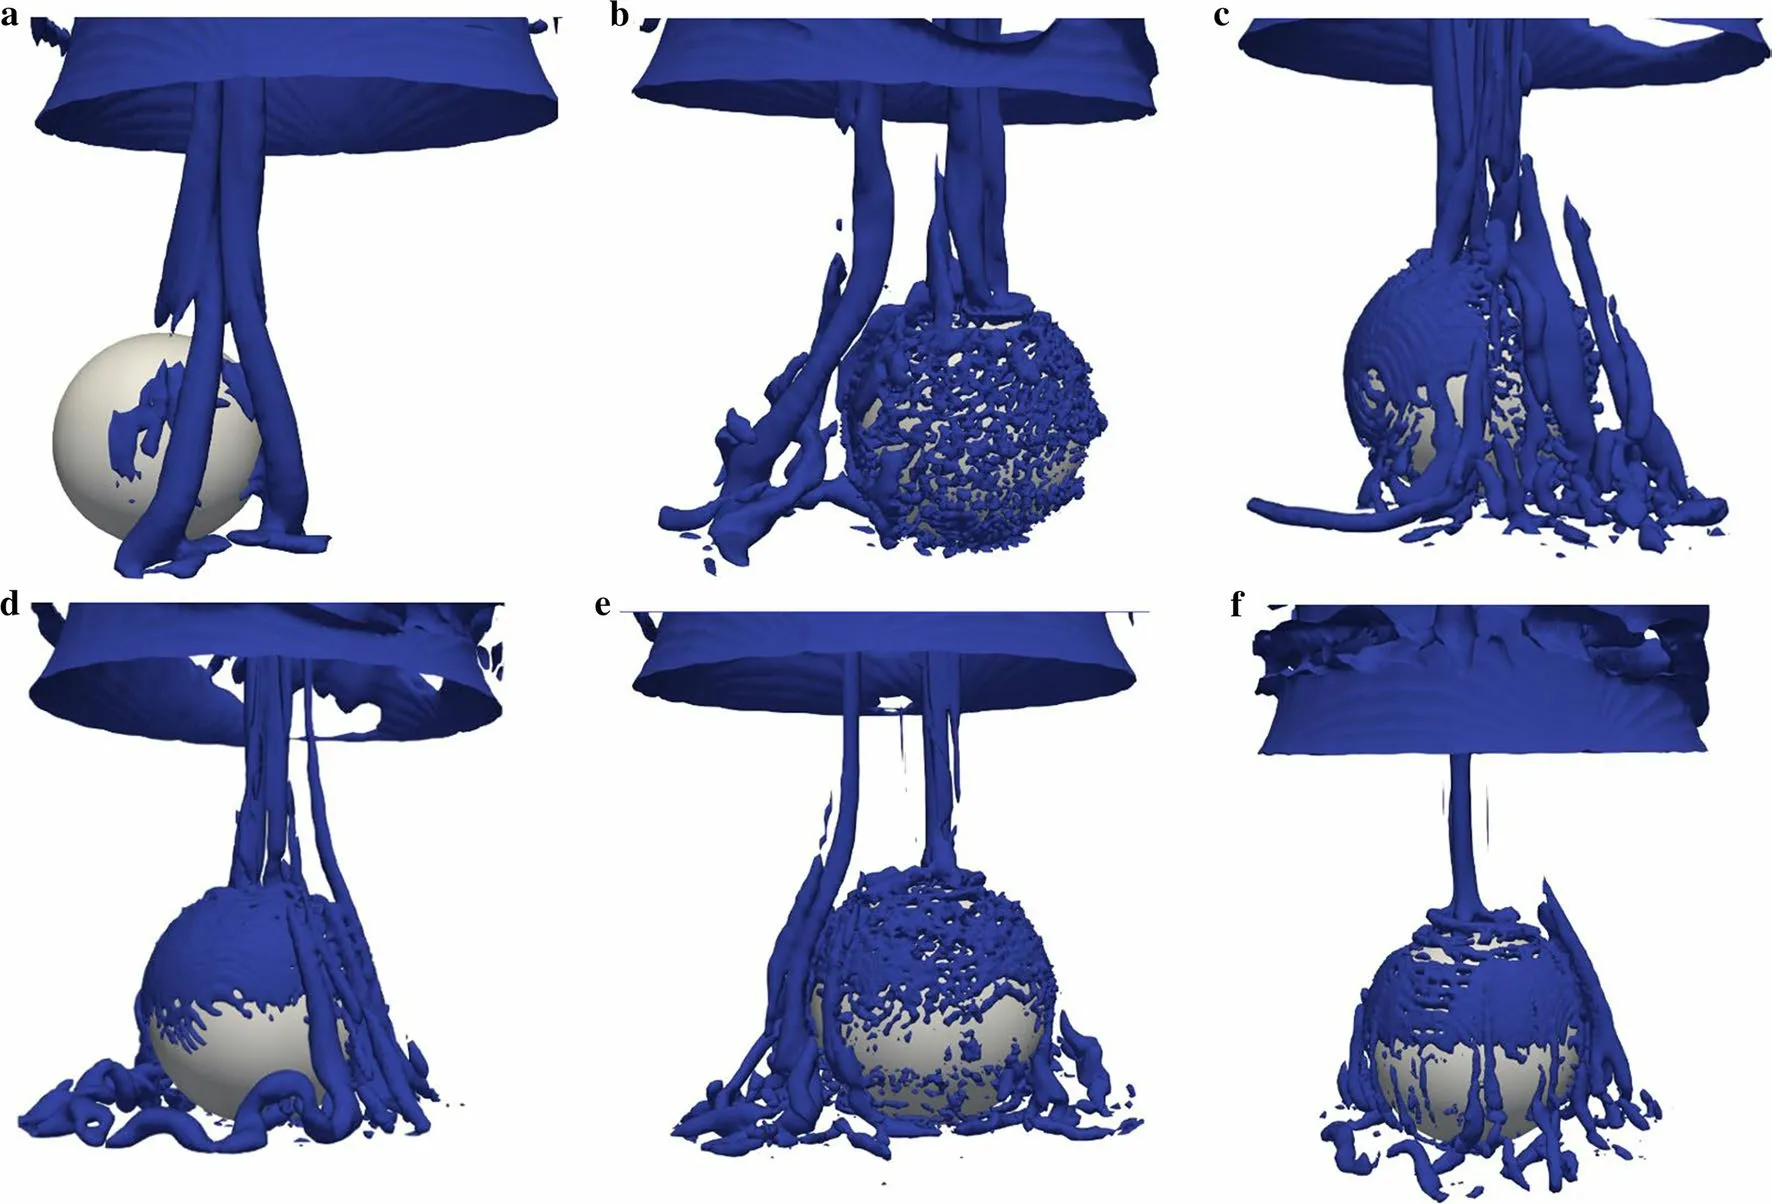
Fig. 15 Wake structure around the sphere, represented by the iso-surface of the Q-criterion ( Q=0.5U2∕d2p ) at different times. a t′ = 0. b t′= 7.5431. c t′= 15.0862. d t′= 22.6292. e t′= 30.1723. f t′= 37.7154
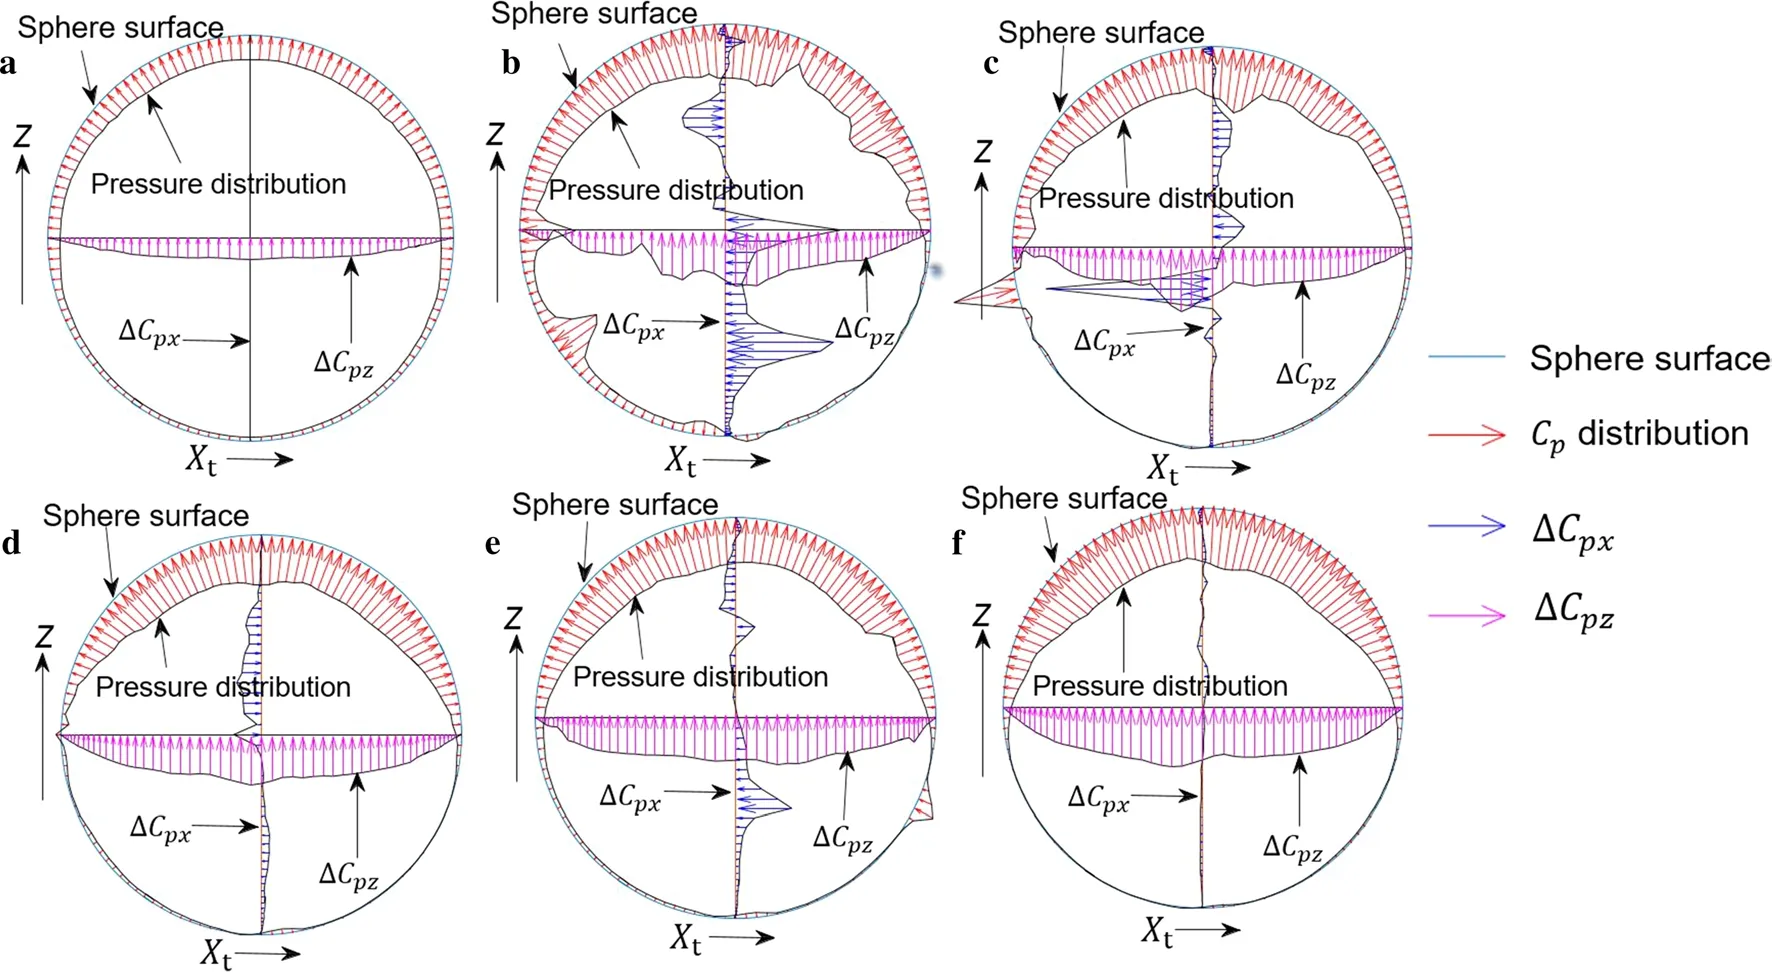
Fig. 16 Sketches of the Cp distribution, ΔCpx along the vertical axis and ΔCpz along the horizontal axis of the particle at different times. a t′ = 0. b t′ = 7.5431. c t′ = 15.0862. d t′ = 22.6292. e t′ = 30.1723. f t′ = 37.7154
5 Conclusi ons
The hydraulic collection of coarse particles has been extensively investigated, but the particle motions and their surrounding flow fields have been rarely reported. To better understand these phenomena, a series of experiments was conducted on a coarse sphere with a radius of 2 cm. For some experimental-parameter combinations, the sphere was almost motionless under the pipe; however, for others, the sphere performed nearly circular motion under the bottom edge of the pipe. In some cases, the circularly moving sphere was quickly sucked into the pipe after a sudden acceleration. The motion tangential to the circle was conjectured to benefit the hydraulic collection. This idea was verified in several experiments in which the sphere was elevated in a spiral-like trajectory.
To completely unveil the motion and particularly the flow field, the CFD-DEM method is adopted in this paper. Two cases mimicking two series of experiments were set up. The flow and motion information, including the forces, displacements, velocities, angular velocities, streamlines, and wake structures, were calculated in the two cases. The phenomena in both cases agreed well with those observed during the experiments. Comparing cases 1 and 2, it was inferred that the vortices around the sphere and their coupling with the main stream were mainly responsible for the extra lift force applied to the sphere.
AcknowledgementsThis work was supported by the Major Science and Technology Program of Hainan Province (Grant ZDKJ2016014) and the National Key R&D Program of China (Grant 2016YFC0304100).
杂志排行
Acta Mechanica Sinica的其它文章
- Geometric and material nonlinearities of sandwich beams under static loads
- Coupled thermoelastic theory and associated variational principles based on decomposition of internal energy
- Transient growth in turbulent particle-laden channel flow
- Experimental and theoretical investigation of the failure behavior of a reinforced concrete target under high-energy penetration
- Revealing the high-frequency attenuation mechanism of polyurea-matrix composites
- Efficient algorithm for 3D bimodulus structures
