Improving the hydrodynamic performance of the SUBOFF bare hull model: a CFD approach
2020-05-06KambizDivsalar
Kambiz Divsalar
Abstract The main aims of this study are to investigate the hydrodynamic performance of an autonomous underwater vehicle (AUV), calculate its hydrodynamic coefficients, and consider the flow characteristics of underwater bodies. In addition, three important parts of the SUBOFF bare hull, namely the main body, nose, and tail, are modified and redesigned to improve its hydrodynamic performance. A three-dimensional (3D) simulation is carried out using the computational fluid dynamics (CFD) method. To simulate turbulence, the k-ω shear stress transport (SST) model is employed, due to its good prediction capability at reasonable computational cost. Considering the effects of the length-to-diameter ratio (LTDR) and the nose and tail shapes on the hydrodynamic coefficients, it is concluded that a hull shape with bullet nose and sharp tail with LTDR equal to 7.14 performs better than the SUBOFF model. The final proposed model shows lower drag by about 14.9% at u = 1.5 m·s-1. Moreover, it produces 8 times more lift than the SUBOFF model at u = 6.1 m·s-1. These effects are due to the attachment of the fluid flow at the tail area of the hull, which weakens the wake region.
Keywords Autonomous underwater vehicle · Computational fluid dynamics · Hydrodynamic performance · Drag · Turbulence model · Hull shape
List of symbols
F Body force
D Diameter
y+Dimensionless wall distance
CDDrag coefficient
ρ Fluid density
giGravitational acceleration
δijKronecker delta
L Length
LTDR Length-to-diameter ratio
CLLift coefficient
LmMain body length
LnNose length
CMPitching moment coefficient
P Pressure
CPPressure coefficient
Re Reynolds number
τijReynolds stress tensor
ω Specific rate of dissipation
LtTail length
k Turbulent kinetic energy
u Velocity
μ Viscosity
1 Introduction
Autonomous underwater vehicles (AUVs) have broad scope for use in both military and civilian applications [1, 2]. An AUV is a versatile research tool for maritime archeology, defense applications, oil and mineral exploration, marine biology, and exploitation programs. The rapid progress in AUV development is steadily increasing the reliability and endurance of such vehicles for operation in the harsh marine environment. Much work, however, still needs to be done in terms of optimizing their hull design to minimize drag and increase propulsion efficiency [3]. In previous studies, designers employed empirical formulas or experimental data to estimate the drag force of ships or submerged bodies such as AUVs [4]. The hull shape of an AUV influences its hydrodynamic characteristics. The hydrodynamic characteristics of an AUV can be obtained numerically and experimentally. Experimental studies are expensive and tedious, entailing fabrication of a prototype, calibration, availability of test facilities, experimental setup, etc. On the other hand, numerical simulations do not suffer from these drawbacks and represent a proven alternative to experimental studies [5]. Nevertheless, an effective model, appropriate boundary conditions, and the selection of a correct mesh size are required to achieve good results [6]. Computational fluid dynamics (CFD) is now widely applied for generating solutions to fluid flows in many problems [7-9] as well as analyzing the hydrodynamic performance of AUVs with the development of computer technology.
Most research in this area is based on the Reynolds-averaged Navier-Stokes (RANS) formulation, because it can treat viscous effects much better than potential flow theory but requires less computational resources than the large-eddy simulation (LES) approach [10]. Many studies have been done over the past few decades on predicting the forces and moments on the surface and submerged vehicles due to waves. Linear wave theory and slender body theory, for example, were used by Willy [11] to predict the force and moments on a stationary AUV due to waves. Strip theory can also be used to determine the response of a streamlined AUV when subjected to waves, as described by Milgram [9, 12]. Meanwhile, Jagadeesh and Murali [13] and Jagadeesh et al. [14] used the RANS equations to study the surface influence on the hydrodynamic coefficients of an axisymmetric underwater body, comparing the numerical results with experimental data obtained in a towing tank. However, their AUV geometry lacked any control surfaces, so they could use a relatively small number of mesh elements to obtain the results. The drag performance of seven representative revolution bodies scaled to the same volume was compared by Stevenson et al. [15], who found that a laminar flow body form could be more efficient than a torpedo form. A comparison among four hull forms was carried out by Sarkar et al. [16], who found that two of them showed better drag performance compared with the other two. The drag performance of five shapes at different velocities was investigated by Wei et al. [17], who concluded that two were more adaptable to higher speeds and three to lower speeds. The effect of the free surface on the drag and lift coefficients of an AUV was studied by Mansoorzadeh and Javanmard [18], who concluded that the variation of the drag and lift coefficients of the AUV with its submergence depth was sensitive to its speed. Some related work was also carried out by Yamamoto [19] and Nouri et al. [20], although their achievements are not totally applicable in other cases. In the study of Wang et al. [21], the impacts of appendage size and position on vehicle drag were investigated using the CFD method. Their results demonstrated that appendages increase drag more because of their impact on the development of turbulence.
Despite the above-mentioned studies, in the case of the hydrodynamic performance of AUV hulls, numerical investigations have rarely been carried out to change the shape of the SUBOFF bare hull model and thereby improve its hydrodynamic performance and flow characteristics. For this purpose, three important parts of the SUBOFF bare hull, namely the main body, nose, and tail, are modified and redesigned herein. The proposed hull shapes are intended to reduce drag and increase lift forces compared with the SUBOFF model. Furthermore, all stages of the study, including hydrodynamic analysis, simulation, evaluation, and comparison of different hull shapes and inlet velocities, are presented in detail. The results of this study will be useful for AUV designers to obtain an optimum hull shape when focusing on achieving a higher lift-to-drag ratio as well as optimum length-to-diameter ratio.
2 Model description
The SUBOFF project was developed by the Submarine Technology Program Office of the Defense Advanced Research Projects Agency to evaluate various flow field predictions for an axisymmetric hull, both with and without appendages [22]. The project was intended to compare the predictions with model experimental data and to develop methods that could be used in the design of future advanced submarines [23]. The SUBOFF hull profile is modeled to verify the accuracy of CFD simulations. The main dimensions of the SUBOFF model [22] and a three-dimensional view of SUBOFF bare hull model are illustrated in Fig. 1a and b, respectively. The total length (L) of the SUBOFF model is 4356 mm, while its diameter (D) is 508 mm.
In the present study, three important parts of the SUBOFF bare hull, namely the main body, nose, and tail, are redesigned based on the shape of the SUBOFF bare hull model. First, the main body length and diameter are modified to consider the length-to-diameter ratio; the geometrical dimensions of the SUBOFF and proposed models are presented in Table 1 and Fig. 2. Note that the main body length (Lm) and the diameter of the hull shapes are modified such that the volume of all the models remains constant. Moreover, the nose length (Ln) and tail length (Lt) are not changed. Then, the nose of the SUBOFF model is modified to consider the effect of the nose on its performance, while the other parts including the main body and tail are kept constant. Three different nose models are considered, i.e., a conic nose, hemisphere nose, and bullet nose; the geometrical dimensions of the SUBOFF and proposed models are presented in Fig. 3. Finally, three different tail models are proposed and designed based on the SUBOFF model, namely a conic tail, sharp tail, and hemisphere tail. All the tail models have equal shape and dimensions for the nose and main body. The geometrical dimensions of these proposed models for the tail are presented in Fig. 4. Moreover, the geometrical dimensions of the final proposed model are presented in Table 2 and Fig. 5.
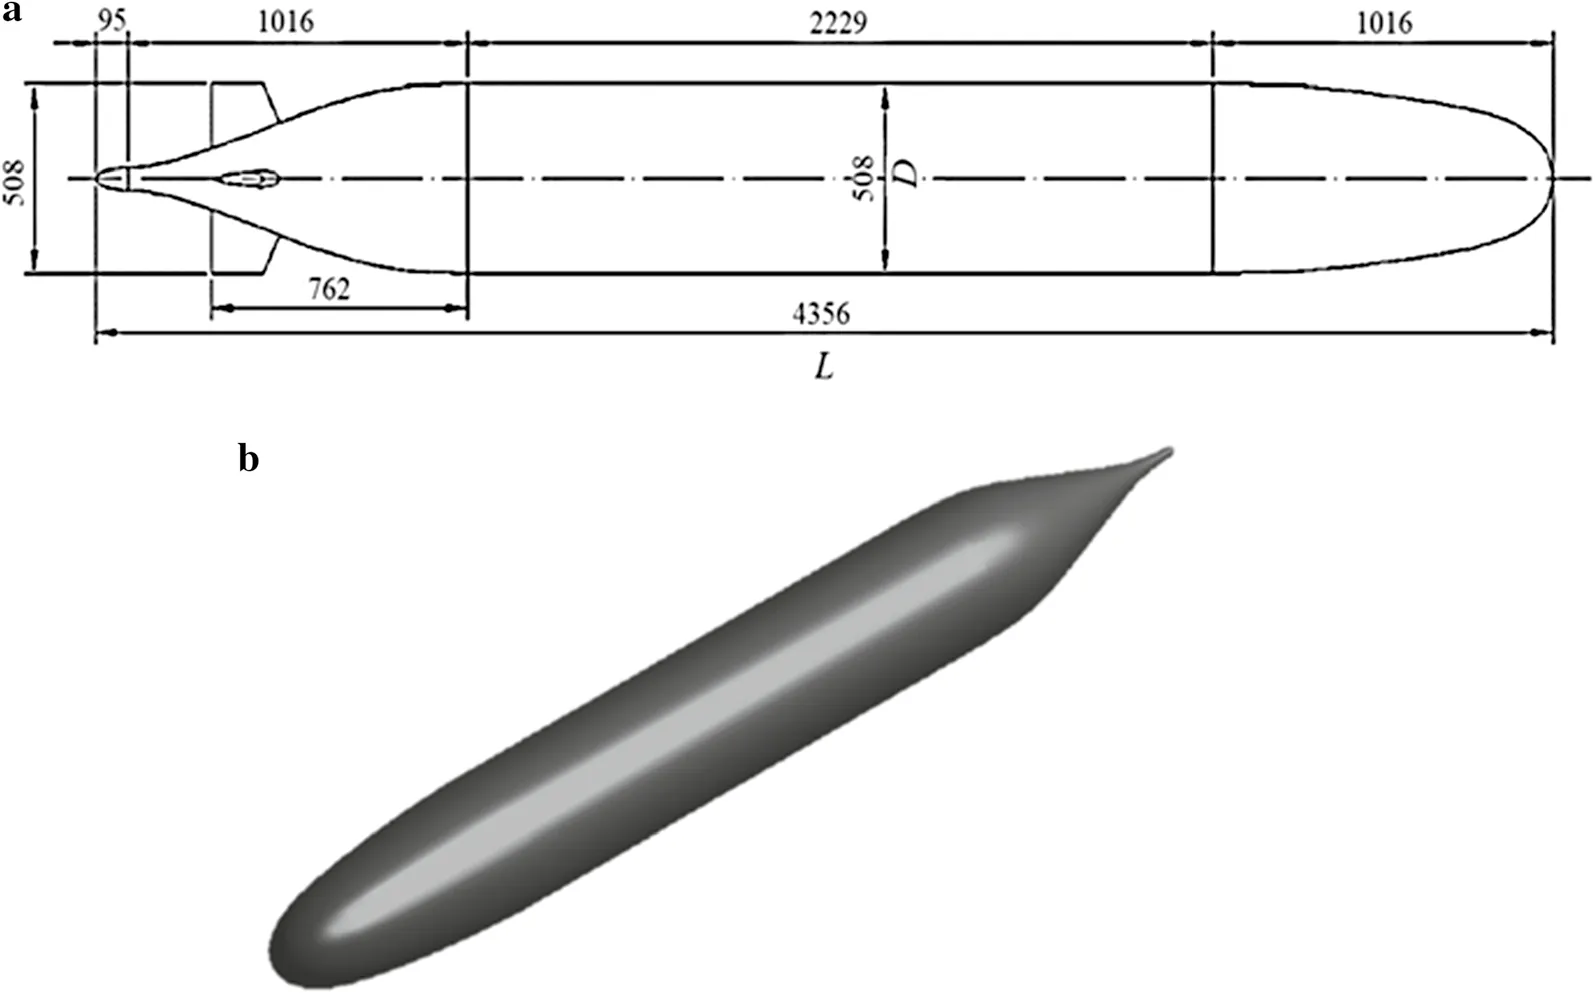
Fig. 1 a Main dimensions (mm) of DARPA SUBOFF model [24]. b Three-dimensional view of SUBOFF bare hull model

Table 1 Geometrical dimensions of proposed models
3 Governing equations and numerical method
Numerical simulation is performed using the commercial CFD code Fluent, based on the finite volume, viscous, and incompressible steady RANS equations. The equations governing the conservation of mass in each principal direction can be written as [25]

where ρ is the fluid density and uiis the velocity component in each of the principal directions ( x , y , z ). In addition, the equations for conservation of momentum in the principal directions can be written as

where Fiand girepresent body forces and gravitational acceleration and τijis the Reynolds stress tensor, defined as

where δijis the Kronecker delta, which is unity when i and j are equivalent and zero otherwise.
In addition, to stimulate turbulence, the k-ω shear stress transport (SST) model is employed, due to its good prediction capability at reasonable computational cost, as recommended by many previous studies [24, 26-28]. The transport equations for the SST k-ω model are expressed as [29]
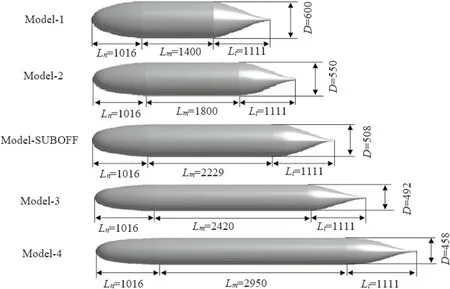
Fig. 2 Main dimensions (mm) of all hull shapes
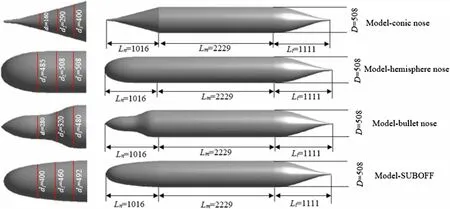
Fig. 3 Main dimensions (mm) of different nose models

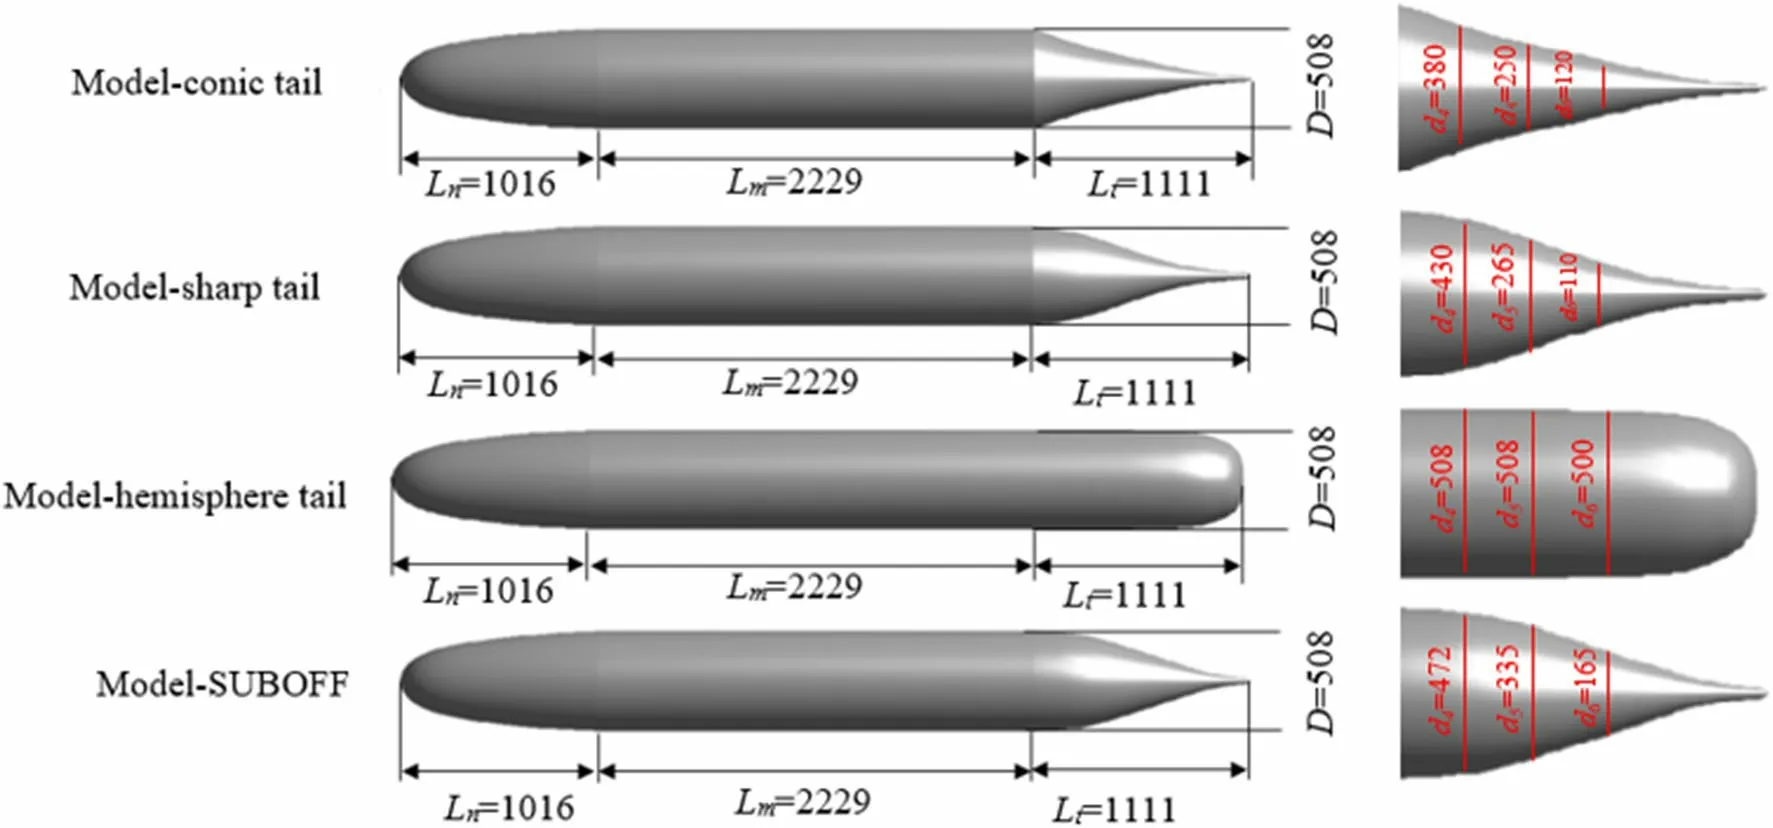
Fig. 4 Main dimensions (mm) of different tail models

Table 2 Geometrical dimensions of final proposed model
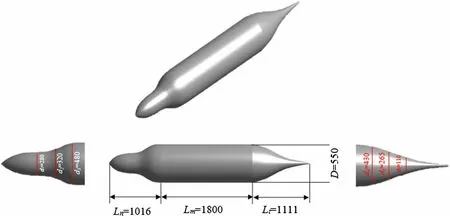
Fig. 5 Main dimensions (mm) of the final proposed model
The working fluid in the domain is water at 18 °C, with ρ = 998.55 kg/m3and= 1.053 g·m-1·s-1. Furthermore, the semiimplicit method for pressure-linked equations (SIMPLE) algorithm is used for pressure-velocity coupling while the upwind second-order method is employed to discretize the governing equations. The absolute conversion criteria for the residuals of the equations were set to 10-6to obtain results with acceptable accuracy. The average y+value, which is the nondimensional normal distance to the hull surface from the first grid, is approximately 30. y+is defined as [25]

where y is the normal distance from the wall, ρ is the fluid density,is the viscosity, utis the friction velocity defined as
4 Computational domain and boundary conditions

and τpis the wall shear stress.
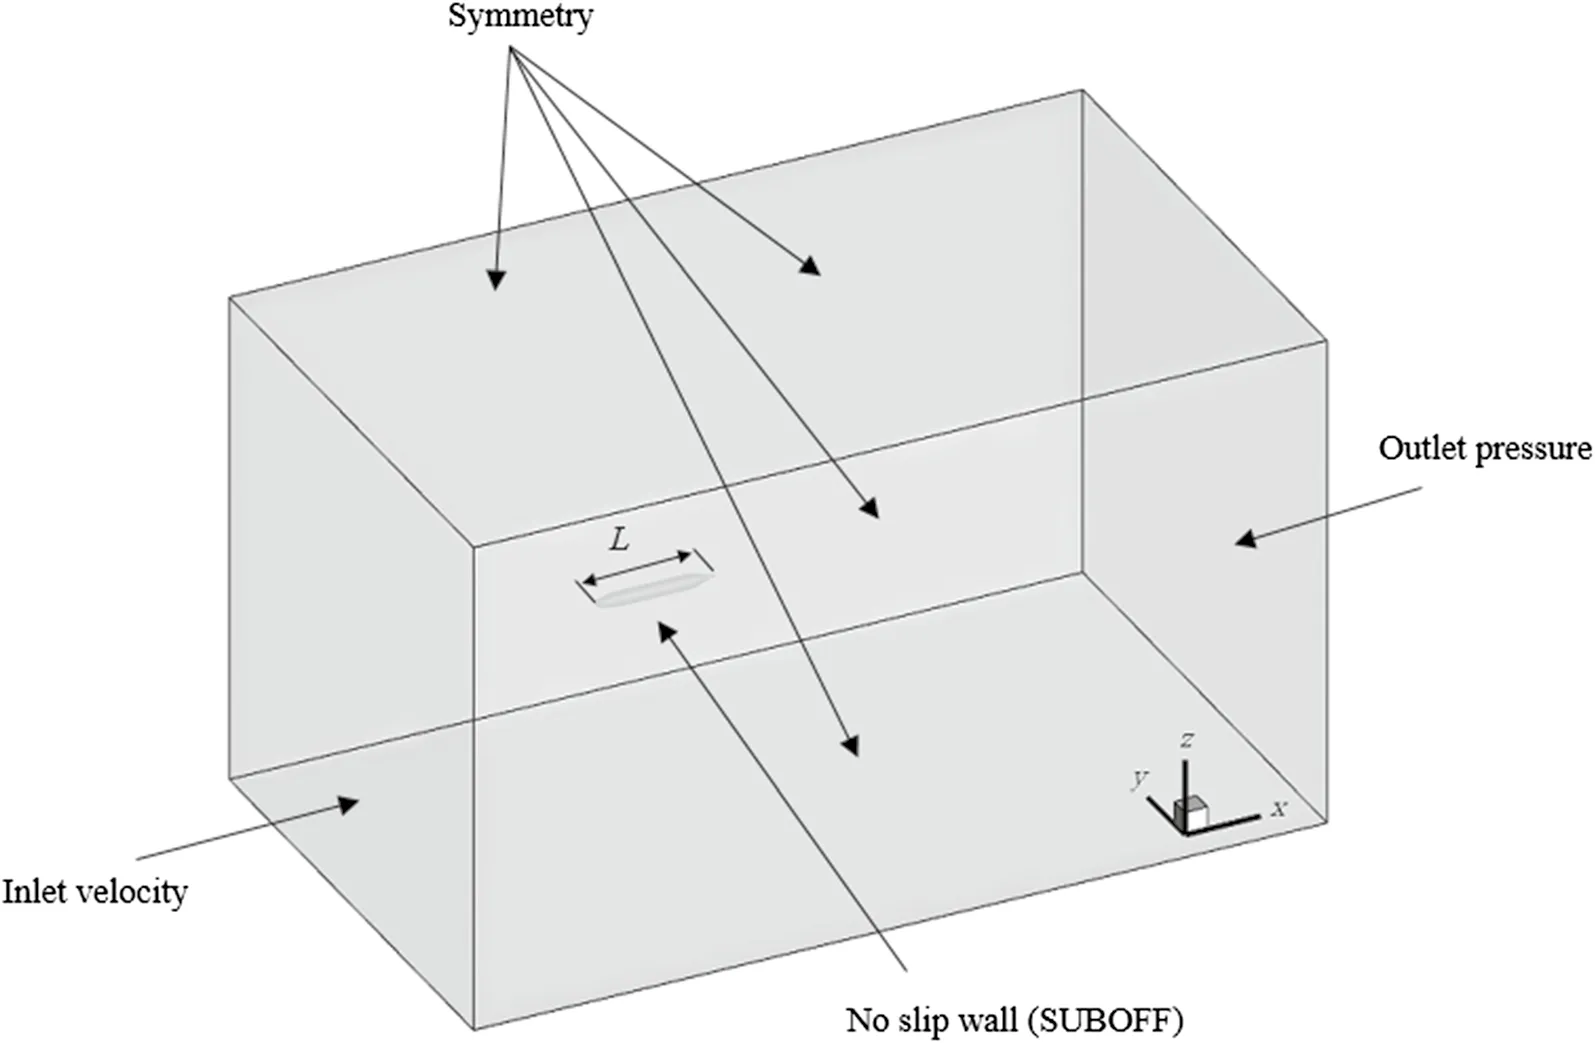
Fig. 6 Three-dimensional computational domain and boundary conditions
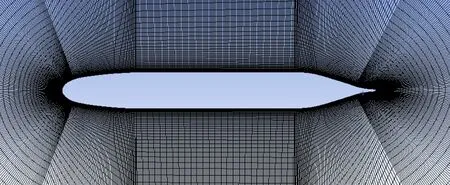
Fig. 7 Computational grids for SUBOFF model
In the present study, a three-dimensional computational domain is defined as a cube around the SUBOFF hull as shown in Fig. 6. The computational domain is considered large enough to avoid external effects such as reversed flows and induced pressure on the performance of the hull. In addition, a hexahedral mesh is used to discrete the computational domain (Fig. 7). The inlet velocity is defined on the inlet boundary, which is located 2L upstream, while the outlet pressure condition is defined 4L downstream. No-slip boundary conditions are applied on the hull, while symmetry boundary conditions are applied on the lateral walls on the four faces of the computational domain, which are located 2L away from the hull. These positions are selected after considering the effect of the computational domain size on the accuracy of the results.
Three different computational domains are generated to consider the pressure coefficient (CP) in a domain extent independence test, as shown in Fig. 8. This test is carried out with the SUBOFF model at Re = 14 × 106. It is concluded that the SUBOFF model should be located 2L upstream, 4L downstream, and 2L away from the lateral walls in order to be independent of the size of the computational domain.
The definition of the pressure coefficient is as follows:

where P represents the total pressure and U is the velocity.
5 Grid independence study
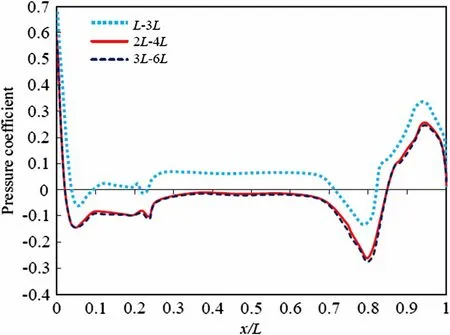
Fig. 8 Domain extent independence test
For the grid independence study, four different grids are generated to compute the drag of the SUBOFF model. Four different grids with cell numbers of 1,121,487, 2,019,171, 3,064,513, and 4,117,882 are generated for the computational domain to consider grid independence. A comparison of the drag calculated using the four different grids is presented in Table 3. Considering the results of this grid independence study, the grid with 3,103,942 cells is considered suitable for the present simulation to ensure the accuracy of the results at reduced computational cost.
The definition of the drag coefficient is as follows:

where D represents the total drag and S and U are the surface area of the hull and the velocity, respectively.
6 Validation
In the present study, the computational results for the drag obtained from the CFD simulation are compared at Re = 14 × 106to ensure their consistency with the available experimental results of Liu and Huang [30] and numerical results of Gao et al. [24] and Wu et al. [27], as presented in Table 4. Furthermore, Fig. 9 shows a comparison between the present computational results and the experimental results of Liu and Huang [30] and numerical results of Wang et al. [21] at various speeds of 1.50, 2.57, 3.05, 5.14, and 6.10 m·s-1. Figure 10 compares the values of the pressure coefficient (Cp) along the SUBOFF model length in the x-direction (x/L) at Re = 14 × 106with the experimental results of Liu and Huang [30] and numerical results of Sakhtivel et al. [31], Alin et al. [32], and Manshadi et al. [33], revealing fairly good agreement. Therefore, the numerical solving procedure and applied turbulent model have acceptable accuracy.

Table 4 Comparison of present computational results versus experimental and numerical values from recent studies for the SUBOFF model at Re = 14 × 106

Table 3 Grid independence study
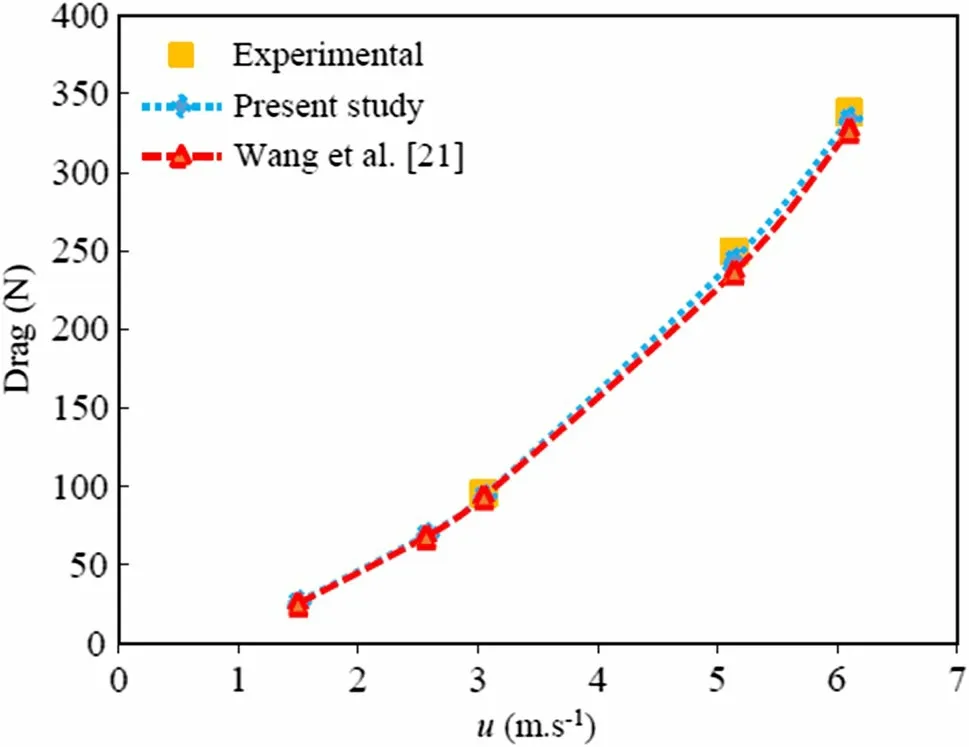
Fig. 9 Comparison of drag values of the present study versus the numerical results of Wang et al. [21] and experimental results of Liu and Huang [30]
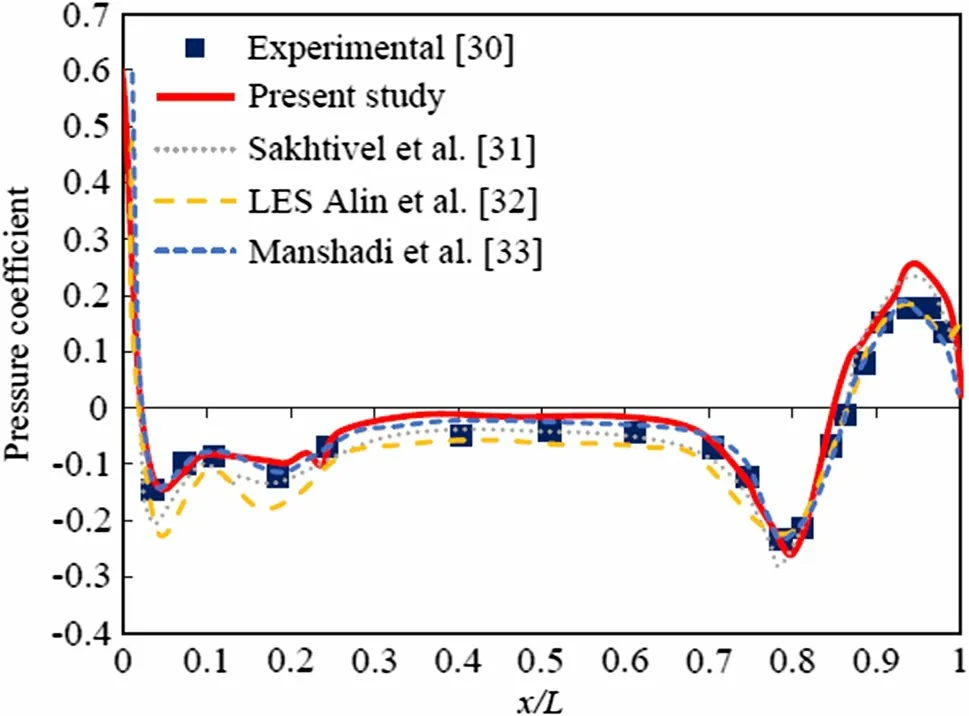
Fig. 10 Comparison of pressure coefficient (CP) along along SUBOFF model at Re = 14 × 106
7 Results and discussion
7.1 Effect of LTDR on hydrodynamic performance
A comparison between the drag (N) values obtained for the different models when changing the LTDR is presented in Table 5, at various velocities of 1.5, 2.57, 3.05, 5.14, and 6.1 m·s-1. The reason for choosing these velocities is the presence of valid experimental and numerical results from previous studies [21, 24, 27, 30].
The length-to-diameter ratio of the base SUBOFF model is 8.57, while the length-to-diameter ratio of the proposed hull shapes is 5.88, 7.14, 9.24, and 11.08, being chosen in a wide range according to the previous study of Moonesun et al. [34], who reported that the optimum range for the LTDR of cylindrical middle body submarines was 7-10. From this table, note that the drag values increase with any increase of velocity for all models. It is concluded that there is an optimum range for the LTDR, which in our simulation is calculated to be between 6.95 and 8.75. As mentioned above, the total length and diameter of the hull shapes are modified such that their volume remains constant. The minimum drag values are obtained for model 2 at all velocities. The drag value is obtained as 22.53 N, which is 13.74% lower than the drag value of the SUBOFF model at u = 1.5 m·s-1. On the other hand, the maximum drag values are obtained for model 4 at all velocities. The drag value is obtained as 46.49 N, which is 79.7% higher than the drag value of the SUBOFF model at u = 1.5 m·s-1.
7.2 Effect of nose shape on hydrodynamic performance
The effect of the different models of nose on the drag (N) values is presented in Table 6. Three different nose models, namely a conic nose, hemisphere nose, and bullet nose, are designed and compared with the SUBOFF model. In these models, the nose length, main body length, tail length, and hull diameter remain unchanged while only the shape of the nose is modified. It is clear that use of a bullet nose or conic nose slightly decreases the drag value, from 334.08 to 330.72 N and 332.13 N at u = 6.1 m·s-1, respectively. The maximum reduction of drag is 10%, being obtained for the model with the bullet nose. On the other hand, the maximum drag values are obtained for the hemisphere nose at all velocities.

Table 5 Comparison between drag (N) values of different models

Table 6 Effect of nose shape on drag value

Table 7 Effect of tail shape on drag value
7.3 Effect of tail shape on hydrodynamic performance
The effect of the different models of tail on the drag (N) values is presented in Table 7. The hydrodynamic performance of an underwater body is sensitive to the shape of tail because of the wake region that forms in the tail area of the hull shape. Three different tail models, namely a conic tail, sharp tail, and hemisphere tail, are designed and compared with the SUBOFF model. Only the shape of the tail is changed, while the other parts of the hull remain unchanged. The model with the hemisphere tail showed a significant increase in drag by about 16.9% at u = 6.1 m·s-1. On the other hand, the models with the conic tail and sharp tail showed slightly reduced drag. Another interesting observation is that the effect of the tail design on the drag becomes more significant at higher velocities.
7.4 Hydrodynamic performance of final proposed model
In Fig. 11, the drag values (N) for the final proposed model are compared with those of the SUBOFF model, considered as the base model. The final proposed model has a bullet nose, sharp tail, and lower length-to-diameter ratio. As can be seen from this figure, the drag values of the final proposed model are lower at all velocities. At a velocity of 1.5 m s-1, the drag is decreased by about 14.9% compared with the SUBOFF model. These results show that the final proposed model performs better than the SUBOFF model. As shown in Fig. 12, the maximum values of the drag coefficient are predicted at a velocity of 6.1 m·s-1. In fact, the drag coefficient increases with increasing velocity. From this figure, it can be concluded that the final proposed model exhibits the lowest values of the drag coefficient compared with the SUBOFF model at all velocities. The value of the drag coefficient is calculated to be 0.0193, which is about 6.8% lower than the value for the SUBOFF model at u = 1.5 m·s-1.
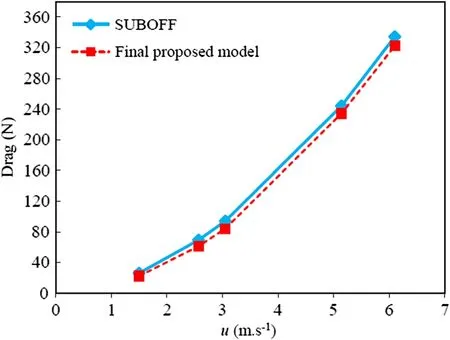
Fig. 11 Comparison of drag values (N) of final proposed model versus SUBOFF model
Figure 13 shows a comparison between the lift values (N) of the final proposed model and the SUBOFF model. Based on the results presented in this figure, the lift values for both models varied with the velocity, gradually increasing, and with a greater slope for the final proposed model. The maximum increment of lift is obtained at u = 6.1 m s-1for the final proposed model, where it is 8 times larger than that for the SUBOFF model. A similar prediction but for the lift coefficient values is presented in Fig. 14. The lift coefficient is defined as
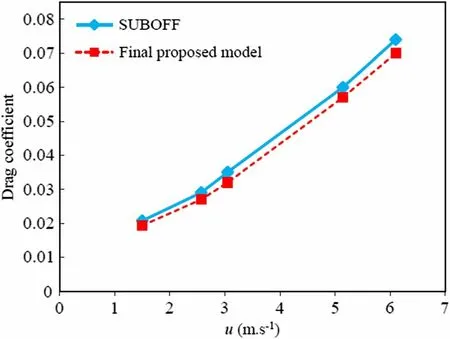
Fig. 12 Comparison of drag coefficient values of final proposed model versus SUBOFF model
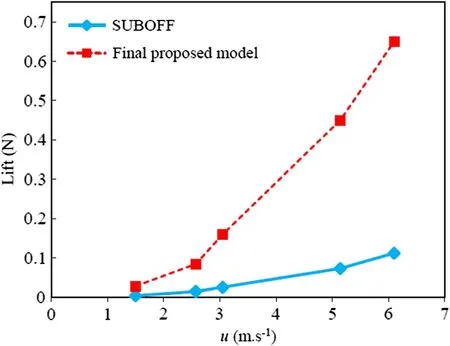
Fig. 13 Comparison of lift values (N) of final proposed model versus SUBOFF model

where L represents the total lift. The highest lift coefficient values are obtained for the final proposed model and the lowest for the SUBOFF model.
Figure 15 shows a comparison between the pitching moment coefficient of the final proposed model and SUBOFF model. The pitching moment coefficient is defined as

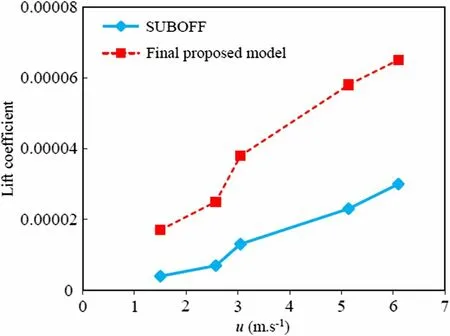
Fig. 14 Comparison of lift coefficient values of final proposed model versus SUBOFF model
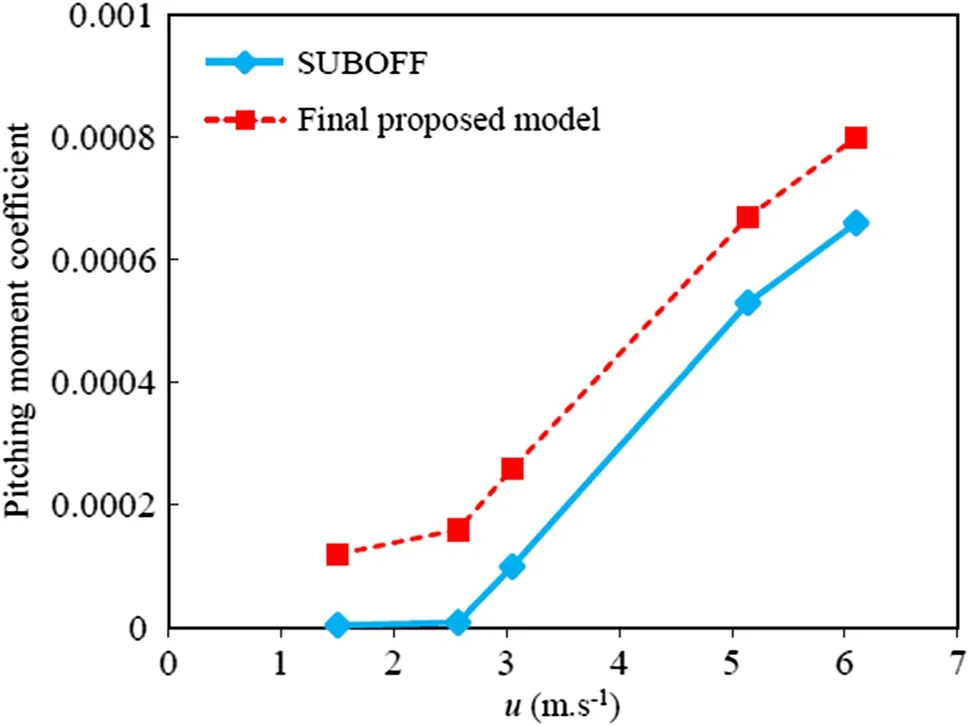
Fig. 15 Comparison of pitching moment coefficient values of the two hull shapes
where M represents the total pitching moment. Positive values of the pitching moment coefficient are found for both models at all considered velocities. The final proposed model shows a higher pitching moment coefficient. On the other hand, the pitching moment coefficient increases with increasing velocity. The maximum pitching moment coefficient is obtained for the final proposed model at a velocity of 6.1 m·s-1, being 21.2% higher than the pitching moment coefficient of the SUBOFF model calculated at the same velocity.
A comparison between the lift-to-drag ratios of the final proposed model and SUBOFF model is presented in Table 8, at various velocities of 1.5, 2.57, 3.05, 5.14, and 6.1 m·s-1. Higher lift-to-drag ratio is desirable for a glider [35]. As can be seen from this table, the maximum lift-to-drag ratios are obtained for the final proposed model at all velocities. It is clear that the lift-to-drag ratio increases with increasing velocity because of the greater increment of lift with any increase of velocity.

Table 8 Comparison between lift-to-drag ratios of the two hull shapes
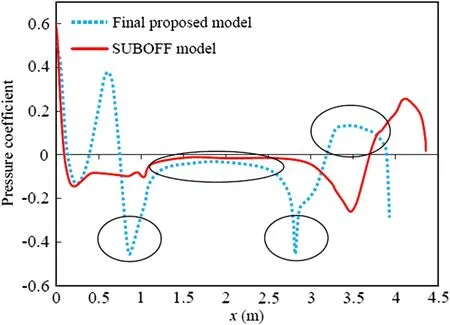
Fig. 16 Comparison of pressure distribution along SUBOFF and final proposed models at Re = 14 × 106
Figure 16 shows a comparison of the pressure distribution along the SUBOFF and final proposed models at Re = 14 × 106. It is clear that the SUBOFF model is longer than the final proposed model. In this figure, four different zones are highlighted to compare the changes in the pressure distribution of the final proposed model and SUBOFF model. These zones show that the pressure is reduced for the final proposed model compared with the SUBOFF model, especially after the nose, tail, and along the main body of the proposed hull shape. Moreover, it is obvious that using a sharp tail instead of the SUBOFF tail decreases the pressure and positively affects the probability of flow separation on the tail.
Figures 17 and 18 show the velocity contours for the SUBOFF model and final proposed model calculated at u = 1.5 m·s-1and u = 6.1 m·s-1, where u is the underwater vehicle velocity. Moreover, the pressure contours for the SUBOFF model and final proposed model calculated at u = 1.5 m·s-1and u = 6.1 m·s-1are illustrated in Figs. 19 and 20. The velocity reaches its lowest value in the area around the nose of the hull shape, since the pressure has a maximum value in this area, as clearly seen for both models at both velocities. The lift force on a glider is dependent on the pressure distribution on the surface of the lifting body [35]. This comparison of the two models indicates that the pressure around the nose of the final proposed model is decreased and consequently more lift is produced compared with the SUBOFF model. Furthermore, a wake region is formed at the tail area of the hull shapes. For the design in the final model, the fluid flow attaches at the rear region of the hull shape, thus weakening the wake region in the tail area compared with the SUBOFF hull shape, which results in the remarkably minimized drag value and increased lift value.
8 Conclusions

Fig. 17 Velocity contours (m s-1) for a SUBOFF model and b final proposed model at u = 1.5 m·s-1

Fig. 18 Velocity contours (m s-1) for a SUBOFF model and b final proposed model at u = 6.1 m·s-1

Fig. 19 Pressure contours (Pa) for a SUBOFF model and b final proposed model at u = 1.5 m·s-1

Fig. 20 Pressure contours (Pa) for a SUBOFF model and b final proposed model at u = 6.1 m·s-1
Three-dimensional CFD simulation is carried out to investigate the effect of different hull shapes on the hydrodynamic performance and flow characteristics of an autonomous underwater vehicle. For this purpose, the three important parts of the SUBOFF bare hull, namely the main body, nose, and tail, are modified and redesigned. All simulations are performed using the commercial CFD-based Ansys Fluent based on the finite volume, viscous, and incompressible steady RANS equations. The results obtained from the CFD simulation are validated against experimental and numerical results for the SUBOFF model. After considering the effect of the length-to-diameter ratio, and nose and tail shapes on the hydrodynamic coefficients, a final model is proposed. The results demonstrate that the drag is decreased by about 14.9% compared with the SUBOFF model at a velocity of 1.5 m·s-1, while the lift of the final proposed model is increased by about 8 times compared with the SUBOFF model at u = 6.1 m·s-1. These results show that the final proposed hull shape performs better than the base SUBOFF hull shape.
杂志排行
Acta Mechanica Sinica的其它文章
- Geometric and material nonlinearities of sandwich beams under static loads
- Coupled thermoelastic theory and associated variational principles based on decomposition of internal energy
- Transient growth in turbulent particle-laden channel flow
- Experimental and theoretical investigation of the failure behavior of a reinforced concrete target under high-energy penetration
- Revealing the high-frequency attenuation mechanism of polyurea-matrix composites
- Efficient algorithm for 3D bimodulus structures
