An assessment of the impacts of diesel power plants on air quality in Antarctica
2020-03-31SergeyKAKAREKASviatlanaSALIVONCHYK
Sergey KAKAREKA & Sviatlana SALIVONCHYK
An assessment of the impacts of diesel power plants on air quality in Antarctica
Sergey KAKAREKA*& Sviatlana SALIVONCHYK
Laboratory on Transboundary Pollution, Institute for Nature Management, National Academy of Sciences of Belarus, 220114 Minsk, Belarus
This study assessed the effects of diesel generators on air quality in the Antarctic. These devices are the primary energy sources for Antarctic research stations and the main stationary sources of anthropogenic emissions in this region. Taking the Vecherny Oasis, Enderby Land, East Antarctica as an example, NOx, SO2and PM10emissions were estimated and surface concentrations of these same pollutants as well as the dry deposition of PM10were calculated for various periods of exploration of the oasis, based on generator capacities. Estimated values were compared with air quality standards and background air concentrations. The areas associated with increased maximum hourly surface concentrations of SO2, NO2and PM10over the past 30 a were found to have been reduced by factors of 43–55, 9–16 and 13–27, respectively. The region affected by increased maximum monthly PM10deposition has been reduced by a factor of 7. Emissions, surface concentrations and dry depositions in the Vecherny Oasis were calculated for diesel generators in the same power range as used at Antarctic research stations. The most powerful diesel generator currently scheduled to be installed in this region was predicted to generate maximum hourly NO2concentrations above 50 μg·m−3, which is 13 times greater than current levels. The area over which the PM10deposition rate will exceed 10 mg·m−2·month−1will be increased by a factor of 40. The technique employed herein has been demonstrated to be applicable to the preliminary assessment of stationary sources of pollutant emissions in Antarctica, including retrospective assessments.
Antarctica, generator, emission, modeling, AERMOD, concentration, deposition
1 Introduction
Antarctica, which does not have a permanent population, cities or industry, is characterized by a very low level of anthropogenic impact on the environment, including the ambient air, in comparison to other continents. At the same time, anthropogenic activities such as the construction and operation of research stations and related activities as well as tourism are of concern to the Parties to the Protocol on Environmental Protection to the Antarctic Treaty. In accordance with the provisions of the Protocol, any planned activity in the Antarctic should be accompanied by an environmental impact assessment, including an assessment of direct, indirect and cumulative impacts. Such assessments are necessary to predict the effects of human activities, as well as to develop measures to minimize these effects.
Despite ongoing efforts to introduce wind power plants and solar panels, diesel generators remain the main source of energy for scientific stations in the Antarctic and, along with aviation and shipping in Antarctic waters, are the primary sources of anthropogenic pollutant emissions. Air impact assessments traditionally include the following stages: (a) an estimate of potential emissions, (b) an estimate of the transport and dispersion of these pollutants, and (c) an estimate of the deposition of pollutants on the underlying surfaces. Information concerning changes in these impacts over time are also important with regard to emissions, surface concentrations and atmospheric depositions. However, to date, there have been very few reports published concerning estimates of the impact of activities in the Antarctic on the atmosphere.
Several prior studies have estimated the total emissions of individual pollutants in the Antarctic, taking emissions from diesel generators and other sources into account. Boutron and Wolff (1989) reported that the total emissions from the combustion of fuel and waste at research stations in 1987, including from diesel generators, amounted to 70 Mg·a−1for sulfur and 1.8 t·a−1for lead. According to Shirsat and Graf (2009), the total SO2emissions over the time frame of 2004–2005 from both generators and ground vehicles were 158 Mg·a−1. Unfortunately, direct estimates of pollutant emission trends based on historical emissions in the Antarctic are practically absent in the scientific literature, even though these would be of considerable interest. It would be particularly helpful to determine the contributions of local sources as well as the regional and long-range transport of pollutants. At present, trends in the flow of pollutants in the Antarctic environment are primarily obtained from analyses of pollutant levels in ice cores.
The emissions from diesel power plants at scientific stations are regularly estimated by some Antarctic programs, in particular the Australian program (Ratcliffe et al.,2001). Emission data are also available for certain periods for some other Antarctic stations, including the Comprehensive Environmental Evaluations (CEEs) related to the construction and modernization of certain stations (Kakareka et al., 2016;Secretariat of the Antarctic Treaty, 2019). However, time series of emissions are available only for Australian Antarctic stations (Ratcliffe et al.,2017).
Data concerning the fuel volumes used at the various stations, the qualitative characteristics of these fuels and the characteristics of the emission sources are important when estimating trends in emissions and environmental impacts in Antarctic. Even so, this information in many cases is either inaccessible or fragmentary, especially with regard to the qualitative characteristics of the fuel, such as the sulfur, lead, benzene and polyaromatic hydrocarbon (PAH) concentrations. Data concerning the transmission and dispersion of pollutant emissions and their deposition in the Antarctic is even more scarce (Kakareka et al., 2016). The results obtained from modeling the effects of diesel generator emissions on atmospheric air pollution have been included in the CEEs of some stations (Secretariat of the Antarctic Treaty, 2019) but all such reports describe impacts only for specific operating modes of diesel generators and certain types of fuel.
The present study uses the Vecherny Oasis, Enderby Land, East Antarctica, as an example for an evaluation of the environmental impacts associated with atmospheric emissions of SO2, NO2and PM10from diesel generators. This analysis takes into account changes in the number and capacities of diesel engines operating in the oasis from the late 1980s to the mid 2010s. In addition, the primary power range of diesel generators operating in Antarctica was assessed, the maximum emissions were estimated and hypothetical dispersion plumes in the Vecherny Oasis were modeled.
The parametrization of current emission sources in the Vecherny Oasis was carried out on the basis of the results of previous studies (Kakareka et al., 2016). These data were also supplemented by the parametrization and environmental impact assessment of diesel generators operating in the oasis in the period from the 1980s to the early 1990s on the Mount Vechernyaya field base operated by the Soviet Antarctic Expedition (SAE).
2 Area of interest
The area of interest in this work is the Vecherny Oasis, which is located in the western part of Enderby Land about 20 km east of the Molodezshnaya station operated by the Russian Federation (Figure 1). This region includes a number of rocky ridges with north-west to south-east orientations that are almost parallel to the seashore and have a maximum height of 272.0 m at Mount Vechernyaya. The north-eastern slopes of these ridges are steep and short, while the south-western slopes are acclivous. The ridges are divided by terraced valleys and the eastern boundary of the region is defined by the excurrent Hayes glacier. The region within this territory not covered by ice in the Vecherny Oasis is approximately 6 km2in size.
A permanent human presence in the oasis was established beginning in early 1970 (Savatyugin and Preobrajenskaya, 1999; Mihrin, 2018) when the construction of the runway for the landing of IL-18D and IL-76TD airplanes serving the Molodezhnaya research station was initiated. A field camp accommodating technical personnel at Mount Vechernyaya was established in 1975 and, by 1986, this facility comprised 13 separate or interlocked buildings and structures. Three diesel generators (or diesel electric stations; DESs) were installed at the Mount Vechernyaya based, mounted on beams. One of these generators had a power capacity of 100 kW and two had capacities of 75 kW(Savatyugin and Preobrajenskaya, 1999)One DES was installed near Lake Nizhnee, one near the runway and the third at the foot of the southern slope of Mount Vechernyaya (Main Directorate of Navigation and Oceanography of the Ministry of Defense of the Russian Federation, 2005). The functioning of the field base at Mount Vechernyaya continued for more than 10 a in a year-round autonomous mode and then in a seasonal mode until 1992. Later, after the termination of transcontinental flights, the base was retired. Subsequently, most of the base facilities were dismantled, including the diesel generators.
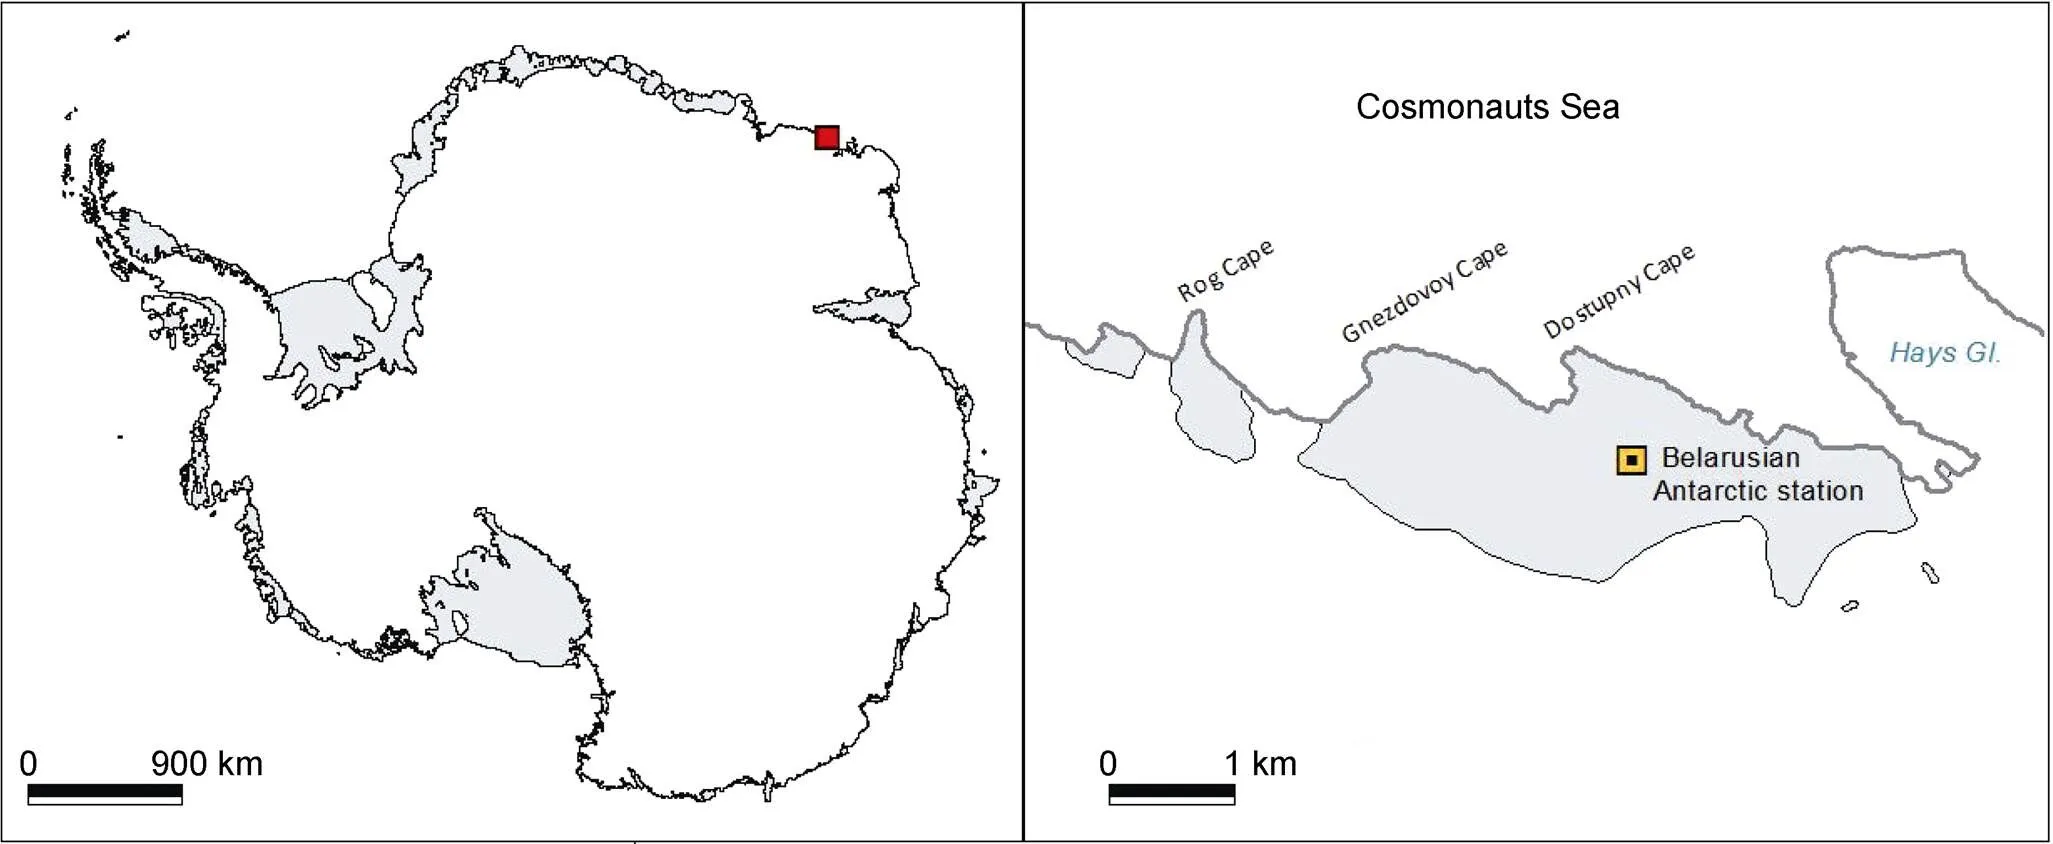
Figure 1 The location of the Vecherny Oasis.
Since 2006, the Belarusian Antarctic Expedition (BAE) has been based on the site of the former field camp, using the preserved infrastructure. In 2006, two main diesel generators were installed along with two smaller backup units. In 2015, the construction of the permanent Belarusian Antarctic station began and, by 2018, a number of modules had become operational, using the same diesel generators.
3 Methods and data
The present air impact assessment included the determination of emissions (in kg·h−1or g·s−1) of SO2, NO2and PM10at 100% and 75% generator loads. In addition, the maximum air concentrations of SO2, NO2and PM10and levels of dry deposition of PM10from three diesel generators were calculated. These included one DES-100 and two DES-75 units operating in the oasis in the 1980s as well as AD-16 (16 kW) and AD-48 (48 kW) generators that are currently used (alternately) at the Belarusian Antarctic station.
3.1 Emissions estimation methodology
The emissions of various pollutants were estimated from emission factors (that is, the grams of each pollutant produced per kilogram of fuel) and the hourly consumption of fuel at various generator loads. These values were obtained from the manufacturer’s specifications data for the diesel generators as well as data published by the SAE and BAE. As an example, according to a BAE report (Secretariat of the Antarctic Treaty, 2017), diesel fuel consumption at the Belarusian station varied from 2 to 4 t per season. In the absence of information for specific models of diesel generators, passports of similar units were used.
The characteristics of the fuel were obtained from fuel standards that were in force during the operation of the field base of the SAE and the Belarusian Antarctic station. Emission factors were obtained from national and international guidelines (AP-42, 1996; Ministry of Natural Resources of the Russian Federation, 2001; GOST R 56163-2014, 2014; EEA, 2016), as summarized in Table 1. SO2emissions were determined based on the sulfur content in the fuel in accordance with current fuel quality standards (GOST 305-58, 1959; GOST 305-62, 1965; GOST 305-73, 1979; GOST 305-82, 1983; GOST R 55475-2013, 2013; GOST R 56163-2014, 2014), taking into account that Diesel Winter and Arctic fuels were employed at the field base and Belarussian Antarctic station. The sulfur content in the diesel fuel was assumed to be 1%, 0.5% and 0.2% before 1983, from 1984 to 2013 and after 2013, respectively.
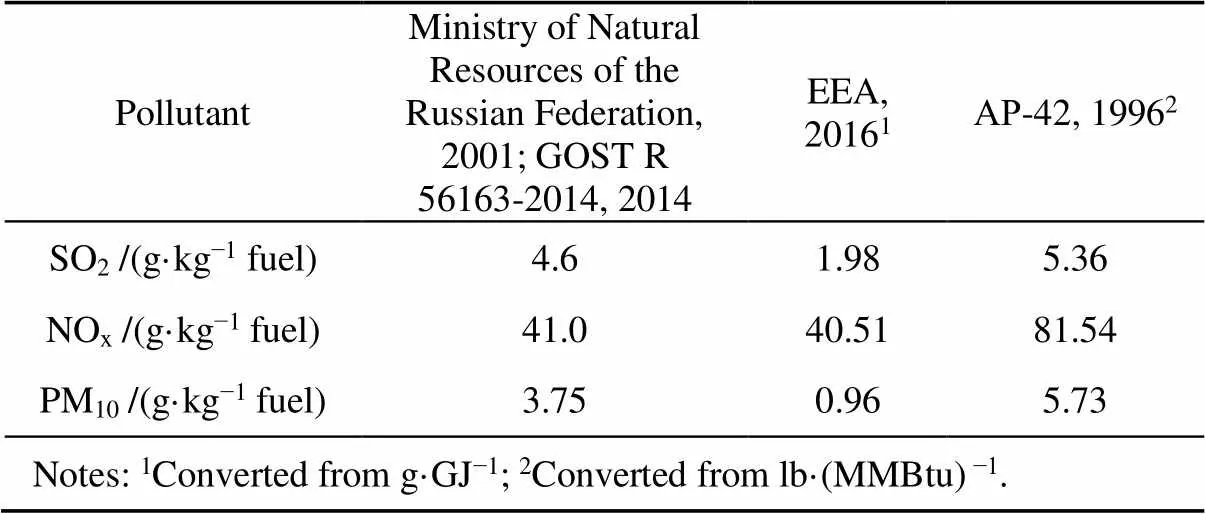
Table 1 Emission factors for stationary diesel generators
3.2 Emissions dispersion modeling
The dispersion and dry deposition of pollutants were assessed using the United States Environmental Protection Agency (US EPA) AERMOD Gaussian model (US EPA, 2004). In this process, each generator was modeled as a point emission source and positioned in a Universal Transverse Mercator (UTM) coordinate system. The physical parameters and emission characteristics of the generators were input into the model, including the heights and inside diameters of exhaust pipes, the exhaust gas exit temperature and velocity, and the NOx, SO2and PM10emission rates (Table 2). Calculations were performed for diesel generators operating during the SAE period (using one DES-100 and two DES-75) based on 100% (1st scenario) and 75% (2nd scenario) loads. The 1st scenario corresponded to a potential situation in which the engine was operated at its maximum load, while the 2nd scenario represented the standard generator workload. These two scenarios differed in terms of the exhaust gas exit velocity and the emission rates of the various substances (Table 2).

Table 2 Parameters for diesel generators at the Mount Vechernyaya Station used in modeling the dispersion of air pollutants
An algorithm for particle deposition based on Method 2 in the AERMOD model was selected to calculate the PM10dry deposition fluxes. This Method takes into account the mass fraction of fine particulate matter (PM2.5) in the exhaust gas and the average particle diameter of fraction PM2.5. For diesel generators, these parameters were set to 1 and 1.5 μm, respectively, according to the recommendations of the European Environment Agency Air Pollutant Emission Inventory Guidebook (EEA, 2016).
The input data for the AERMOD model included meteorological, surface and terrain information. The meteorological data were obtained from ground-based observations at the Molodezhnaya Station (WMO index 895420) and from upper air sounding data obtained at the Syowa Station (WMO index 895320) covering the period from November to March equivalent to the Antarctic summer. The surface roughness length, albedo value and Bowen ratio of the topographical region being modelled were estimated on the basis of satellite images and 1:25000 scale topographic maps. Initially, the extent of land cover wasNational Land Cover Dataset 1992 ((Anderson et al., 1983). Following this, values of surface roughness length, albedo and Bowen ratio (US EPA, 2008) were determined based on this classification process. A digital elevation model for the Vecherny Oasis was obtained using the hypsometric layer of the topographic maps. Modelling was carried out for a territory spanning 4950 × 4950 m2using a receptor network constructed from 10000 points with a 50 m step size. The Penguin colony on Cape Gnezdovoy and various lichen and moss ecosystems closest to the emission sources were selected as key receptor points (Table 3). The maximum hourly, daily and monthly concentrations of SO2, NO2and PM10in surface air, as well as the daily and monthly dry depositions of PM10were calculated, setting the background pollutant concentrations to nil.

Table3 Description of key receptor points in the Vecherny Oasis for which calculations of air pollutant concentrations were performed
4 Results
4.1 Emissions
The calculated emissions for diesel generators operating at 100% and 75% loads are provided in Table 4. It was noted that even with the 100% load of current diesel generators, emissions of SO2, NO2and PM10decreased by 9–10, 4–5 and 5–6 times, respectively.
4.2 Modeled ambient air concentrations and depositions
The results of modeling of the maximum concentrations of pollutants show that, in the late 1980s, only NO2levels exceeded current air quality standards (The European Parliament and the council of the European Union, 2008; WHO, 2000; WHO, 2006), and this was only the case near the area of operation of the more powerful DES-100 unit operating at 100% load (1st scenario) when applying hourly and daily averaging.

Table 4 Pollutant emissions from diesel generators operating in different periods in the Vecherny Oasis
In the case of hourly averaging, the permissible NO2concentration in air (250 μg·m−3) was exceeded north-east of the source at distances of 15–50 m (Figure 2). However, it was more likely to exceed the maximum permissible daily average NO2concentration (100 μg·m−3) north-west of the source at distances of 20–70 m. The NO2concentrations were determined to reach 50% of the daily (100 μg·m−3) and yearly (40 μg·m−3) concentration limits at distances of 137 and 120 m, respectively. In addition, the maximum permissible concentrations (MPCs) of the modeled pollutants were not exceeded at any of the receptor points (Table 5).
A zone in which the highest maximum hourly concentrations for all pollutants were present was identified north-east of the diesel generators, while the highest daily and monthly concentrations were found to the north-west (Figures 2–5). The estimated maximum hourly, daily and monthly average PM10concentrations reached 20%, 20% and 12% of the MPCs (150, 50 and 40 µg·m−3, respectively, for PM10). In the case of SO2, the values were 13%, 15% and 30% of the MPCs (500, 200 and 50 µg·m−3, respectively) (Table 6).
Estimates of the maximum concentrations of various pollutants reported previously (Kakareka and Salivonchyk, 2015; Kakareka et al., 2016) for the AD-48 unit assessed in the present work are very similar. The differences between the values obtained in this work and in prior studies can be ascribed to the use of more accurate diesel generator parameters and fuel sulfur content data in the present analysis. Previous assessments of air pollution in different regions of Antarctica (McMurdo Station, Terra Nova Bay, Dome C, Molodozhnayaya Station and the South Pole) have shown mean PM10concentrations ranging from 0.2 to 4.1 µg·m−3(Hansen et al., 2001; Mazzera et al., 2001; Truzzi et al., 2005), mean NO2concentrations from 0.4 to 5.4 µg·m−3and mean SO2concentrations from 0.03 to 0.7 µg·m−3(Golitsyn et al., 1991; Matsuki et al., 2002; Frey et al., 2015). Some researchers (Wolff and Cachier, 1998; Huey et al., 2000; Hansen et al., 2001) noted alternating high and low concentration values. It was also found that high pollutant concentrations in air were most likely to occur at low wind speeds and with winds moving from the direction of the station, and so were closely related to local pollution from the station generators. Wolff and Cachier(1998)determined that the black carbon air concentration was increased by a factor of more than 100 relative to background levels when the sampling device was located downwind of the station at a distance of several hundred meters, but was not increased at all when positioned at the same distance but upwind. Hansen et al. (2001) showed that high PM concentrations that exceeded the lowest values measured by a factor of approximately 15 (approximately 300 ng·m−3versus 20 ng·m−3) were obtained in about one third of all measurements. Hansen’s data also demonstrated that high BC concentrations were associated with air masses moving from the station and that daily variations in these concentrations corresponded to the daily work schedule at the station.
It is difficult to interpret the estimated PM10deposition data resulting from modeling because there are no established limits. However, these values can be compared with background deposition rates. Analyses of the baseline dust flows in the Antarctic were previously carried out under the Separation of the Western Antarctic Ice Sheet project, and the evaluation of the results has been described in the literature (Wolff et al., 2006; Fischer et al., 2007; McConnell et al., 2007; Bory et al., 2010; Albani et al., 2012; Lambert et al., 2012; Koffman et al., 2014). The data show that, during the late Holocene, dust flows in the coastal parts of the Antarctic ice sheet at altitudes below approximately 2500 m above sea level averaged from 1 to 12 mg·m−2·a−1. Moreover, the flows were the lowest in high altitude sections of East Antarctica and the highest (12 mg·m−2·a−1) on James Ross Island at the tip of the Antarctic Peninsula (McConnell et al., 2007). In the western part of the continent, the average background dust deposition in the late Holocene was estimated to be in the range of approximately 3–5 mg·m−2·a−1, but over the past two millennia has increased on average to approximately 15–25 mg·m−2·a−1(Koffman et al., 2014). In the case of the East Antarctic Plateau, the deposition has been estimated to be about three times lower in the late Holocene (Fischer et al., 2007; Bory et al., 2010), with estimates from 0.2–0.6 mg·m−2·a−1(Lambert et al., 2012) to about 1 mg·m−2·a−1(Albani et al., 2012). Over the last millennium, the background PM flux on the East Antarctic Plateau was approximately 1–5 mg·m−2·a−1(corresponding to 0.08– 0.42 mg·m−2·month−1or 0.003–0.014 mg·m−2·d−1).
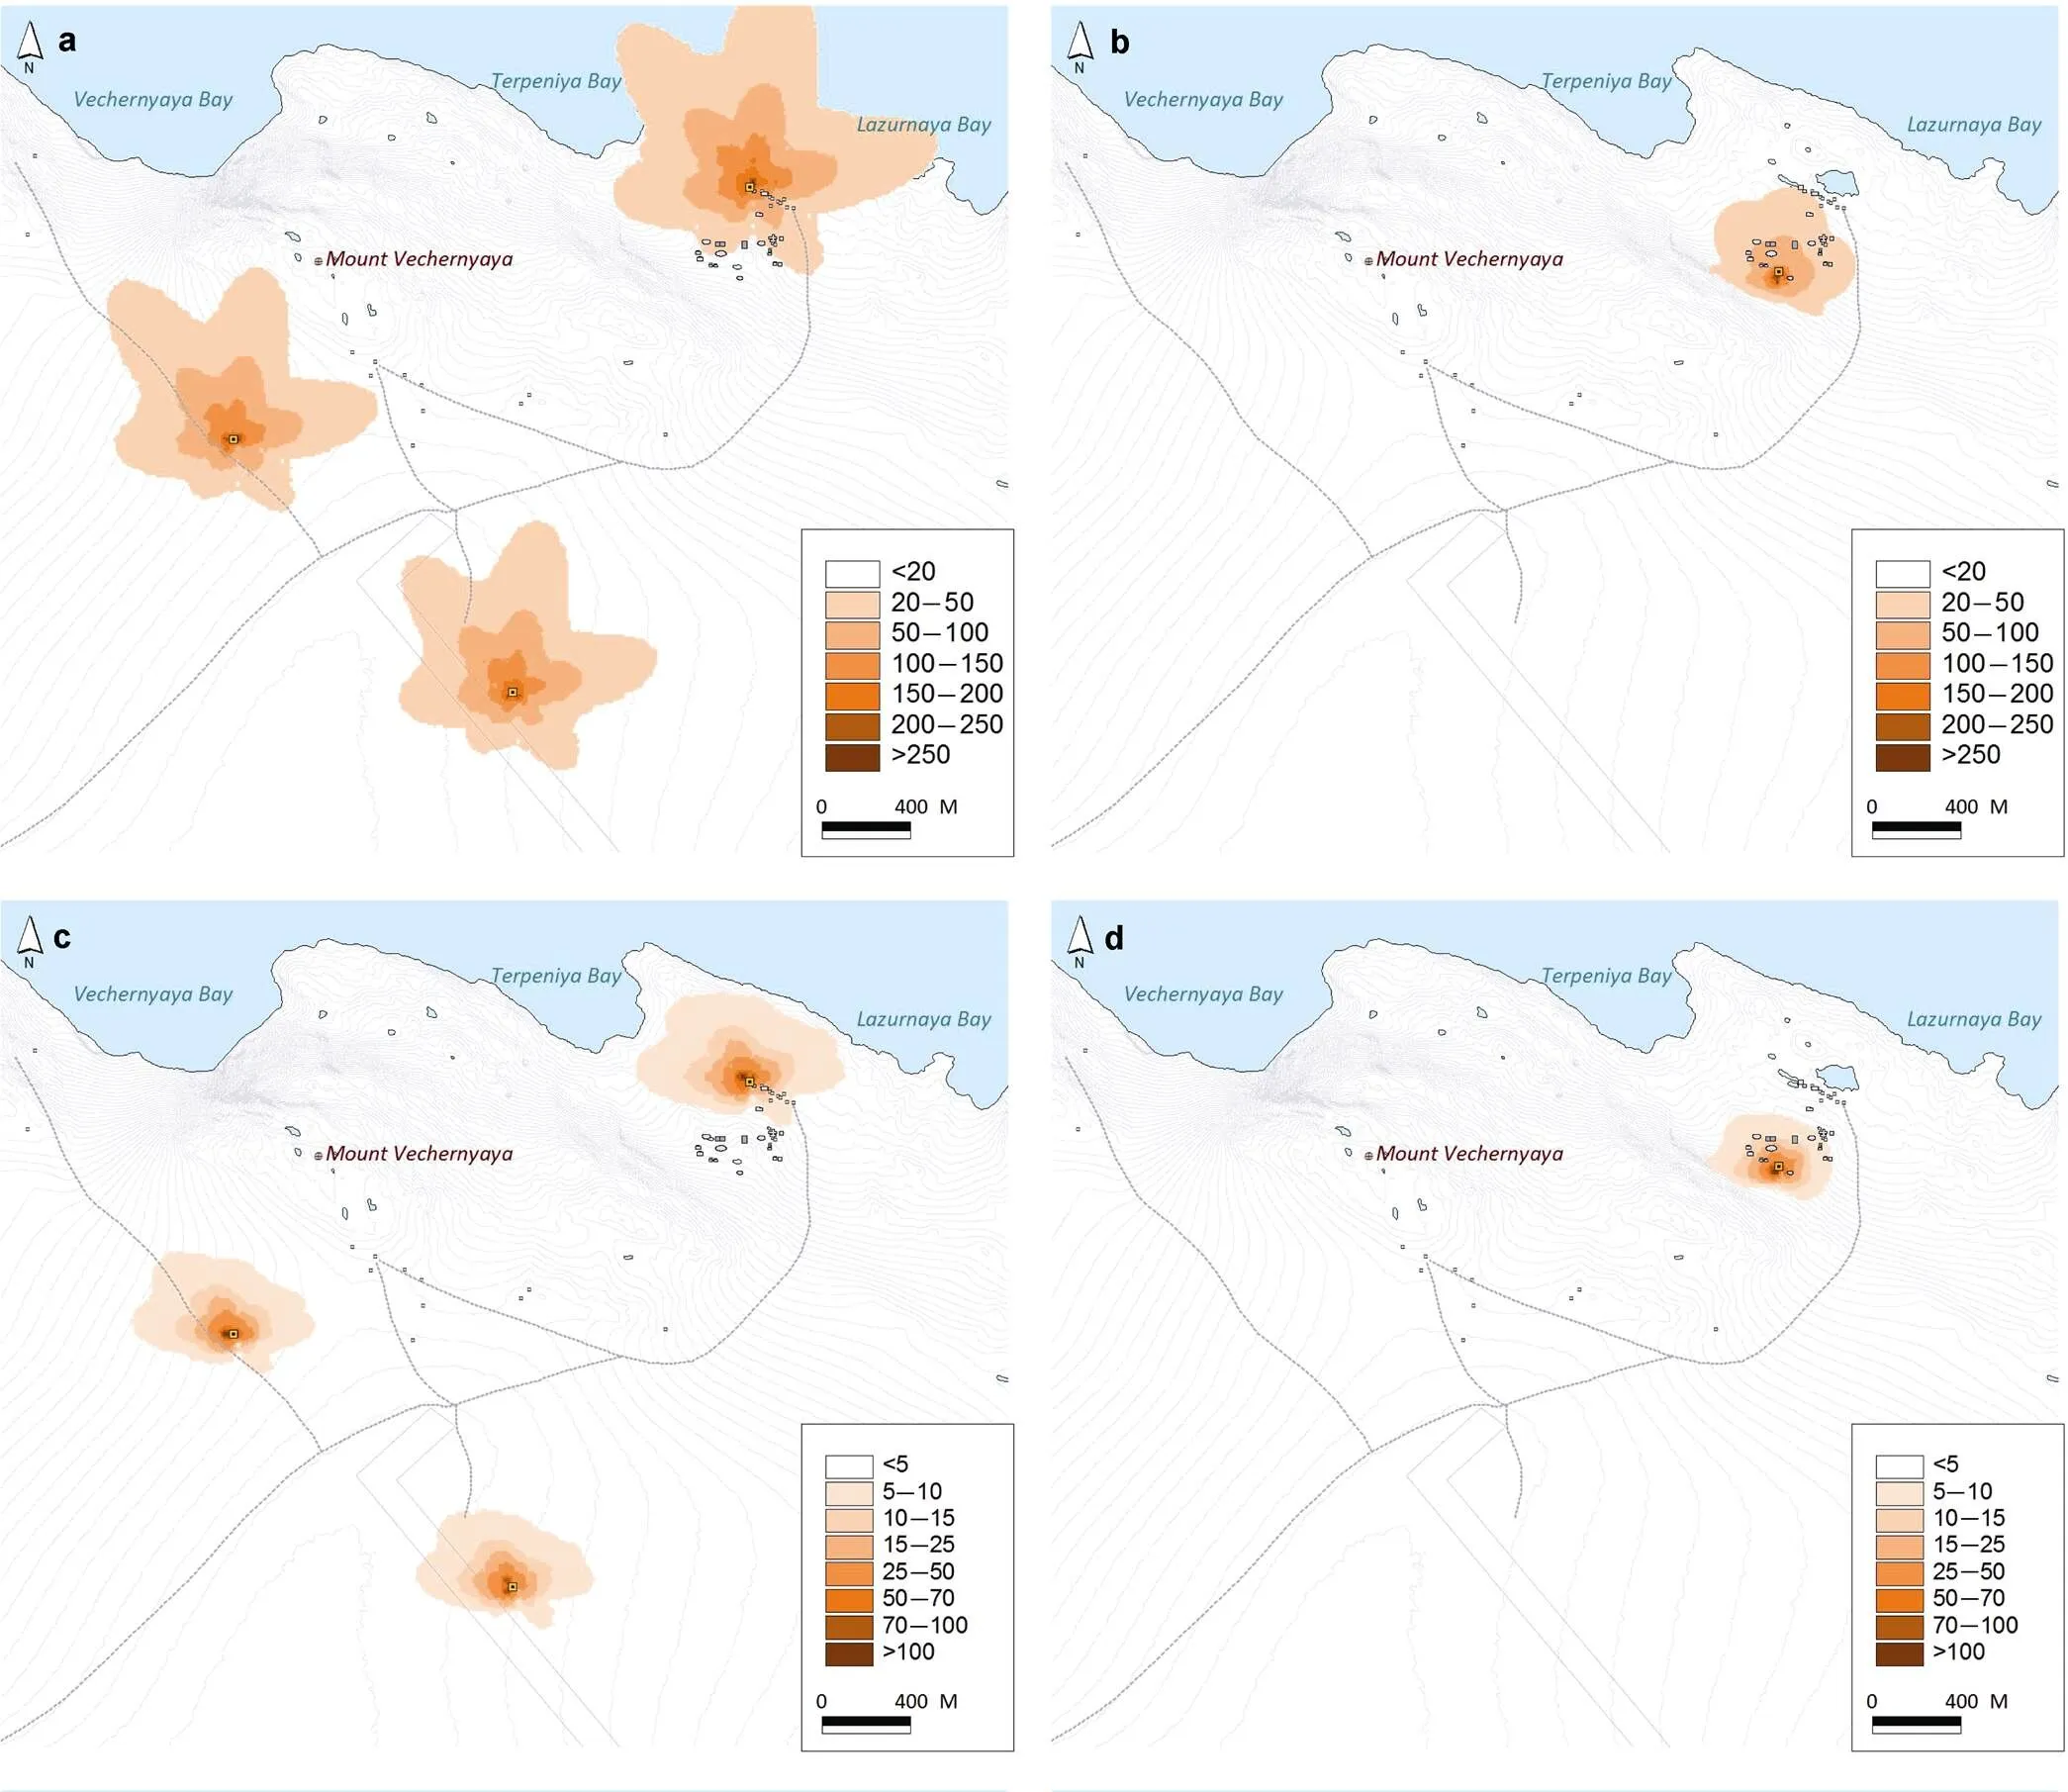
Figure 2 Modeled maximum 1 h (a, b), 24 h (c, d) and monthly (e, f) NO2air concentrations (μg·m−3) produced by diesel generators in the Vecherny Oasis during the mid to late 1980s (a, c, e) and the mid 2010s (b, d, f).

Table 5 Modeled maximum air pollutant concentrations and atmospheric deposition levels at receptor points in the Vecherny Oasis
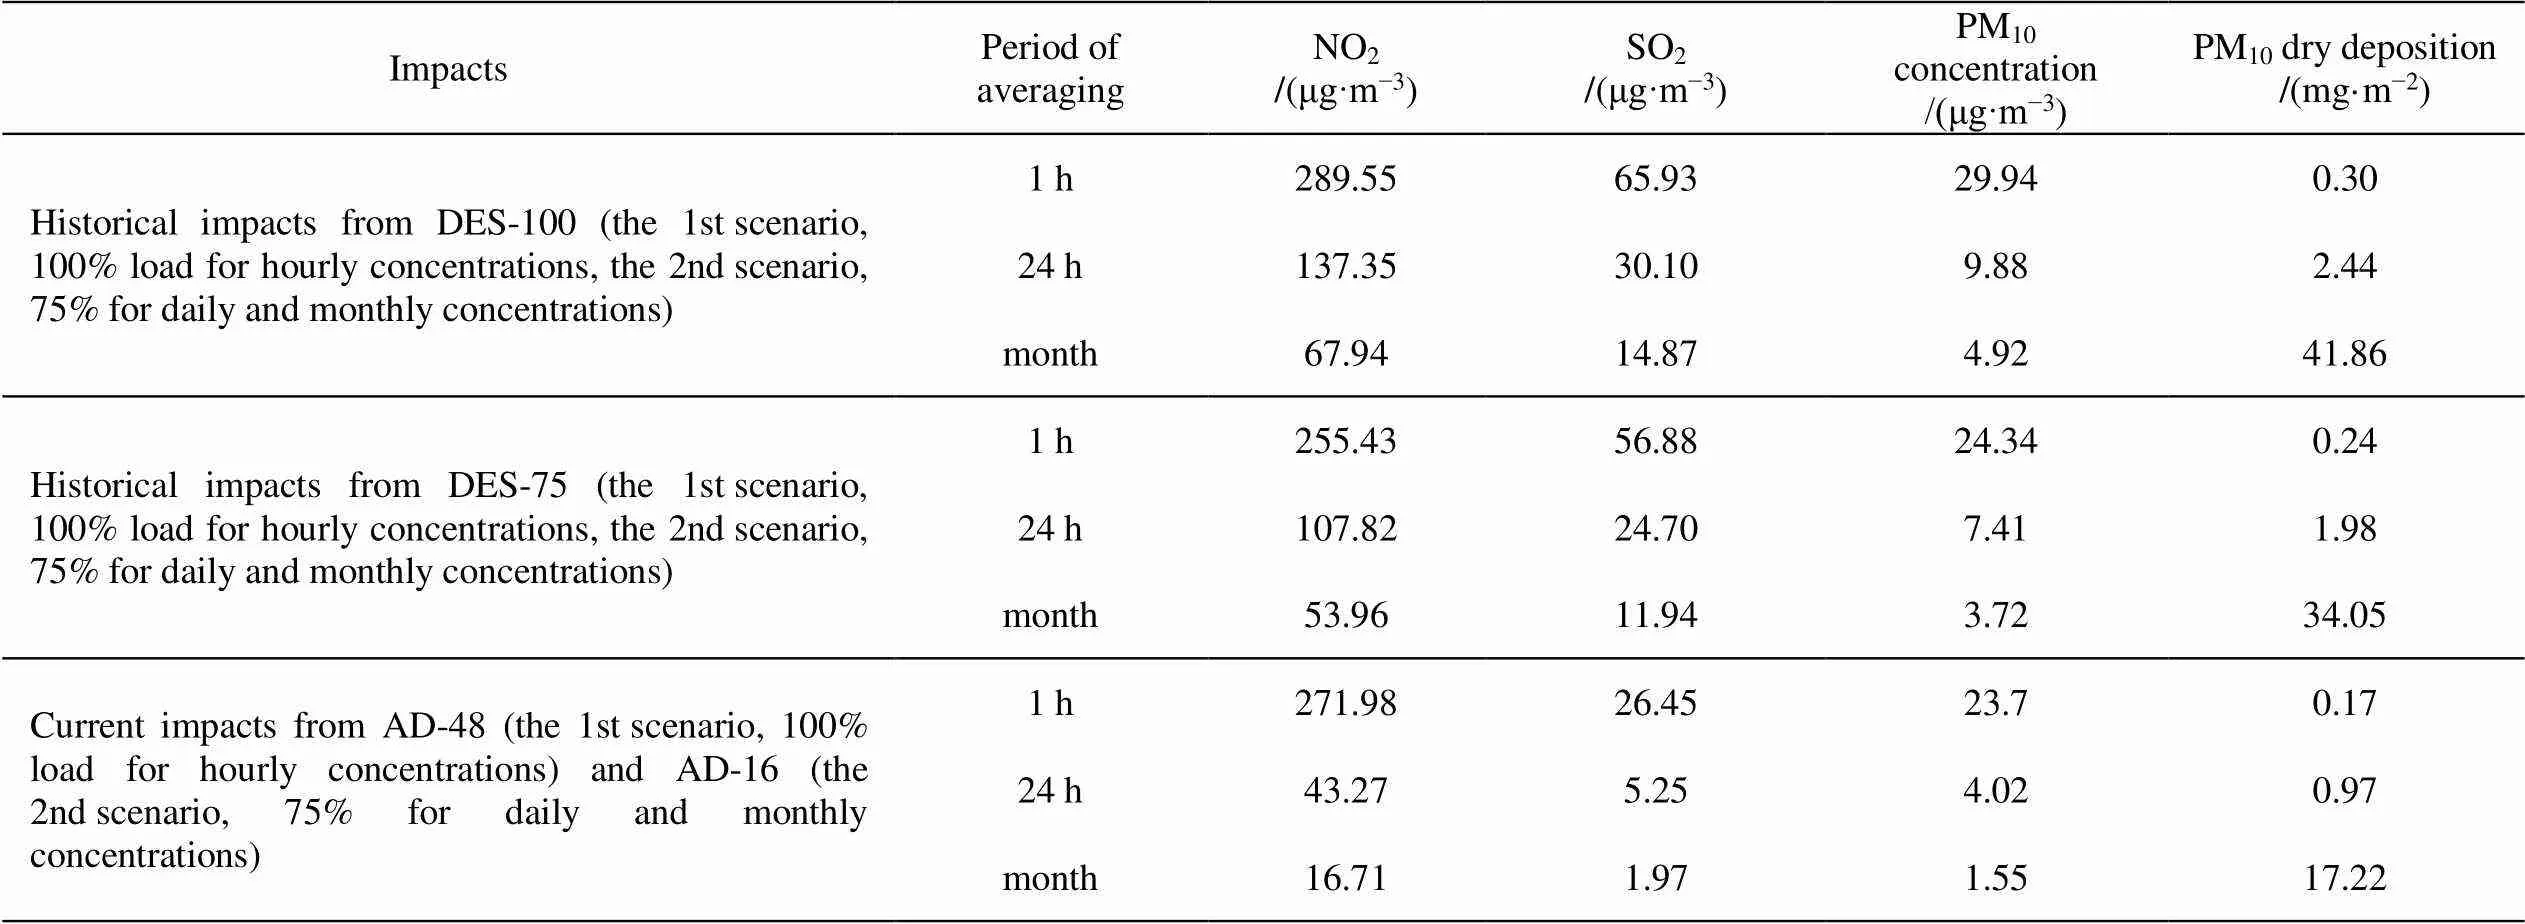
Table 6 Maximum hourly, daily and monthly average pollutant air concentrations and dry depositions from diesel generators in the Vecherny Oasis at locations with the highest expected concentrations
Thus, the calculated 24 h average dry deposition fluxes of PM10in the areas associated with maximum loads (based on emissions from a DES-100 unit) can be more than 170 times the background value, while the highest monthly average loads can reach 90 times the background (Table 6). However, the areas over which these high levels of deposition of fine particles appear are much localized. In the present analysis, the estimated PM10flux was 50 times higher than the background value (>50 mg·m−2·a−1) and was localized in the north-west direction relative to the DES-100 in a small area of about 30 × 40 m2(corresponding to two receptor points). The maximum levels of PM10deposition from the DES-75 unit were found to be 35 times the background level.
The deposition rate of PM10was higher than the highest background value (5 mg·m−2·a−1), and these high levels were most likely to be observed north-west of the diesel generators. For the DES-100, there was a region with a radius of not more than 165 m with elevated PM10levels, while the range for the DES-75 had a radius of less than 180 m. PM10deposition levels greater than the lowest background value (1 mg·m−2·a−1) in the region of the DES-100 were identified over a radius of not more than 450 m, while the range for the DES-75 had a radius of less than 380 m.
4.3 Comparison of modern and historical air impacts in the Vecherny Oasis
The results of the present study show that the regions in which the operation of diesel generators had environmental impacts in the oasis historically and recently generally do not overlap. The only area of possible cumulative impact from the operation of diesel engines in the past and present is to the west of Lake Nizhnee. Moreover, the deposition amounts both in the past and in the present in this area were estimated to be negligible. Specifically, the annual flux of PM10from diesel generators at present is 1 mg·m−2·a−1while in the 1980s this value was as high as 5 mg·m−2·a−1. These values are close to the background dust flow in Antarctica in recent decades, which reach maximum hourly suspended particle concentrations of 3 μg·m−3at present and have previously been as high as 16 μg·m−3. The differences in the maximum NO2and SO2loads between past and present are slightly larger. In the past in this region, the hourly NO2and SO2concentrations were as high as 160 and 38 μg·m−3and currently are as high as 50and 20 μg·m−3, respectively.
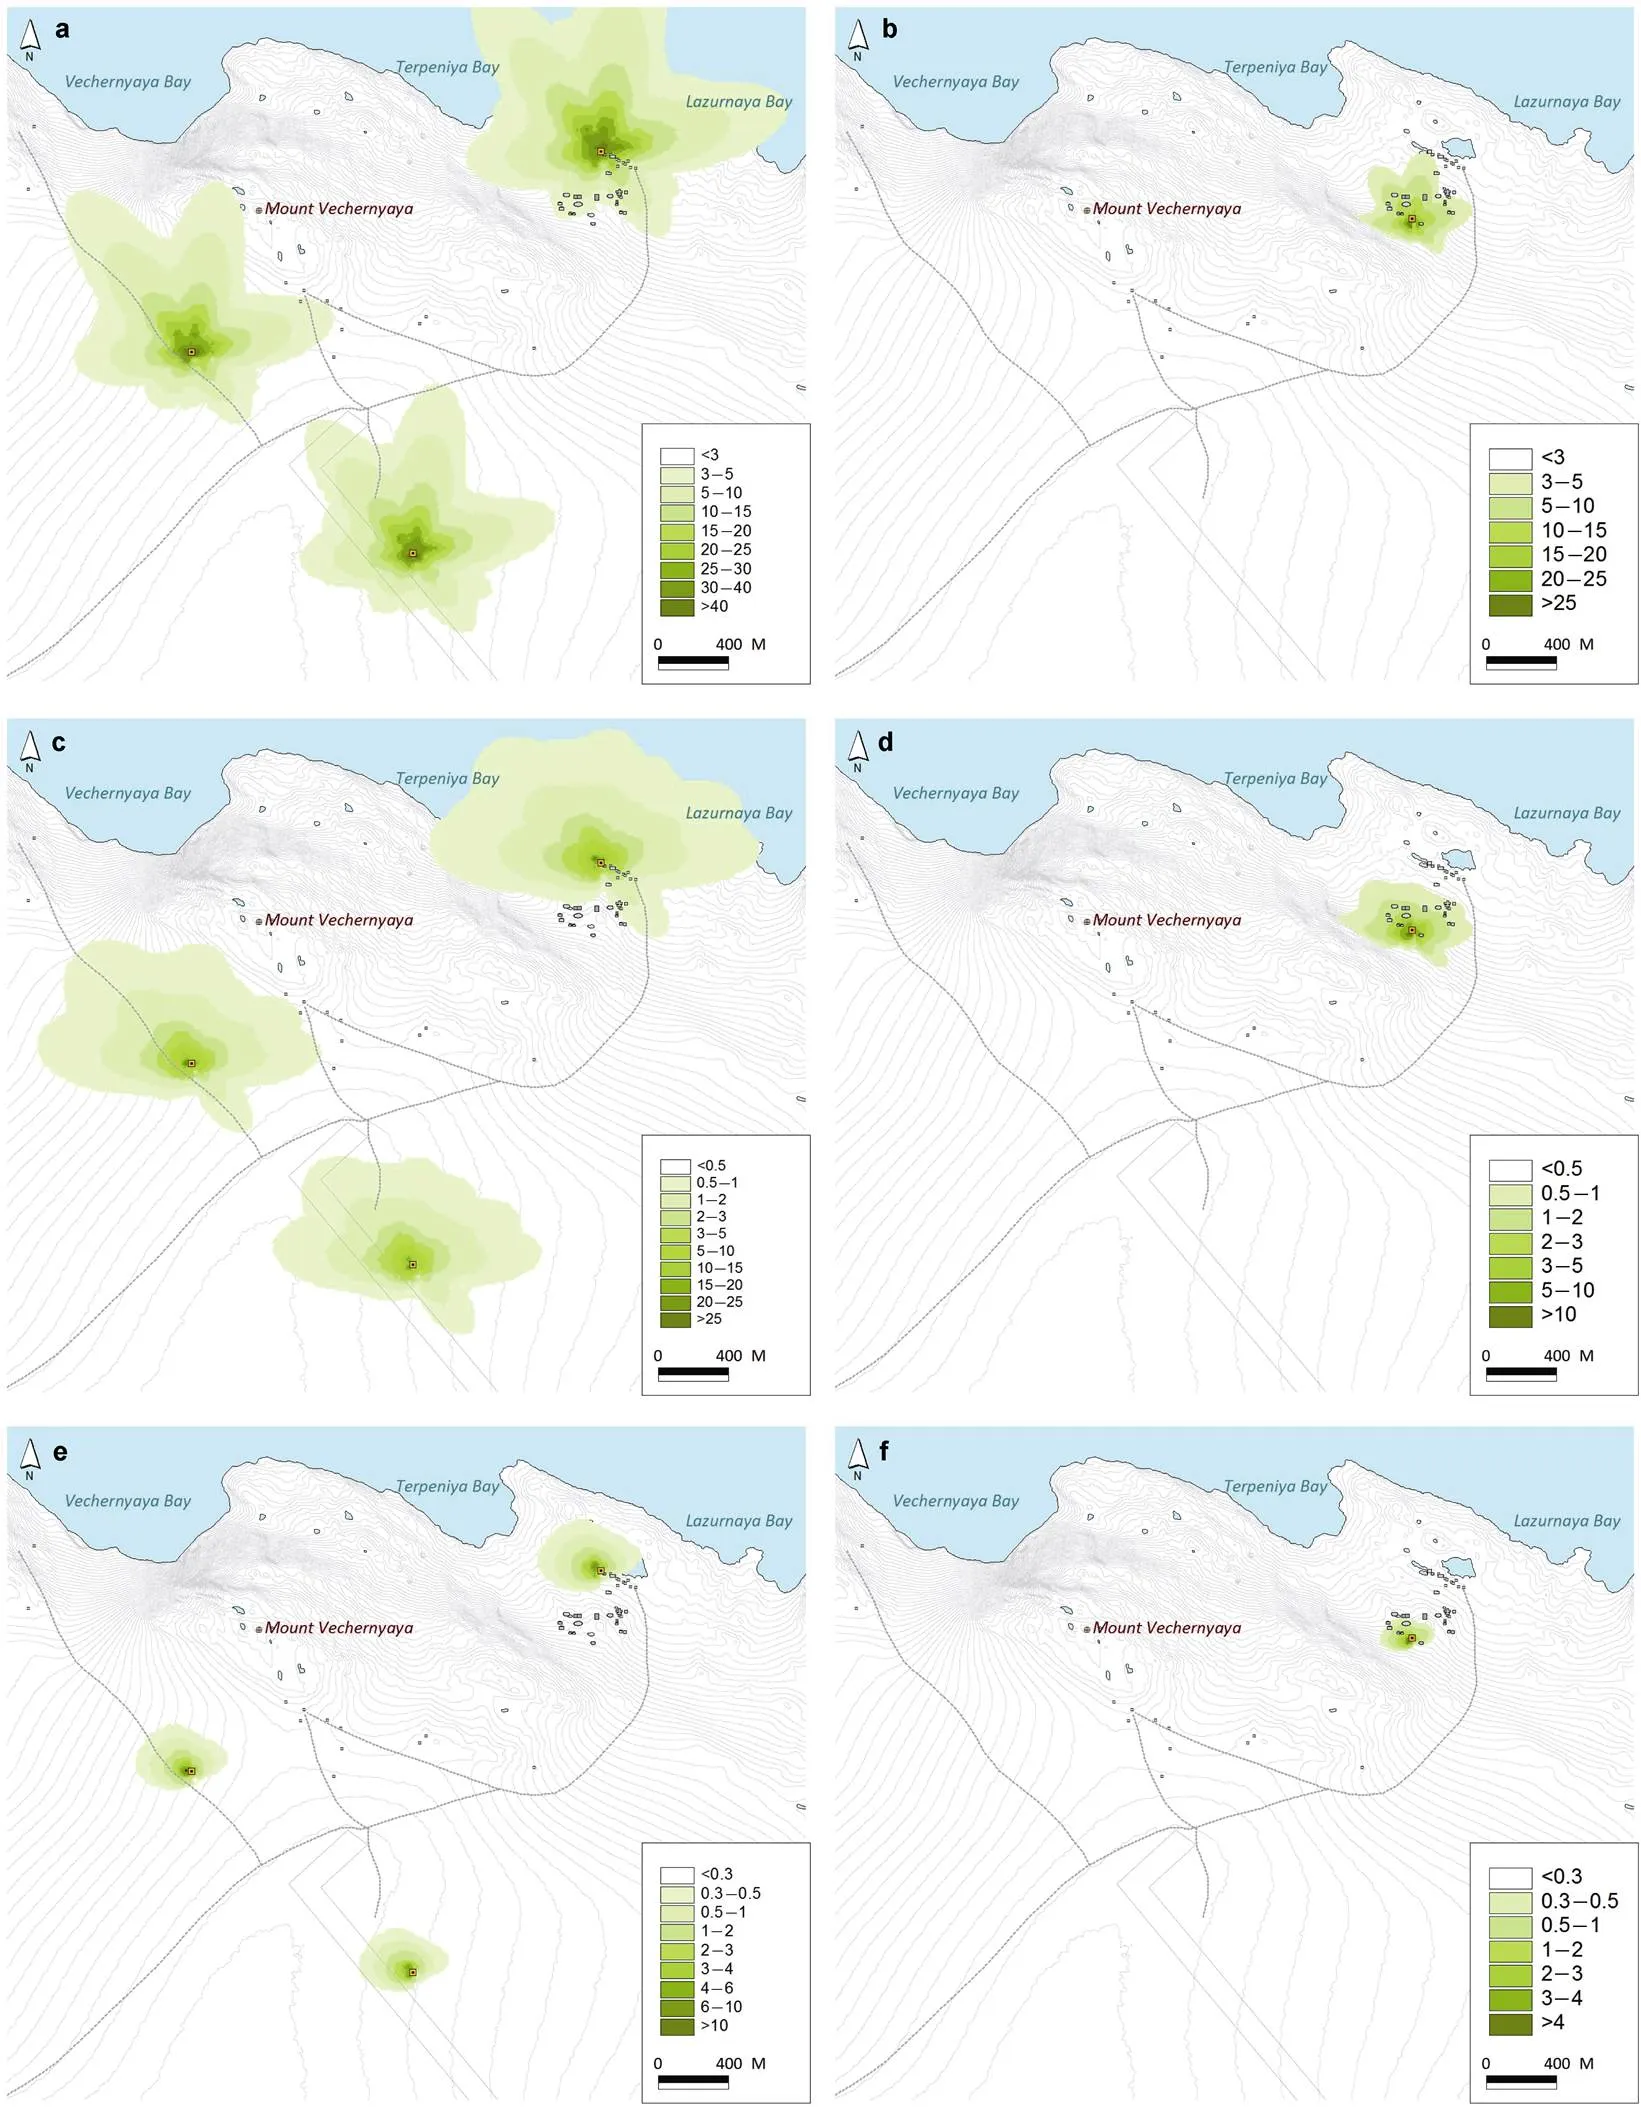
Figure 3 Modeled maximum 1 h (a, b), 24 h (c, d) and monthly (e, f) SO2air concentrations (μg·m−3) produced by diesel generators in the Vecherny Oasis during the mid to late 1980s (a, c, e) and the mid 2010s (b, d, f).
Figure 4 Modeled maximum 1 h (a, b), 24 h (c, d) and monthly (e, f) PM10air concentrations (μg·m−3) produced by diesel generators in the Vecherny Oasis during the mid to late 1980s (a, c, e) and the mid 2010s (b, d, f).
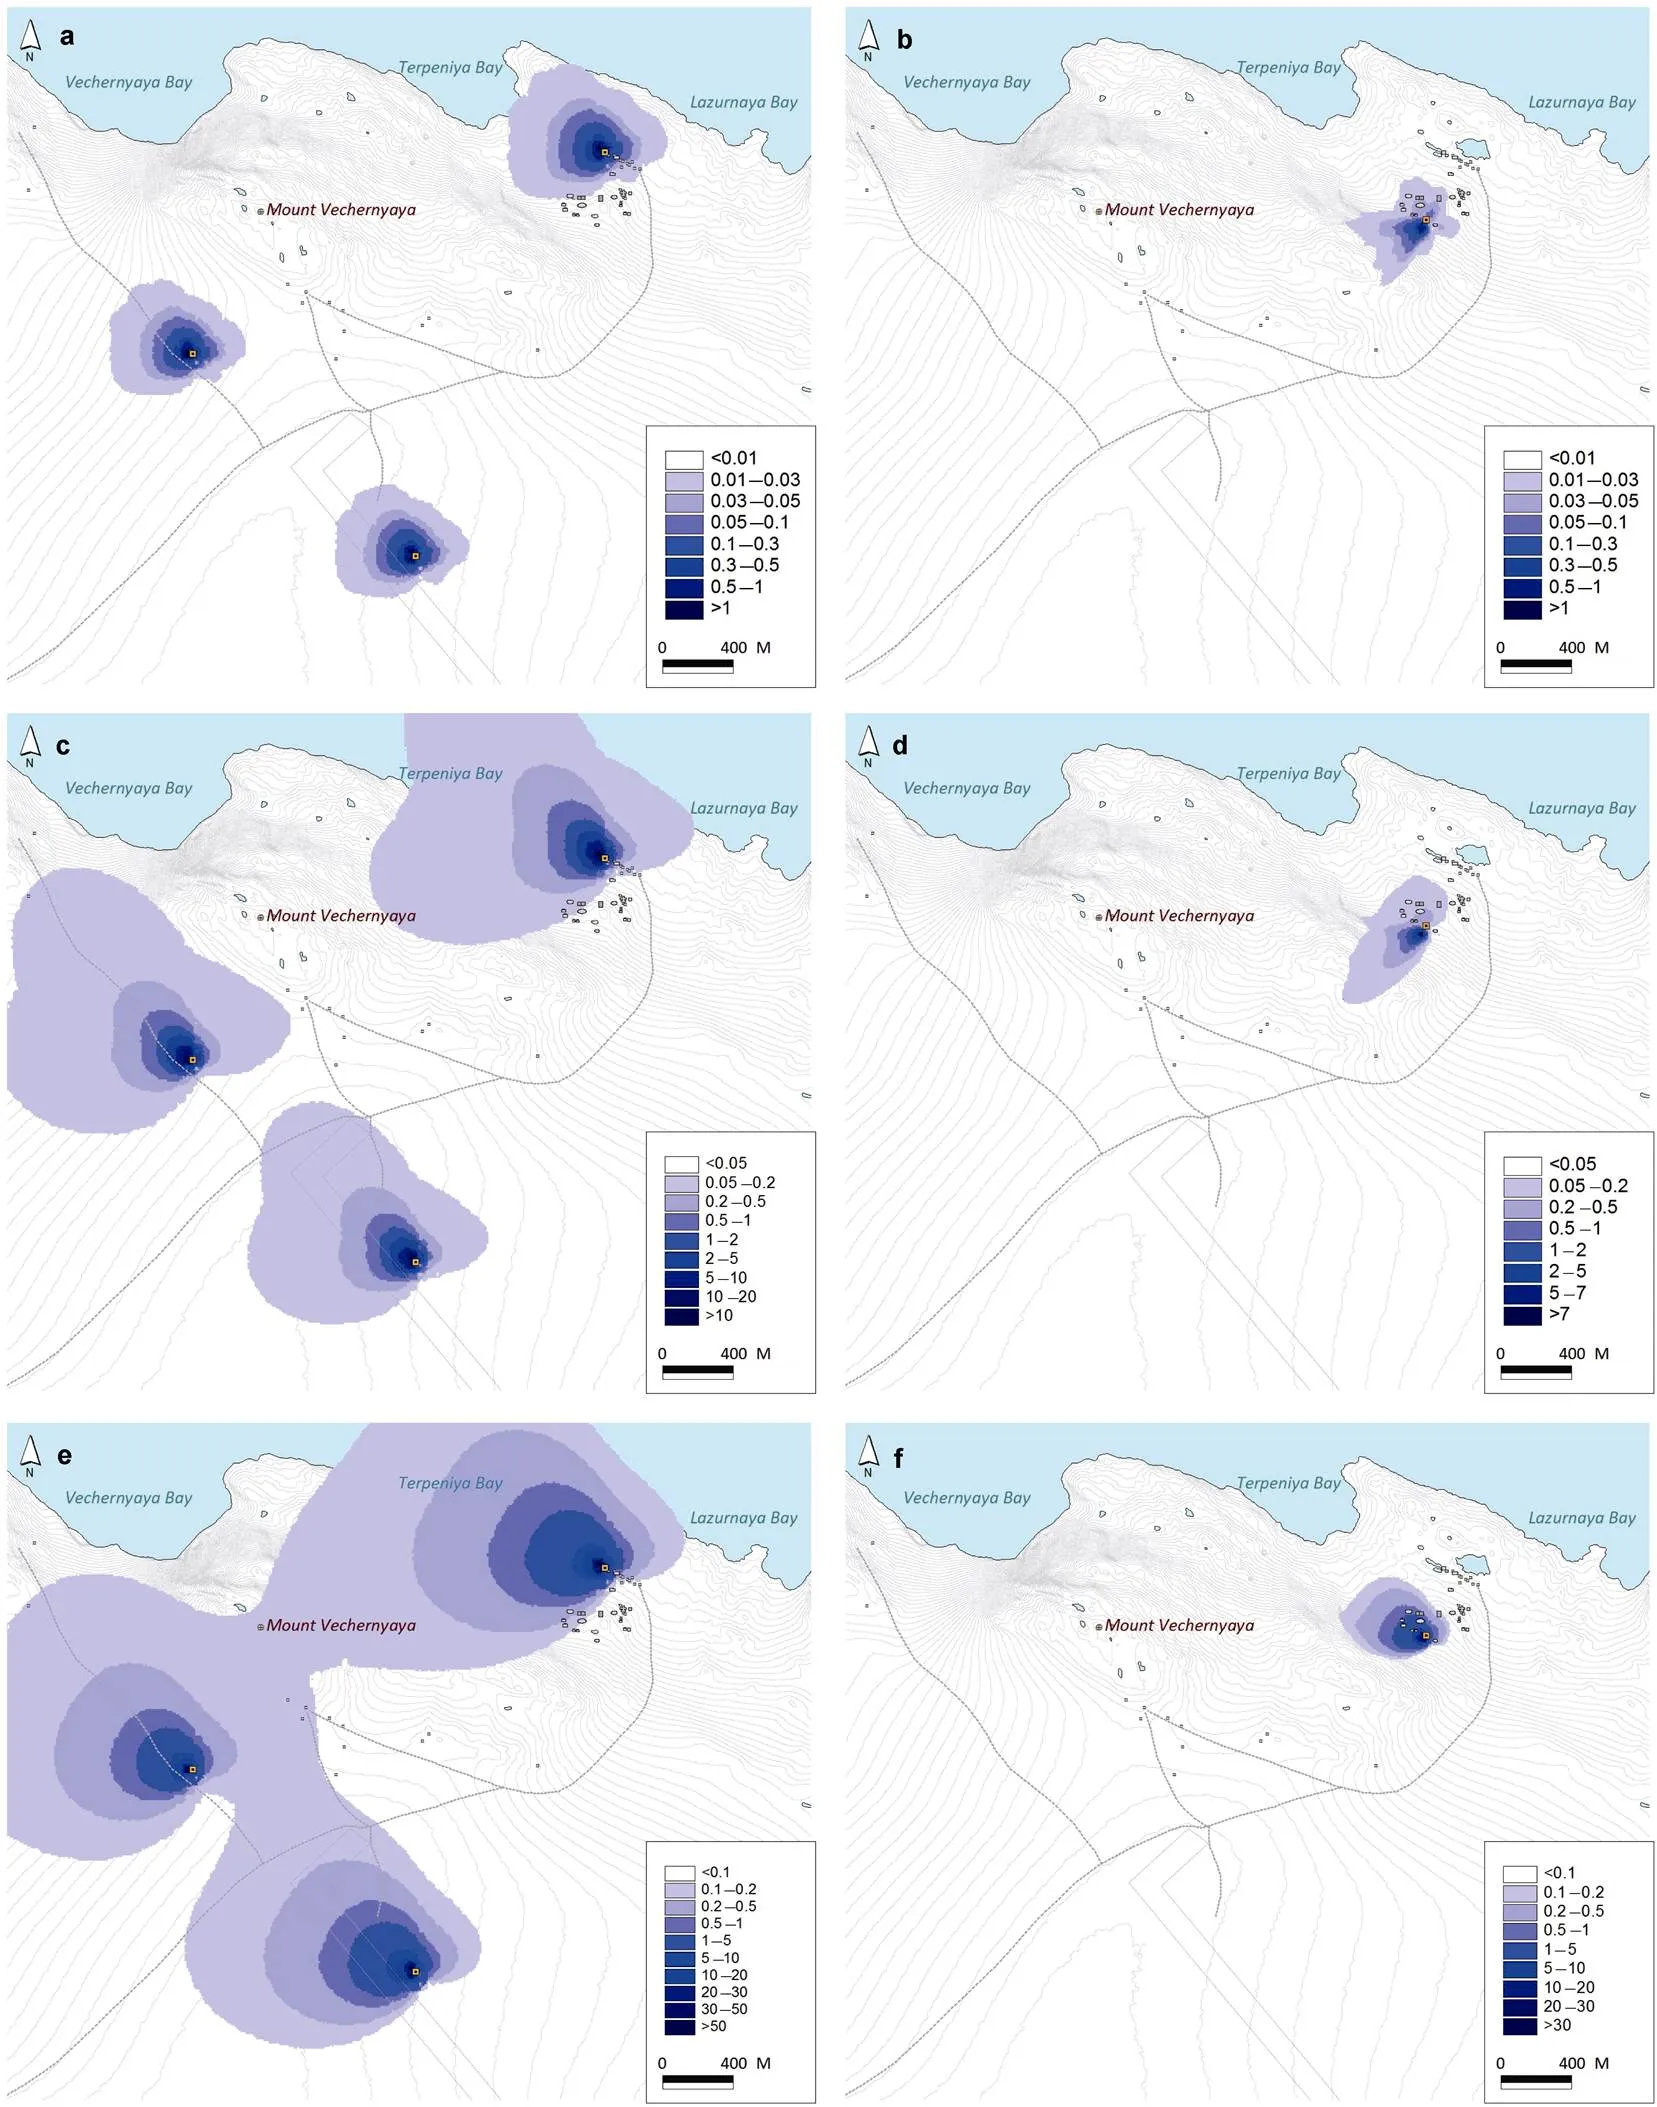
Figure 5 Modeled 24 h (a, b) and monthly (c, d) PM10air concentrations (μg·m−3) and monthly PM10depositions (e, f) (mg·m−2·a−1) prodused by diesel generators in the Vecherny Oasis during the mid to late 1980s (a, c, e) and the mid 2010s (b, d, f).
In general, the regions associated with both past and present impacts from the operation of diesel generators are strictly localized, with modern loads affecting much smaller areas where the stations’ main facilities are located. Thus, the area over which the maximum hourly NO2concentrations exceed 100 μg·m−3has been reduced by a factor of 16, while the daily concentrations have been reduced by a factor of 4. The areas in which the SO2maximum hourly concentrations are above 20 μg·m−3have been reduced by a factor of 55 while the regions associated with maximum daily concentrations above 10 μg·m−3have been reduced by a factor of 14 (Table 7).
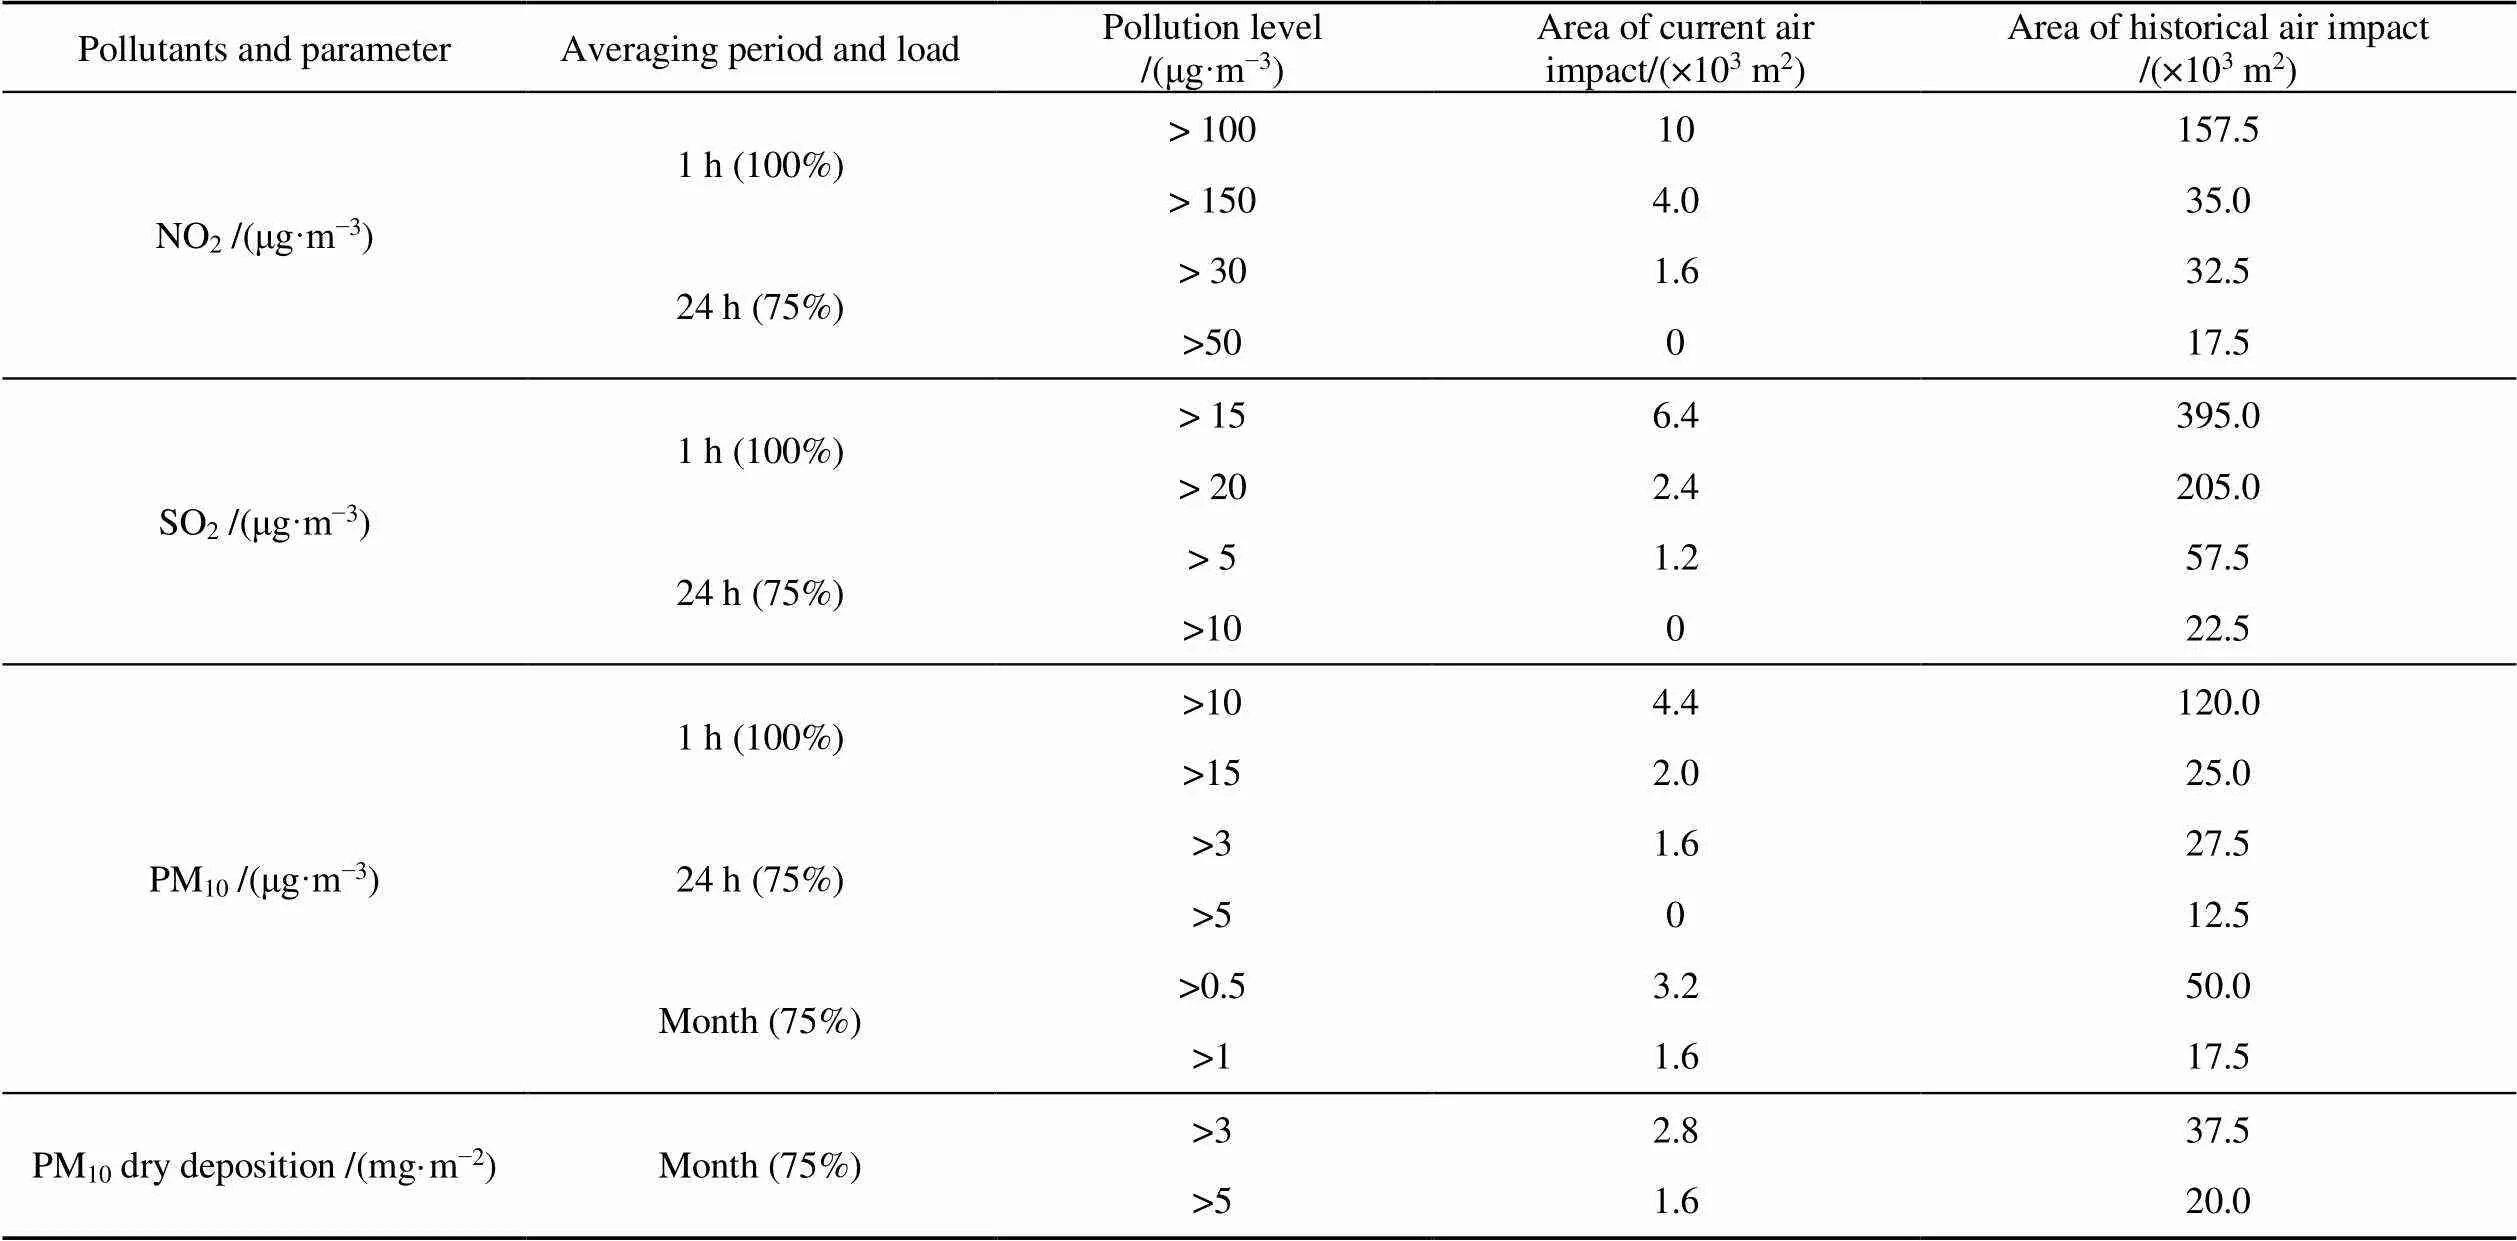
Table 7 Comparisons of historical and current air impacts in the Vecherny Oasis due to the operation of diesel generators
5 Discussion
Calculations of air pollutant concentrations were performed using dispersion modeling for the Belarusian Antarctic station as well as the Indian Bharati Station at Larsemann Hills, the Republic of Korea Jang Bogo Station, the Czech J.G. Mendel Station, the German Neumayer III Station and the Ukrainian Vernadsky(Kakareka and Salivonchik, 2015). When assessing the J.G. Mendel Station, the impact of a 10 kW diesel generator was assessed using the SYMOS’97 Gaussian model. The results showed that, in the vicinity of the station (up to approximately 50 m), the 1 h surface ambient air concentrations of NO2(200–250 µg·m−3) slightly exceeded the limit (CEE, 2004). In the case of the Jang Bogo Station, the effects of two 250 kW generators and one 50 kW generator were examined using the ISCT3 Gaussian model. The calculations showed maximum 1 and 24 h NO2concentrations of 30 and 10 ppb, respectively, and an average concentration over a span of one year of3 ppb (corresponding to 57.4, 19.1 and 5.7 µg·m−3, respectively) (CEE, 2012). The German Neumayer III station assessment looked at the impact of three 150 kW and two 75 kW generators using the SCREEN3 model. The maximum NO2, SO2and PM10concentrations of 1 h were found to be 96, 3 and 3.2 µg·m−3(Bunge and Roβ-Reginek, 2005). At the Indian Bharati Station, the dispersions of NO2, SO2andPM10from three 100 kW generators as well as from ships and helicopters were calculated using the ISCST 3 air quality prediction model. The maximum cumulative 24 h concentrations were determined to be 132.1, 8.4 and 11.6 µg·m−3for NO2, SO2and PM10over an area of 860 × 800 m2(NCAOR, 2010). In the case of the US Antarctic McMurdo Station, an estimation of the cumulative impact of six generators with capacities of 800–900 kVA each and of other stationary and mobile sources was carried out using the US EPA-(PTPLU) screening steady-state Gaussian model. The maximum hourly and annual average concentrations of SO2, NO2, PM10and some other pollutants downwind of the McMurdo Station were modeled. Based on the simulation results, plots summarizing the maximum potential concentrations as functions of downwind distance from the station in the range of 2 to 50 km were constructed. These confirmed that, within a 2 km distance from the station, the model overestimated pollution levels because the emission sources were artificially grouped at a single point. The results included an annual NO2concentration in excess of 100 µg·m−3, a 3 h average SO2concentration of more than 110µg·m−3and a 24 h average PM10concentration of more than 1100 µg·m−3(National Science Foundation, 1991).
Analysis of the scarce air dispersion modeling data available for diesel generators operating in Antarctica has shown that a direct comparison of results is challenging because of the use of different models and methodologies, as well as a lack of description of input parameters. Thus, to interpret the AERMOD modeling results obtained for the Vecherny Oasis, we examined possible air impacts in this oasis due to generators having the capacity most commonly used.
Currently, a limited range of power generators are used in Antarctica. From two to four units are typically installed at stations, but most often one unit is functioning at any given time while the second is switched on for specific shifts or when increased loads are required, and any additional units are for emergency backup purposes. The most powerful units are installed at the McMurdo Station, comprising three 1500 kW generators and one 1300 kW generator at the main power plant (CEE, 2019). Three primary diesel generator units each with a capacity of 750 kW are installed at the Amundsen-Scott South Pole Station (Secretariat of the Antarctic Treaty, 2007). In addition, diesel generators with capacities in the range of 200 to 400 kW are used at several other stations, although the present analysis shows that units with a capacity of up to 150 kW are currently the most common at Antarctic stations. Based on the power range of these existing diesel generators, using the manufacturer’s specifications data of the most common models and brands should allow preliminary estimates of pollutant emissions and calculations of the pollutant dispersions using the meteorology of the Vecherny Oasis for several hypothetical scenarios. Four scenarios were modeled assuming that current 48 kW/16 kW diesel generators were replaced by diesel generator sets with capacity 125 kW (scenario 1), 200 kW (scenario 2), 400 kW (scenario 3) and 1500 kW (scenario 4). Hourly, daily and monthly emissions estimates were obtained together with estimates of the areas of pollution dispersion and the levels of PM10deposition. The results are summarized in Table 8.

Table 8 Air pollution from the dispersion of emissions from diesel generators having various capacities under their hypothetical installation in the Vecherny Oasis (100% load)
The emissions and impacts of generators with capacities from 16 to 1500 kW (covering most of the power range of Antarctic stations) were calculated, using the same meteorology and assuming the same field season duration of five months. The results showed that the region in which the maximum hourly NO2concentrations exceeded 100 μg·m−3may range from 1.6×10³to 722×103m2, while the areas associated with maximum daily concentrations above 100 μg·m−3could be as large as 27×103m2. The areas with PM10deposition rates above 5 mg·m−2·month−1may be from 14.8×10³to 73.6×10³m2while those with deposition rates greater than 10 mg·m−2·month−1could range from 0.4×10³to 64×103m2.
The area affected by the pollutants is generally proportional to the emission rate of the source, although this relationship is non-linear because the height of the source and other parameters have an effect. This work has demonstrated that such analyses can provide retrospective estimates of the impacts of diesel generators that previously operated at Antarctic stations, as in the case study of the Mount Vechernyaya field base considered herein.
6 Conclusions
Pollutant emissions, surface air concentrations and atmospheric depositions resulting from the operation of diesel generators in the Vecherny Oasis over a period of more than 30 a (from the late 1980s to the present) were estimated. The feasibility of generating such estimates of emissions and environments impacts was demonstrated, based on limited information regarding emissions sources. The diesel engine capacity was used as the primary parameter for the calculation of emissions, as information concerning the capacity of power plants at Antarctic stations is much more accessible than fuel consumption data. This approach will therefore allow more comprehensive estimates in future. Some increases in the uncertainty associated with emissions estimates are inevitable when using this approach, but this drawback is offset by the savings in the time that would otherwise be necessary to collect the pertinent information.
This work also shows the importance of data concerning the quality of fuels used at Antarctic stations when estimating emissions. Such quality parameters are primarily related to the sulfur content in the fuel, which affects the emissions of both sulfur dioxide and particulate matter. Model calculations for the air emissions and impacts of generators with capacities from 16 to 1500 kW were performed for the Vecherny Oasis. This capacity range covers the majority of diesel generators employed in Antarctic stations. The technique examined herein has inherent limitations due to the significant effects of meteorology and, to a lesser extent, the topography and characteristics of the underlying surfaces when modeling pollutant air concentrations. However, this approach appears to represent a promising means of rapidly estimating the impact zones of sources for which there is only limited information available, at least when assessing coastal areas of East Antarctica. In future, the proposed approach will be used to perform retrospective assessments of the environmental impacts of diesel generators on other Antarctic oases.
Acknowledgments The research presented in this article was conducted as part of the State Program “Monitoring of the Earth Polar Regions, Creation of the Belarusian Antarctic Station and Support of the Polar Expeditions for 2016–2020” (Grant no. 20163266).
Albani S, Delmonte B, Maggi V, et al. 2012. Interpreting last glacial to Holocene dust changes at Talos Dome (East Antarctica): implications for atmospheric variations from regional to hemispheric scales. Clim Past, 8(2): 741-750, doi:10.5194/cp-8-741-2012.
Anderson J R, Hardy E E, Roach J T, et al. 1983. A land use and land cover classification system for use with remote sensor data: Geological Survey Professional Paper 964. [2019-11-16]. https://pubs. usgs.gov/pp/0964/report.pdf.
AP-42. 1996.Compilation of Air Pollutants Emission Factors. Vol.1. Stationary Point and Area Sources. 3.3 Gasoline and Diesel Industrial Engines. 5th Edition. (GPO 055-000-00500-1). USEPA. Research Triangle Park, NC. https://www3.epa.gov/ttn/chief/ap42/ch03/final/ c03s03.pdf.
Bory A, Wolff E, Mulvaney R, et al. 2010. Multiple sources supply eolian mineral dust to the Atlantic sector of coastal Antarctica: Evidence from recent snow layers at the top of Berkner Island ice sheet. Earth Planet Sci Lett, 291(1-4): 138-148, doi:10.1016/j.epsl.2010.01.006.
Boutron C F, Wolff E W. 1989. Heavy metal and sulphur emissions to the atmosphere from human activities in Antarctica. Atmos Environ 1967, 23(8): 1669-1675, doi:10.1016/0004-6981(89)90051-6.
Final comprehensive environmental evaluation of the proposed activities: Construction of the Neumayer III Station; Operation of the Neumayer III Station; Dismantling of the existing Neumayer II Station. [2019-11-20]. https://www.ats.aq/ devAS/ EP/ DownloadEvaluation/845.
Comprehensive Environmental Evaluation (CEE). 2012. Final Comprehensive Environmental Evaluation Construction and Operation of the Jang Bogo Antarctic Research Station, Terra Nova Bay, Antarctica. Korea Polar Research Institute. Korea Environment Institute. [2019-10-11]. https://www.ats.aq/devAS/EP/Download Evaluation/1296.
Comprehensive Environmental Evaluation (CEE). 2019. Draft Comprehensive Environmental Evaluation for Continuation and Modernization of McMurdo Station Area Activities. https://www.ats.aq/documents/EIA/02046enFinal%20CEE_McMurdo%20Modernization_v8_05Aug2019.pdf.
European Environment Agency (EEA). 2016. EMEP/EEA Air Pollutant Emission Inventory Guidebook 2016: technical guidance to prepare national emission inventories. EEA-Report, 21.
Fischer H, Siggaard-Andersen M L, Ruth U, et al. 2007. Glacial/interglacial changes in mineral dust and sea-salt records in polar ice cores: Sources, transport, and deposition. Rev Geophys, 45(1): 1-26, doi:10.1029/2005rg000192.
Frey M M, Roscoe H K, Kukui A, et al. 2015. Atmospheric nitrogen oxides (NO and NO2) at Dome C, East Antarctica, during the OPALE campaign. Atmos Chem Phys, 15(14): 7859-7875, doi:10.5194/ acp-15-7859-2015.
Golitsyn G S, Grechko E I, Elansky N F, et al. 1991. Some Soviet measurements of trace gases. Tellus A: Dyn Meteorol Oceanogr, 43(4): 164-175, doi:10.3402/tellusa.v43i4.11945.
GOST 305-58. 1959. Automotive diesel fuel. Technical requirements [ГОСТ 305-58 Топливо дизельное автотракторное. Технические требования].
GOST 305-62. 1965. Automotive diesel fuel. Technical requirements [ГОСТ 305-62 Топливо дизельное автотракторное. Технические требования].
GOST 305-73. 1979. Diesel fuel. Technical conditions. [ГОСТ 305-73 Топливо дизельное. Технические условия].
GOST 305-82. 1983. Diesel fuel. Technical conditions. [ГОСТ 305-82 - Топливо дизельное. Технические условия].
GOST R 55475-2013. 2013. Diesel fuel winter and Arctic dewaxed. Technical conditions [ГОСТ Р 55475-2013. Топливо дизельное зимнее и арктическое депарафинированное. Технические условия].
GOST R 56163-2014. 2014. Air pollutants emission. Methodology of calculation of emission from stationary diesel engines.
Hansen A D A, Lowenthal D H, Chow J C, et al. 2001. Black carbon aerosol at McMurdo Station, Antarctica. J Air Waste Manag Assoc, 51(4): 593-600, doi:10.1080/10473289.2001.10464283.
Huey L G, Tanner D J, Slusher D L, et al. 2004. CIMS measurements of HNO3and SO2at the south pole during ISCAT 2000. Atmos Environ, 38(32): 5411-5421, doi:10.1016/j.atmosenv.2004.04.037.
Kakareka S V, Salivonchik S V. 2015. Use of the AERMOD model in calculating the dispersion of air pollutant emissions from stationary sources. Geog Nat Res, 1:175-184.
Kakareka S V, Kukharchyk T I, Loginov V F, et al. 2016. Construction and operation of Antarctic research stations. An experience of comprehensive environmental evaluation. Minsk: Story Media Proekt, 278.
Koffman B. 2013. Atmospheric dust deposition in West Antarctica over the past two millennia. https://digitalcommons.library.umaine.edu/etd/ 1968.
Koffman B G, Kreutz K J, Breton D J, et al. 2014. Centennial-scale variability of the Southern Hemisphere westerly wind belt in the eastern Pacific over the past two millennia. Clim Past, 10(3): 1125-1144, doi:10.5194/cp-10-1125-2014.
Lambert F, Bigler M, Steffensen J P, et al. 2012. Centennial mineral dust variability in high-resolution ice core data from Dome C, Antarctica. Clim Past, 8(2): 609-623, doi:10.5194/cp-8-609-2012.
Main Directorate of Navigation and Oceanography of the Ministry of Defense of the Russian Federation. 2005. State Scientific Center of the Russian Federation ‘Arctic and Antarctic Research Institute’. Atlas of the Oceans: Antarctica [Атлас океанов: Антарктика].
Matsuki H, Yoshikawa K, Yanagisawa Y, et al. 2002. Measurement of atmospheric NO2concentrations in Antarctica with NO2filter badge and tube. Tokai J Exp Clin Med, 27(2): 35-42.
Mazzera D M, Lowenthal D H, Chow J C, et al. 2001. PM10measurements at McMurdo station, Antarctica. Atmos Environ, 35(10): 1891-1902, doi:10.1016/S1352-2310(00)00409-X.
McConnell J R, Aristarain A J, Banta J R, et al. 2007. 20th-Century doubling in dust archived in an Antarctic Peninsula ice core parallels climate change and desertification in South America. Proc Natl Acad Sci USA, 104(14): 5743-5748, doi:10.1073/pnas.0607657104.
Mihrin L M. 2019. Molodezhnaya. Antarctica. [Молодежная. Антарктика]. 230.
Ministry of Natural Resources of the Russian Federation. 2001. Methodology for calculating pollutant emissions from stationary diesel engines [Методика расчета выбросов загрязняющих веществ от стационарных дизельных установок]. St. Petersburg. http:// gostrf.com/normadata/1/4293852/4293852662.pdf.
Ministry of the Environment the Czech Republic. 2004. A comprehensive environmental evaluation for the Czech scientific station in Antarctica. Construction and operation, final version. [2019-11-01]. 132. https://www.ats.aq/devAS/EP/DownloadEvaluation/1873.
National Academy of Sciences of Belarus. 2015. Construction and operation of Belarusian Antarctic research station at Mount Vechernyaya, Enderby Land. Final comprehensive environmental evaluation. [2019-5-20].https://www.ats.aq/documents/EIA/01693en CEEBelarusMountVechernyaya.pdf.
National Centre for Antarctic and Ocean Research (NCAOR). 2010. Final comprehensive environmental evaluation of new Indian research station at Larsemann Hills, Antarctica.220. [2019-11-9]. https:// www.ats.aq/devAS/EP/DownloadEvaluation/1234.
National Science Foundation. Washington, D.C.
Ratcliffe G, Sheers R, Bonnice J. 2001. Monthly total of fuel used by vehicles at Australian Antarctic Stations.. [2019-1-9]. https://data.aad.gov.au/ metadata/records /SOE_vehicle_fuel_usage.
Saiyasitpanich P, Lu M M, Keener T C, et al. 2005. The effect of diesel fuel sulfur content on particulate matter emissions for a nonroad diesel generator. J Air Waste Manag Assoc, 55(7): 993-998, doi:10.1080/10473289.2005.10464685.
Savatyugin L M. 2001. Russian research in Antarctica (Thirty-first SAE - Fortieth RAE). [Российские исследования в Антарктике (Тридцать первая САЭ – Сороковая РАЭ)]. St. Petersburg, Hydrometeoizdat P III.
Savatyugin L M, Preobrajenskaya M A. 1999. Russian research in Antarctica (First–Twentieth Soviet Antarctic Expedition) [Российские исследования в Антарктике (Первая—Двадцатая Советская Антарктическая Экспедиция)]. St Petersburg, Hydrometeoizdat P I.
Secretariat of the Antarctic Treaty. 2007. Report of Antarctic Treaty Inspections, January 2007: Amundsen-Scott South Pole Station (United States), Concordia (France and Italy) . Report of Inspections undertaken jointly by Sweden, France and New Zealand in accordance with Article VII of the Antarctic Treaty and Article 14 of the Protocol on Environment Protection to the Antarctic Treaty. https://documents.ats.aq/ATCM30/att/ATCM30_att092_e. pdf.
Secretariat of the Antarctic Treaty. 2017. XL Antarctic Treaty Consultative Meeting. The experience in the reduction of the sources of waste generation in the Belarusian Antarctic Expedition. [2017-3-17]. https://documents.ats.aq/ATCM40/ip/ATCM40_ip003_ e.doc.
Secretariat of the Antarctic Treaty. 2019. EIA Database. https://www. ats.aq/devAS/ep_ eia_list.aspx?lang=e.
Shirsat S V, Graf H F. 2009. An emission inventory of sulfur from anthropogenic sources in Antarctica. Atmos Chem Phys, 9(10): 3397-3408, doi:10.5194/acp-9-3397-2009.
The European Parliament and the Council of the European Union. 2008. Directive 2008/50/EC of the European Parliament and of the Council of 21 May 2008 on ambient air quality and cleaner air for Europe. Official Journal of the European Union, L152/1.
Truzzi C, Lambertucci L, Illuminati S, et al. 2005. Direct gravimetric measurements of the mass of the Antarctic aerosol collected by high volume sampler: PM10summer seasonal variation at terra nova bay. Ann Di Chimica, 95(11-12): 867-876, doi:10.1002/adic.200590099.
US Environmental Protection Agency (US EPA). 2004. User’s guide for the AMS/EPA regulatory model—AERMOD. EPA-454/B-03-001. U.S. Research Triangle Park, North Carolina.
US Environmental Protection Agency (US EPA). 2008. AERSURFACE User’s Guide. EPA-454/B-08-001. U.S. Environmental Protection Agency, Research Triangle Park, North Carolina.
Wolff E W, Cachier H. 1998. Concentrations and seasonal cycle of black carbon in aerosol at a coastal Antarctic station. J Geophys Res, 103(D9): 11033-11041, doi:10.1029/97jd01363.
Wolff E W, Fischer H, Fundel F, et al. 2006. Southern Ocean sea-ice extent, productivity and iron flux over the past eight glacial cycles. Nature, 440(7083): 491-496, doi:10.1038/nature04614.
World Health Organization (WHO). 2000. Air quality guidelines for Europe. World Health Organization.
World Health Organization (WHO). 2006. Air quality guidelines: global update 2005: particulate matter, ozone, nitrogen dioxide, and sulfur dioxide. World Health Organization.
4 September 2019;
2 January 2020;
17 March 2020
10.13679/j.advps.2019.0029
: Kakareka S, Salivonchyk S. An assessment of the impacts of diesel power plants on air quality in Antarctica. Adv Polar Sci, 2020, 31(1): 74-87,
10.13679/j.advps.2019.0029
, E-mail: sk001@yandex.ru
杂志排行
Advances in Polar Science的其它文章
- New category, Editorial Opinion, attracts more attention from the international polar community
- Laboratory experimental study of water drag force exerted on ridge keel
- Multi-sensor data merging of sea ice concentration and thickness
- Features of sea ice motion observed with ice buoys from the central Arctic Ocean to Fram Strait
- Characterization of the parent and hydroxylated polycyclic aromatic hydrocarbons in the soil of the Fildes Peninsula, Antarctica
- Atmospheric responses over Asia to sea ice loss in the Barents and Kara seas in mid–late winter and early spring: a perspective revealed from CMIP5 data
