Prediction of nonlinear pilot-induced oscillation using an intelligent human pilot model
2020-01-09ShutingXUWenqianTANXiangjuQUChengZHANG
Shuting XU, Wenqian TAN, Xiangju QU, Cheng ZHANG
School of Aeronautic Science and Engineering, Beihang University, Beijing 100083, China
Abstract This paper proposes a method to predict nonlinear Pilot-Induced Oscillation(PIO)using an intelligent human pilot model. This method is based on a scalogram-based PIO metric, which uses wavelet transforms to analyze the nonlinear characteristics of a time-varying system.The intelligent human pilot model includes three modules: perception module, decision and adaptive module, and execution module. Intelligent and adaptive features, including a neural network receptor,fuzzy decision and adaptation, are also introduced into the human pilot model to describe the behavior of the human pilot accommodating the nonlinear events. Furthermore, an algorithm is proposed to describe the procedure of the PIO prediction method with nonlinear evaluation cases.The prediction results obtained by numerical simulation are compared with the assessments of flight test data to validate the utility of the method.The flight test data were generated in the evaluation of the Smart-Cue/Smart-Gain, which is capable of reducing the PIO tendencies considerably. The results show that the method can be applied to predict the nonlinear PIO events by human pilot model simulation.©2019 Chinese Society of Aeronautics and Astronautics.Production and hosting by Elsevier Ltd.This is an open access article under the CC BY-NC-ND license(http://creativecommons.org/licenses/by-nc-nd/4.0/).
KEYWORDS Pilot-induced oscillation;Human pilot model;Flight simulation;Human-vehicle system;Nonlinear system
1. Introduction
Pilot-aircraft system loss of control in the form of adverse Aircraft Pilot Couplings (APC) including Pilot-Induced Oscillations (PIO) is a persistent aviation safety problem.1,2Despite significant technical advances in this area, PIO continues to occur with both flight-test and operational aircraft.3Based on the actual physical phenomena,PIO can be classified as linear pilot-aircraft system oscillations, quasi-linear pilot-aircraft system oscillations and nonlinear events.A multitude of methods have been elaborated during the years,especially for linear and quasi-linear PIO prediction and suppression.4,5Human pilot models have also been developed to use for the linear and quasi-linear PIO study, such as McRuer quasi-linear model, Hess structural model and neural networks pilot model.6-10However nonlinear PIO events are difficult to recognize, but are always severe.11-13
The essential element for nonlinear PIO events to appear is commonly accepted to be a trigger event of sudden changes in the aircraft dynamics, control/actuation system elements or pilot-biomechanics. These sudden changes will cause timevarying characteristics of the system. To advance this critical issue,Klyde et al.14,15proposed a scalogram-based PIO metric and used wavelet-based analysis to identify nonlinear PIO in a real-time flight test environment. The time-varying information obtained by the wavelet technique is meaningful for the research of nonlinear PIO prediction.
Currently, the investigation of the nonlinear PIO metric is mainly assessed by flight test data. While the flight test results may vary with individuals, a parametric model of the pilot behavior that covers a broad range of behavior would be needed for valuable and reliable PIO proneness prediction of the aircraft. On the one hand, based on the scalogram-based PIO metric, the model can be examined in order to predict for subsequent experiments. On the other hand, using the human pilot model simulation to predict the nonlinear PIO can expand the application of the prediction method.
In the existing literature, the nonlinear PIO has been studied by establishing a pilot model adapting to sudden changes in aircraft dynamics.16,17The pilot model is a variable structure and segmented model.The key feature of the model is afforded by varying two gain parameters in each control loop to accommodate pilot adaptation.This pilot model has been intensively investigated in the presence of flight control anomalies or system failures.18,19However, considering that the intelligent adaptive controller and smart inceptor are the current key means to mitigate the pilot-aircraft system loss-of-control in the form of nonlinear PIO,an intelligent pilot model is needed to describe the intelligent and adaptive characteristics of the human pilot and explain the APC mechanism more reasonably.
This paper aims to propose a novel method for predicting nonlinear PIO using an intelligent human pilot model.In consideration of the human pilot to accommodate nonlinear events, the model emphasizes intelligent and adaptive characteristics including a neural network receptor, fuzzy decision and adaptation. The intelligent pilot model adopts variable structure to accommodate pilot adaptation, and what’s more,it takes the pilot’s visual perception, intelligent decision and force feedback via the control inceptor into account.It is noted that the key of the model is the decision behavior of the human pilot. When the nonlinear PIO is triggered, the human pilot makes judgments and takes decisions based on fuzzy logic,and then changes his/her control behavior to adapt to the new situation. Furthermore, an algorithm is put forward to describe the procedure of the nonlinear PIO prediction. The prediction results of scalogram-based PIO metrics through offline simulations are compared with the recorded assessments of the flight test data.Numerical simulation and flight test data results are given to investigate the validity of the prediction method.
2. Scalogram-based PIO metric description
A scalogram-based PIO metric based on flight test data has been proposed by Klyde et al.14This metric uses wavelet transforms to identify causes for nonlinear PIO events.
One of the typical characteristics for nonlinear PIO cases is that these are time-varying. Wavelets allow for a new way of analyzing time-varying systems. The wavelet techniques can show the time-frequency localization of an amplitude abnormality in a system, rather than just an amplitude versus frequency relationship averaged over an entire time history.The amplitude frequency was developed to utilize this timevarying auto-spectrum to illustrate the differences in the frequency and intensity of signals as a function of time. This intensity has been shown to differentiate from run to run and between pilot and pilot in piloted aircraft control tasks.
The scalogram-based PIO metric generates a wavelet-based scalogram from a time-varying measurement of peak input amplitude and plots it against a weighted phase lag.Fig.1 provides an outline of the pilot-aircraft system, including the human pilot, the inceptor and the aircraft. The target signal is c(t), the control inceptor force is F(t) and the output signal is y(t). The human pilot model is YH(ω), the inceptor is YI(ω), and the aircraft controlled element dynamics are indicated by YC(ω) as shown in Fig. 1.
The wavelet-based scalogram of the inceptor force F(t) is the scalogram P( ω ,t).It is inceptor amplitude versus both frequency and time. The inceptor peak amplitude of P(ω ,t) versus time is

where ωmax(t) is the frequency at which the maximum amplitude occurs. The phase lag φ(ω,t) of the aircraft dynamics YC(ω) at the frequency ωmax(t) is

In order to present a better visual comparison using inceptor peak amplitude Pmaxversus weighted phase lag φmax, a weighted form of both frequency and phase takes into account the spread across frequency of the amplitude. The weighting functions are

In order to be an effective PIO metric, the inceptor peak amplitude needed to be normalized. Here, the PIO historical data from Ref.14were considered. These data indicate that most of the pitch and roll severe events occurred with stick forces in the 155.687 to 177.928 N peak-to-peak range. Thus,the peak amplitude Pmaxis repeated with the 77.8 N normalizing factor applied.
Taking the weighted form and nonlinear time-varying scalogram into account, the scalogram-based PIO metric can be considered as an extension of the existing PIO prediction criteria in the frequency domain such as Ref.20. Because the wavelet-based methods can provide a technique for real time implementation, the scalogram-based PIO metric is feasible to analyze time-varying as well as time-invariant systems.The results for four examples are presented in Fig. 2. Here,point A represents a time-invariant system, which is not susceptible to PIO. Point B shows a time-invariant system of PIO proneness. Curve C indicates a time-varying system to be PIO susceptible. Curve D is a time-varying system which is not prone to PIO.The example results are clearly differentiated in the inceptor peak amplitude Pmaxversus weighted phase lag φmax.

Fig.1 Outline of pilot-aircraft system.
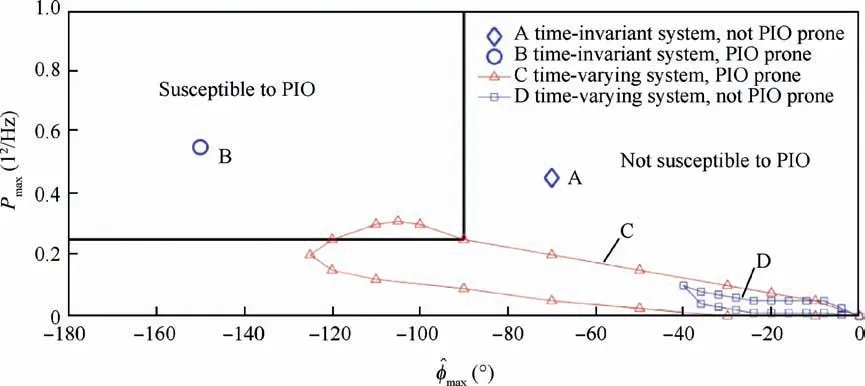
Fig.2 Examples for scalogram-based PIO metric.
Currently, the scalogram-based PIO metric is utilized to identify the PIO in a real-time flight test environment. The flight test data of this metric are generated in the evaluation of the Smart Cue/Gain PIO mitigation to assess the utility of this approach.21Smart-Cue/Smart-Gain system, namely a smart inceptor implemented in the aircraft, is a means to mitigate nonlinear PIO involving control surface rate limit. The Smart-Cue provides force feedback to the human pilot via the control inceptor based on a position error between ideal linear system surface position and actual surface position,and the Smart-Gain takes advantage of the command path gain adjustments based on the same measured position error to attenuate the pilot input,thus reducing pilot-aircraft system loss of control. In order to develop the theoretical application of this metric, we propose a human pilot model as follows.
3. Human pilot model
The fundamental consideration behind the human pilot model to be discussed is the adaptation of the human pilot to the nonlinear PIO. Herein the nonlinear PIO is related to actuation system, that is the actuator rate limit reduced.22,23The rate limit itself can be the cause of category II PIO,while the actuator rate limit reduced may cause the nonlinear pilot-aircraft system oscillations. Based on the intelligent pilot-aircraft system theory,24human pilot behavior is separated into three elements: perception module, decision and adaptive module, and execution module, as shown in Fig. 3. Visual perception and tactile feedback are considered in this paper on account of the pilot-aircraft interface.In order to simplify the pilot model properly, the motion feedback in vehicular control is neglected. Here, the closed-loop system is driven by an error that is the difference between the command signal and the actual output to be shown on the flight display. The display delivers the information to the visual perception modality.The position error signal δerr, which is the difference between the ideal linear system response and the actual manual flight control system response, is perceived by the human pilot via the tactile cue from the Smart-Cue/Smart-Gain system.It represents the extent of actuator rate saturation.The information is processed by the central nervous system to drive a process which generates an intelligent control action. The intelligent control action reflects the fuzzy and adaptive feature of the human pilot.Then the control action is executed via the forces generated by the muscles in the neuromuscular system and exerted on the Smart-Cue/ Smart-Gain system. The Smart-Cue/Smart-Gain system also provides feedback signals through displacements to the neuromuscular system. Output signals from the Smart-Cue/Smart-Gain system are used to help the actuation system to provide the appropriate movement of the control surfaces. These cues effectively close the feedback control loops.
As shown in Fig. 3, c is the command input signal, e is the error signal,ecis the error signal through the display interface,i
s the error signal through the visual perception,y is the output signal(such as pitch angle or bank angle),xtis the output of central nervous system of the human pilot,F is the inceptor force,δsis the inceptor position,is the output of the Smart-Cue/Smart-Gain system, and δerris the position error cue which is the difference between the ideal linear system response and the actual manual flight control system response.
3.1. Perception module
The perception system is a primary source for guidance and control information for the human pilot. Visual cues include the display of the pitch angle,flight path angle,altitude,speed and other instruments of the aircraft.As the human perception is subject to the physiological conditions, it is impossible to create a precise unit mapping of perception information in the brain. The flight test shows that the human pilot will not apply control actions with small errors. This could also be the result of the pilot deciding to ignore small errors.25It indicates that there exists a threshold in the perception mechanism of the human.Therefore,the perception module should reflect the nonlinearity of the threshold.

Fig.3 Block diagram of pilot-aircraft system.
In the analysis of the human perception, the perception mechanism can be regarded as an interacted module of the neurons of the receptor and the original signal in the neural network. The model is developed to represent the visual perception (Fig. 4). The input signals include the absolute value of the command and the threshold b. w(1,1) represents the weight of the input signals.Here the value is 1.The abs represents the absolute value of the error ecand the form is |u|.When the absolute value of the input signals is less than the threshold b,the output of the receptor is 0.Otherwise the output of the receptor is 1.The final output is the product between the receptor output and the command input. Therefore, the effects of the perception module represent the human pilot capacity of the perception when the threshold is taken into account.
In the perceptual module, physiological experiments indicated that with good display illumination and contrast, the eyes of the human could distinguish the black line to 0.01 drad(1 rad=10 drad).26Therefore, the threshold b of the visual perception is set to 0.01 drad in the following.
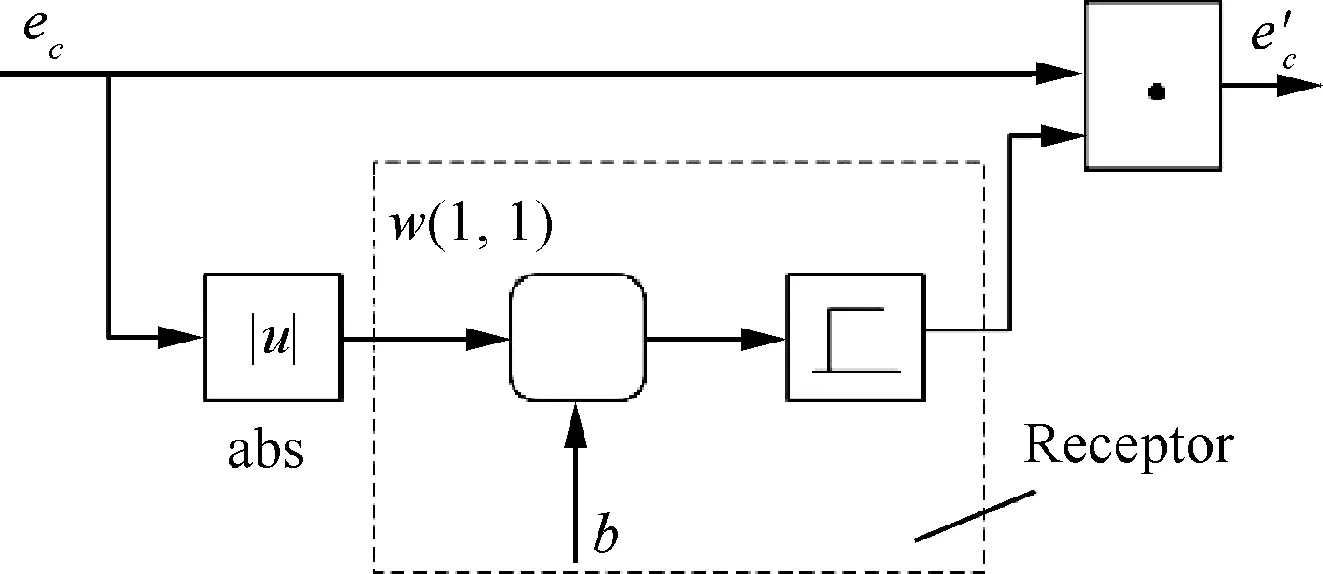
Fig.4 Visual perception module.
3.2. Decision and adaptive module
The decision and adaptive module of the human pilot model reflects the fact that pilots need to make judgments and take decisions to adapt to the time-varying system when the nonlinear PIO is triggered. The human pilot decision behavior is to decide whether to change the control action according to the input of the current decision information. In the decision and adaptive module, we analyze the human pilot decision and adaptive behavior with the theory of fuzzy logic and adaptive control. The block diagram is shown in Fig. 5.
According to the decision theory, the input of the decision information in this paper mainly includes the error informationobtained from the visual display, position error cues δerrfrom the Smart-Cue/ Smart-Gain system and the flight state ˙y of the aircraft.Here, ˙y is used to define the error signal in the inner rate loop (R- ˙y). Based on the simplified structural model of the pilot, only two variables parameterize the model,the gains Kpand Kr.Here,the adaptation of the human pilot is afforded through the adjustments of the gains Kpand Kr.And the time of adjustments is based on the fuzzy decision.
In the process of the human pilot’s making decision, it is difficult for the human pilot to recognize the nonlinear situation accurately. The sensing process of the nonlinear situation is based on the human pilot’s experience, which is affected by his subjectivity.This is the fuzziness of the human pilot in decision module.Fuzzy logic control theory provides a mathematical technique to account for this behavior.

Fig.5 Fuzzy decision and adaptive module of human pilot.
In case of establishing a fuzzy decision model of human pilot, the position error cues δerrfrom the Smart-Gain system are utilized to determine the input variables of the fuzzy decision model. Here, a criterion signal x is defined as

The variable x was normalized and defined as

Here, the criterion signal x is related to the position error δerrof the Smart-Gain system. It is the key function of the Smart-Gain system. z is defined as the input variables of the fuzzy decision model. The rms represents the root mean square. The output variables are defined as the probability of trigger as it represents whether the human pilot changes his/her control behavior.
Based on the fuzzy logic control theory, the fuzzy sets are supposed to describe the input and the output,which are listed in Table 1. The fuzzy sets ‘‘RS” and ‘‘NS” define a small and large value of z. Besides, ‘‘TR” and ‘‘NT” represent the low and high probability of trigger, respectively.
A central value 3 of the fuzzy-set input range [2.72, 3.28]was chosen as it would represent an instantaneous‘‘3-σ”value,which was mentioned in Ref.14.It indicates that human’s judgment of things conforms to normal distribution.27Obviously,a too small trigger value would cause normal system disturbances (e.g., turbulence) to initiate unwanted pilot model adaptation,whereas a too large value would inhibit adaptation when it is needed.14The variable range[2.72,3.28]is based on the human pilot’s perception error characteristics.28The noise intensity of the human pilot is taken as

Here, Pzis full attention observation noise ratio with the value of 0.01. E{z2} represents the expected value of z2and the value is 9. Then the noise intensity of the human pilot is 0.28 and the variable range of the human pilot’s perception error is [2.72, 3.28].
The employed fuzzy rule sets are asserted in IF-THEN form as

Then the changes of human pilot behavior in Krand KPdefined as ΔKpand ΔKrare shown in Table 2. These gain values are obtained from the study of Klyde et al.14and are based upon simple frequency-domain procedures. Krand Kprepresent gains on the output error and the difference (R- ˙y),respectively. The initial value of Kris chosen as the gain value that results in a minimum damping ratio of ξmin=0.15 for any oscillatory mode in the inner closed-loop transfer function ˙y/R in Fig. 5. The initial value of Kpis chosen to provide a desired open-loop crossover frequency for the entire pilot model. The nominal value of this crossover frequency is 2.0 rad/s.

Table 1 Fuzzy sets.

Table 2 ΔKp and ΔKr parameter set.
Finally, the human pilot control action can be obtained by the generated decision.
3.3. Executive module
Handling qualities and flight control system engineers have considered that the basic dynamics and precision of manual control are critically limited by the properties of the neuromuscular system. In the previous research of manual control, the pilot’s manipulator can be control wheel/columns or a passive side-stick,and the neuromuscular dynamics are represented by second-order transfer functions.Due to the simplifications,the model has lost a certain degree of realism and is incapable of reflecting the feedback information from the inceptor.
When the Smart-Cue/Smart-Gain system is implemented in an aircraft, the human pilot’s arm will adapt to the inceptor dynamics through the neuromuscular system. Therefore, in this executive module, the correlation between the neuromuscular system and the smart inceptor (including Smart-Cue/Smart-Gain system) is taken into account. The model of the neuromuscular system is partly based on models available in Ref.29, which can be used for analysis and design of smart inceptors. The model is combined with models for the skin flexibility and the limb inertia, and a neural feedback in the control of the neuromuscular system. The neural feedback enables the human pilot to modify the effective properties.For the Smart-Cue/Smart-Gain system, we design the model for a condition in which the human pilot does not need the reflexive feedback paths, that is, the neuromuscular system properties are set as measured in a relaxing task.30

Fig.6 Neuromuscular system module.
Fig. 6 shows the components of the neuromuscular system module. The module contains the skin flexibility model(damping and elasticity component Bcand Kc),a Parallel Elastic Component (PEC) (elasticity Kpec), a Contractile Component (CC) (damping and elasticity component Bmand Km),the Series Elastic Component(SEC)(elasticity Ke),and neural feedback.
In the neuromuscular system module, the input xtis taken to be a target or reference position for the limb. The output is the force F exerted by the pilot.The inceptor position δsis as a feedback signal to the skin flexibility model, which reflects the correlation between the neuromuscular system and the inceptor.qnis a corrective muscle activation,which is added to form the total control signal qm.The contractile component position is xm. A feedback to the submodels (SEC, PEC and skin flexibility model) is provided by the limb position xl. External forces Feand Fpare acting on the muscle, skin and limb.
The neuromuscular system parameters adopted here were obtained from Ref.29, as shown in Table 3. The values of the parameters are fixed and they describe the intrinsic properties of the neuromuscular system.
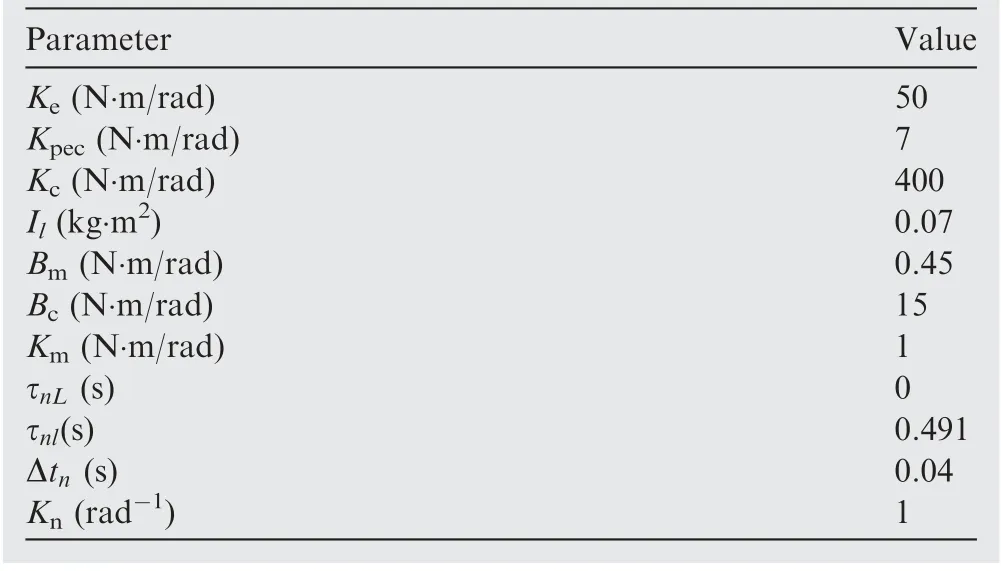
Table 3 Parameter values of neuromuscular system.
From the above, the human pilot model can now be established based on the three modules. It should be noted that the adaptation of the human pilot is reflected in the adjustments of the gains Kpand Kr, which is the focus of the human pilot model. The changes of the gains Kpand Krwill be discussed in Section 7.
4. Aircraft system with inceptor model
The aircraft system with inceptor block diagram is shown in Fig.7.Here F is the inceptor force and δsis the inceptor position.δcandare the input and output of the Smart-Gain system.δ is the actuator output and δerris the position error.The inceptor and aircraft system are described in this section.
4.1. Inceptor description
The inceptor includes Smart-Gain system and feel system, as shown in Fig. 7. The Smart-Gain system was designed to address loss of control scenarios associated with control surface actuator rate limit.21
The Smart-Gain is a distinct structure that adjusts the gain applied to the inceptor position input.14The magnitude of the gain depends on the measured position error and is activated when the measured position error exceeds a threshold value.Here,the position error δerris defined as the difference between an ideal linear system surface position and an actual surface position as shown in Fig. 7. The gain is then reduced linearly as a function of the measured position error until it reaches a prescribed minimum value. With the Smart-Gain, the pilot input is attenuated. The Smart-Gain mechanization selected for this paper is shown in Fig. 8.
The longitudinal feel system dynamics for the inceptor is modeled as a second-order system. The feel system transfer function is provided in Table 4.31
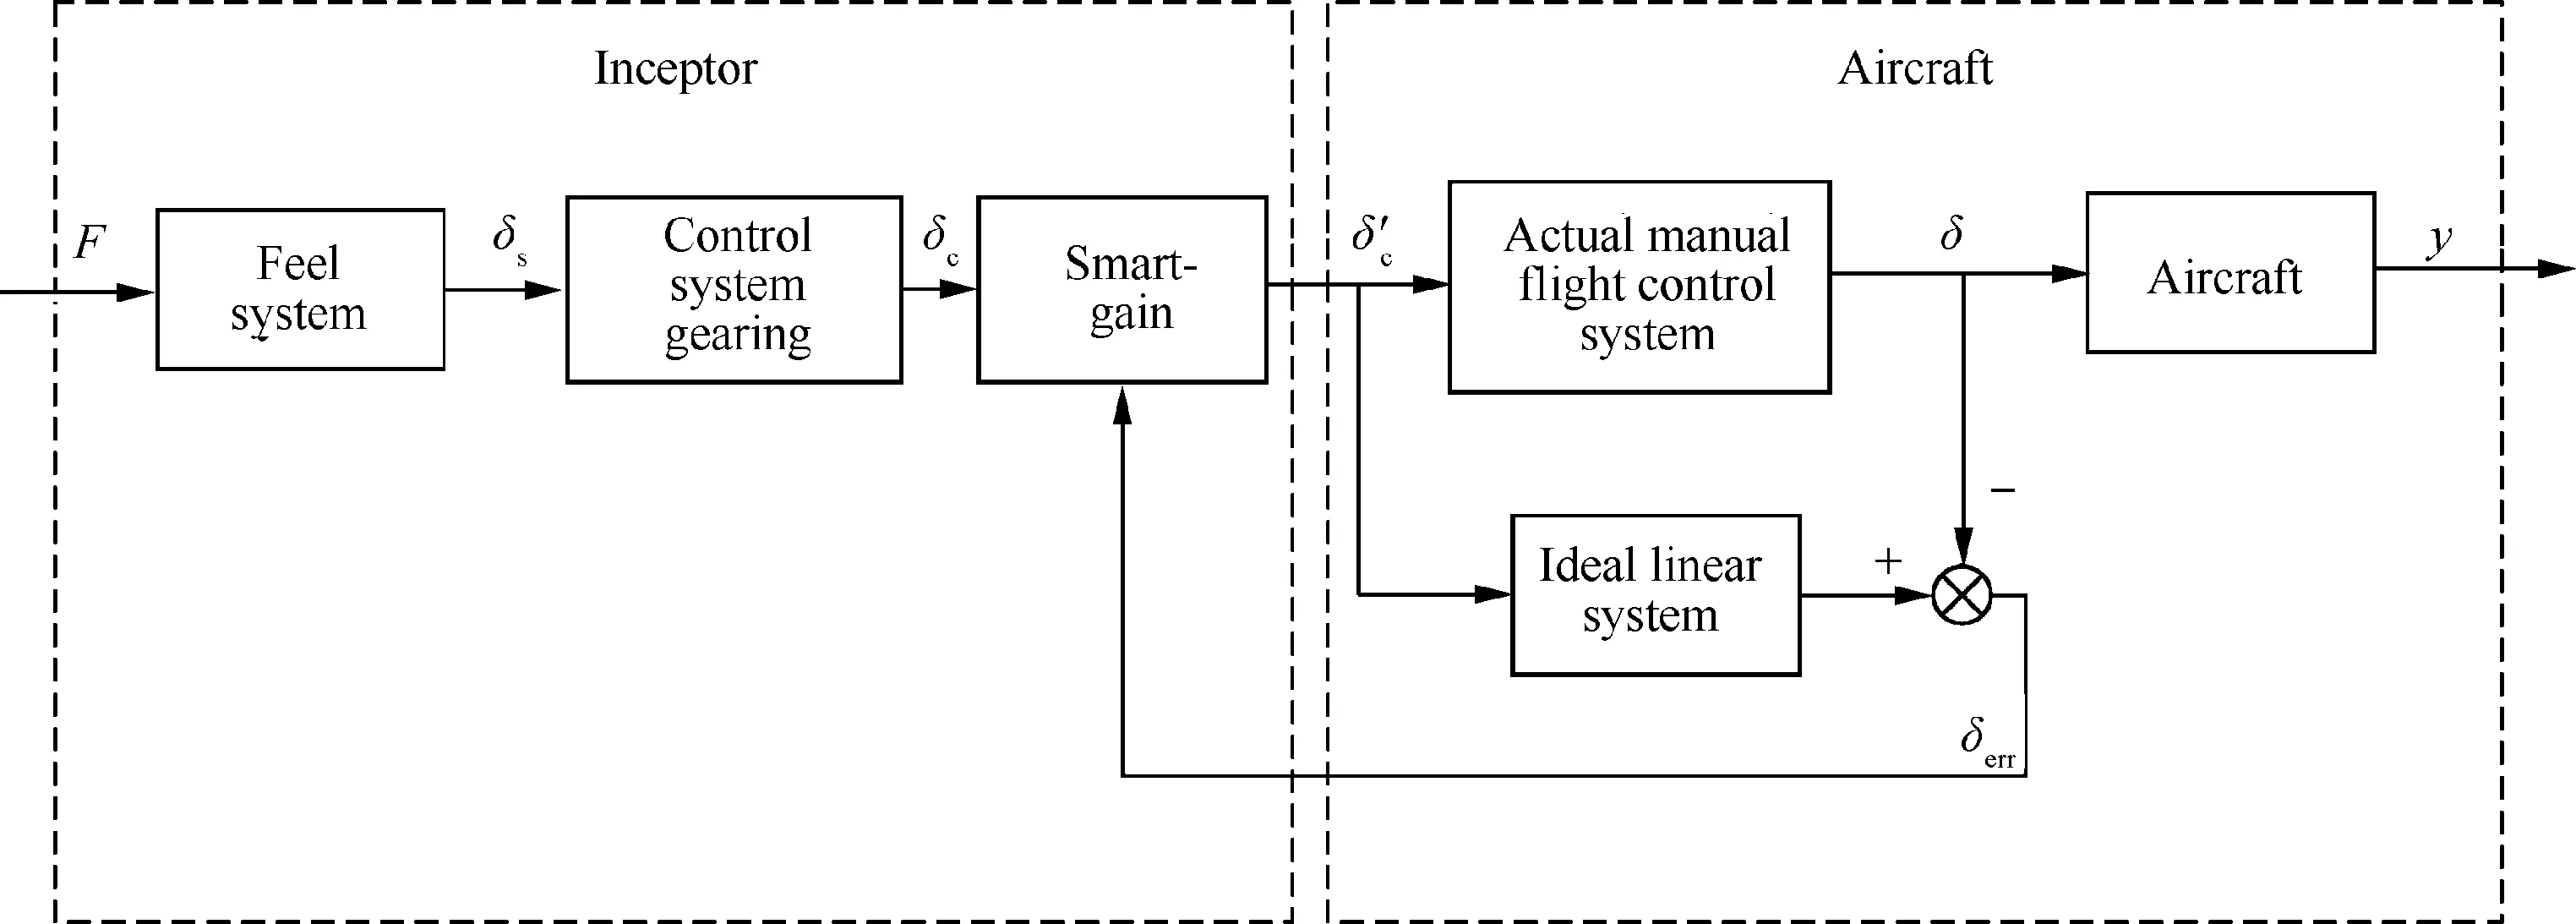
Fig.7 Block diagram of aircraft system with Smart-Gain system.

Fig.8 Smart-Gain mechanization.

Table 4 Feel system characteristic parameters31.
4.2. Aircraft system description

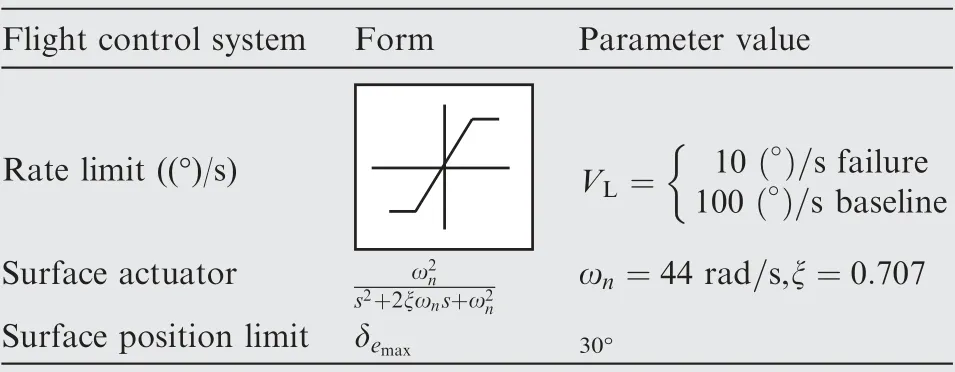
Table 5 Parameters of flight control system.
5. Algorithm and simulation verification
This section describes an algorithm for predicting nonlinear PIO using the intelligent human pilot model. The simulation results of three evaluation cases will also be presented.
5.1. Algorithm
The algorithm developed for the prediction of nonlinear PIO using the intelligent human pilot model follows four steps as shown in Fig. 9.
Step 1. Based on the pilot-aircraft system simulation(Fig. 3), the time histories from the simulation model are obtained to analyze the pitch attitude response, the actuator response and the inceptor force response.

The key control system elements downstream of the Smart-Gain are identified in Table 5.They mainly include surface rate limit, surface actuator, and surface position limit. The surface
Step 2.Wavelet transforms are utilized to describe both the time and frequency characteristics of the inceptor force of human pilot.
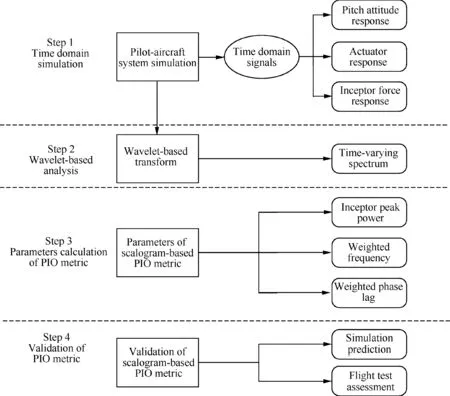
Fig.9 Algorithm steps.
Step 3. On the basis of the wavelet-based scalogram, the parameters of the scalogram-based PIO metric are calculated for inceptor peak amplitude Pmax, weighted frequency ^ωmaxand weighted phase lag ^φmaxin Eqs. (1)-(4).
Step 4. The parameters of the scalogram-based PIO metric are applied to calculate this metric. Prediction results of the simulations are compared with assessments of the flight test data to verify and validate the method.
5.2. Simulation results
In the flight test of a team led by Systems Technology,Inc.,14a pitch tracking task was used to ensure that the human pilot tracked the displayed attitude command and attempted to keep errors within the specified tolerances. Sum-Of-Sines(SOS)command signals were selected as these force the human pilot to continuously apply control inputs.
Pitch evaluation configurations are provided in Table 6.For Case 1, the baseline configuration was found to be PIO free for the task.Case 2 is called rate limit only configuration,in which the control surface rate limits are reduced at the time of 20 s. Finally, Case 3 is the reduced rate limit with Smart-Gain configuration, which was set to mitigate the rate limit.

Table 6 Evaluation pitch configurations.
In this paper,we select the flight task and evaluation configurations which are consistent with the aforementioned flight test14. Details of the simulation results of the developed algorithm for the three evaluation cases are reported in the following.
(1) Case 1
The resulting time histories for algorithm Step 1 are shown in Fig. 10(a), Fig. 10(b) and (c). They describe the pitch attitude, actuator and inceptor force responses of the aircraft for human pilot model simulation of Case 1. Note that the pitch attitude tracking result follows the command signal quite accurately. The rate limit is not activated.
The result for algorithm Step 2 is given in Fig.10(d).It presents the wavelet-based scalogram of inceptor force.The scalogram shows a small peak input amplitude of inceptor force.
The parameters of the scalogram-based PIO metric for algorithm Step 3 are illustrated in Fig. 10(e), (f) and (g). They represent the inceptor peak amplitude Pmax, the weighted frequency ^ωmaxand the weighted phase lag ^φmax, respectively.
(2) Case 2
The results for algorithm Step 1 (see Fig. 11(a)-(e)) reveal the occurrence of a PIO observed as sustained oscillations in the system response and a saturated elevator rate after the rate limit is reduced(t=20 s).Fig.11(c)and(d)are the magnification of pitch attitude response and actuator response, respectively. We can see the obvious triangle wave.
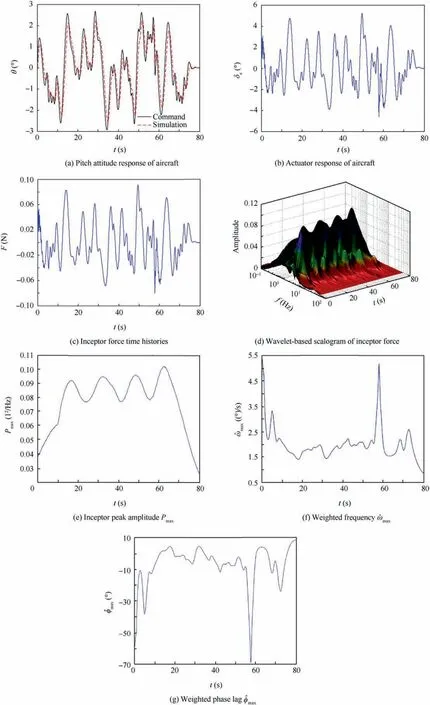
Fig.10 Simulation results for Case 1.
The wavelet-based scalogram of inceptor force for algorithm Step 2 is shown Fig. 11(f). It can be seen that the reduction in rate limit causes the inceptor force to increase,resulting in much larger scalogram magnitudes for the time period considered.
In addition, inceptor peak amplitude Pmax, weighted frequency ^ωmaxand weighted phase lag ^φmaxfor algorithm Step 3 are shown in Fig. 11(g), (h) and (i), respectively.
(3) Case 3
When the Smart-Gain is used to alleviate the oscillation,the resulting time histories for algorithm Step 1 are shown in Fig. 12(a)-(c). It can be observed that the pitch attitude response of the aircraft (Fig. 12(a)) is close to the response of Case 1.
The wavelet-based scalogram of algorithm Step 2 (Fig. 12(d)) shows a significant reduction of peak amplitude as compared to Case 2. This reflects that the intelligent pilot model with Smart-Gain can indeed improve the handling qualities and reduce or eliminate the tendency for a PIO to occur.
Moreover, inceptor peak amplitude Pmax, weighted frequency ^ωmaxand weighted phase lag ^φmaxfor algorithm Step 3 are seen in Fig. 12(e)-(g), respectively.
5.3. Validation of prediction method based on scalogram-based PIO metric
To validate the prediction method based on scalogram-based PIO metric, the simulation and flight test data results are compared.
In the flight test of the team led by Systems Technology,Inc.,14the test pilots are experienced. The crew for the checkout and evaluation flights consisted of a Calspan Safety Pilot(SP), an Evaluation Pilot (EP), a Calspan flight test engineer,and the STI flight test conductor.The flight test database used herein was generated during the Smart-Cue/Smart-Gain flight test campaign that was part of a Phase II Small Business Innovation Research program conducted by STI for NASA Armstrong Flight Research Center.14
Details of the results for algorithm Step 4 of three cases are presented in this section.
(1) Case 1
The scalogram-based PIO metric prediction results for human pilot model simulation and flight test in Case 1 are shown in Fig.13.For the simulation results,Case 1 clearly represents no-PIO tendency.
Note that the prediction result of human pilot model simulation tends to be close to the flight test. For Case 1, the prediction of the scalogram-based PIO metric using the human pilot model is feasible.
(2) Case 2
The simulation prediction results of Case 2 are shown with the flight test in Fig. 14. For this simulation results, the PIO tendency is identified based on the human pilot model.
Note that there are three sets of test pilot data and four assessment curves used in the flight test results.In comparison to the flight test, it can be seen that the prediction results obtained by the pilot model lie within the same range of values as the actual flight test data.
(3) Case 3
The prediction results of scalogram-based PIO metric for human pilot model simulation and flight test data for Case 3 are shown in Fig. 15. For the simulation and flight test data results, no PIO tendency is noted.
For this case, it can be seen that the weighted phase given by the human pilot model are consistent with the flight test data. Differences in the inceptor peak amplitude can be expected to become smaller from adjustments in the pilot gain of the model, to better match the flight test results.
6. Application of prediction method to a roll configuration
An application of the prediction method will be considered on a roll configuration. The roll configuration is given as14

In the flight test of the team led by Systems Technology,Inc.,14a bank angle capture and hold task was used to evaluate the ability and identify the maneuverability limitation and PIO tendencies.
Roll evaluation configurations are provided in Table 7.For Case 4,the baseline configuration was found to be PIO free for the task.Case 5 is called rate limit only configuration,in which the control surface rate limits are reduced at the time of 20 s.Finally, Case 6 is the reduced rate limit with Smart-Gain configuration, which was set to mitigate the rate limit.
In this paper, we select the roll flight task and evaluation configurations which are consistent with the flight test data.14Details of the simulation results for the three roll evaluation cases are reported in the following.
6.1. Simulation results
(1) Case 4
The resulting time histories for Case 4 of algorithm Step 1 are shown in Fig. 16(a)-(c). They describe the roll attitude,aileron and roll inceptor force responses of the aircraft for human pilot model simulation. Note that the roll attitude tracking result follows the command signal quite accurately.The rate limit was not activated.
The result for algorithm Step 2 is given in Fig.16(d).It presents the wavelet-based scalogram of the roll inceptor force.The scalogram shows a small peak input amplitude of the roll inceptor force.
The parameters of the scalogram-based PIO metric for algorithm Step 3 are illustrated in Fig. 16(e)-(g). They represent the inceptor peak amplitude Pmax,the weighted frequency^ωmaxand the weighted phase lag ^φmax, respectively.
(2) Case 5
The results for algorithm Step 1 (see Fig. 17(a)-(c)) reveal the occurrence of a PIO observed as sustained oscillations in the system response and a saturated aileron is saturate after the rate limit is reduced (t=20 s).
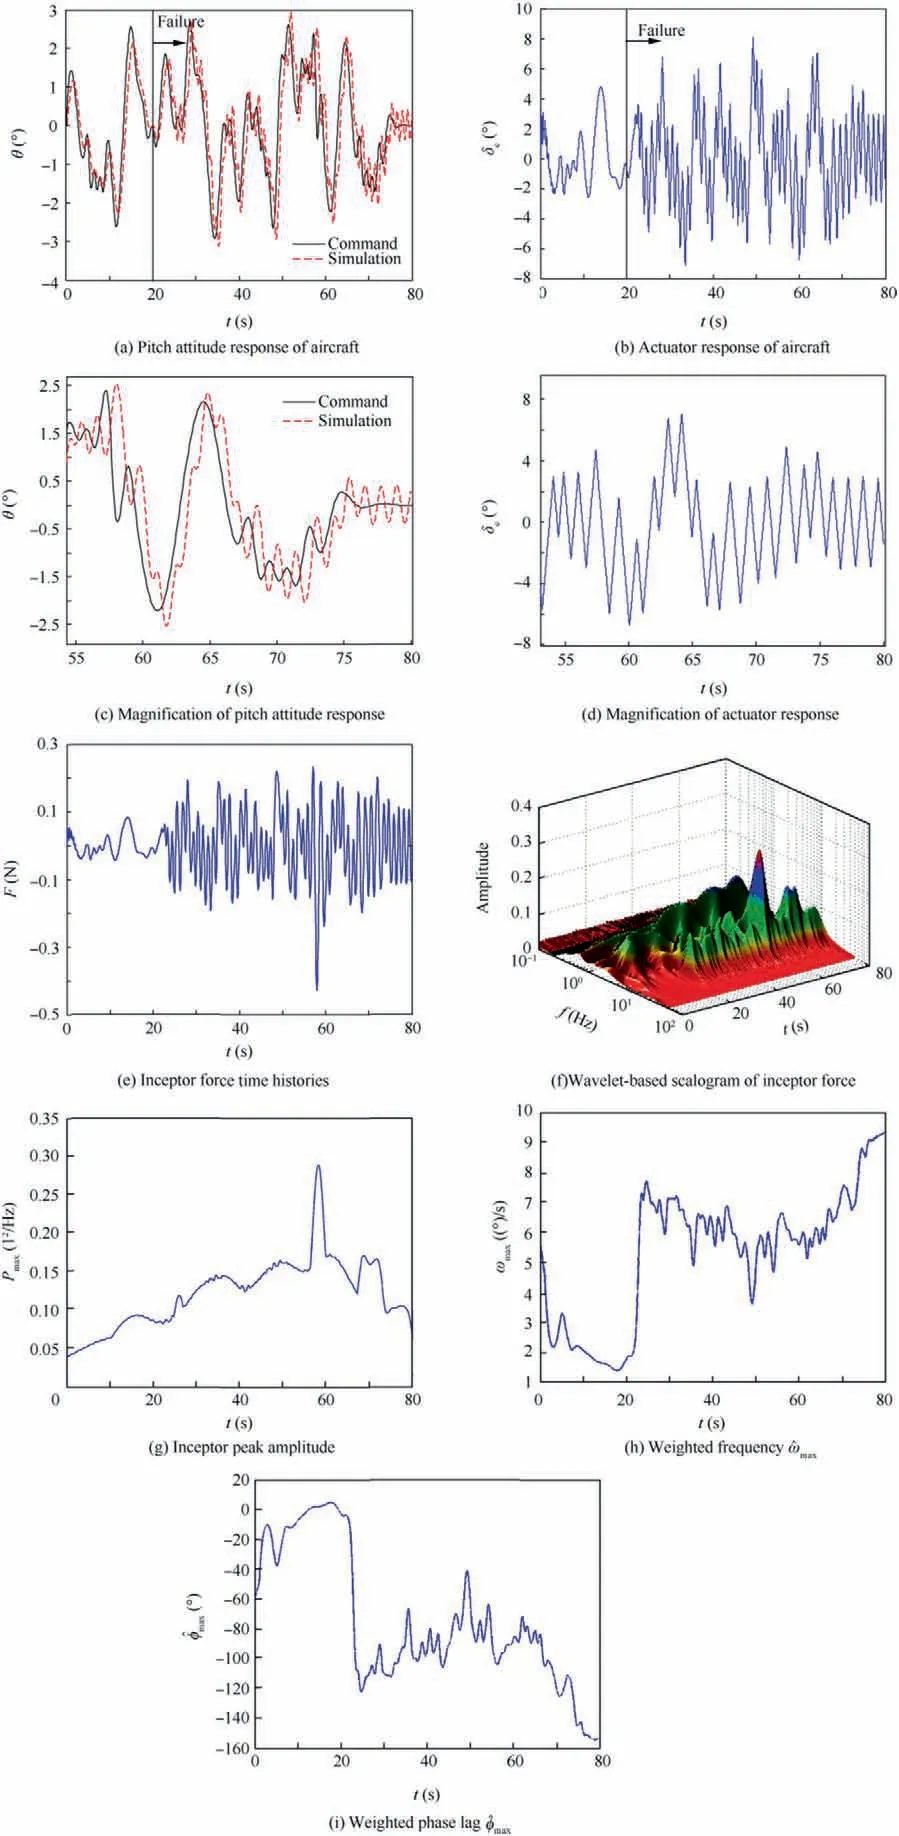
Fig.11 Simulation results for Case 2.

Fig.12 Simulation results for Case 3.
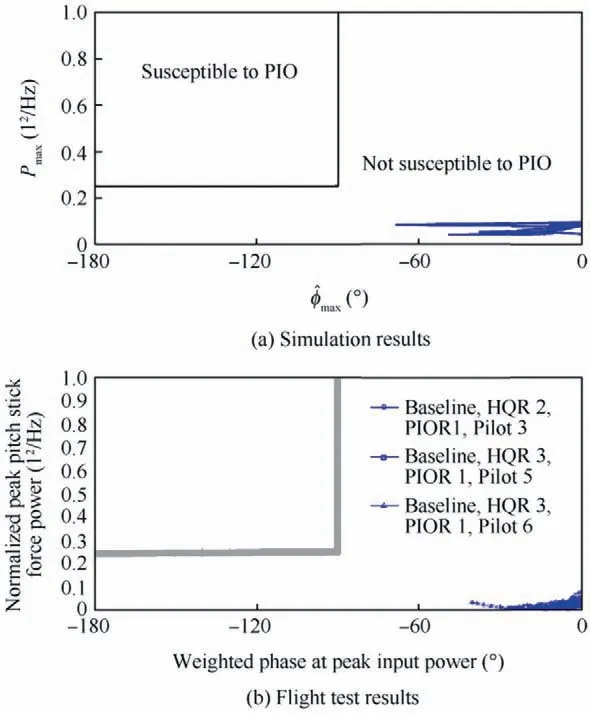
Fig.13 Scalogram-based PIO metric applied to Case 1.
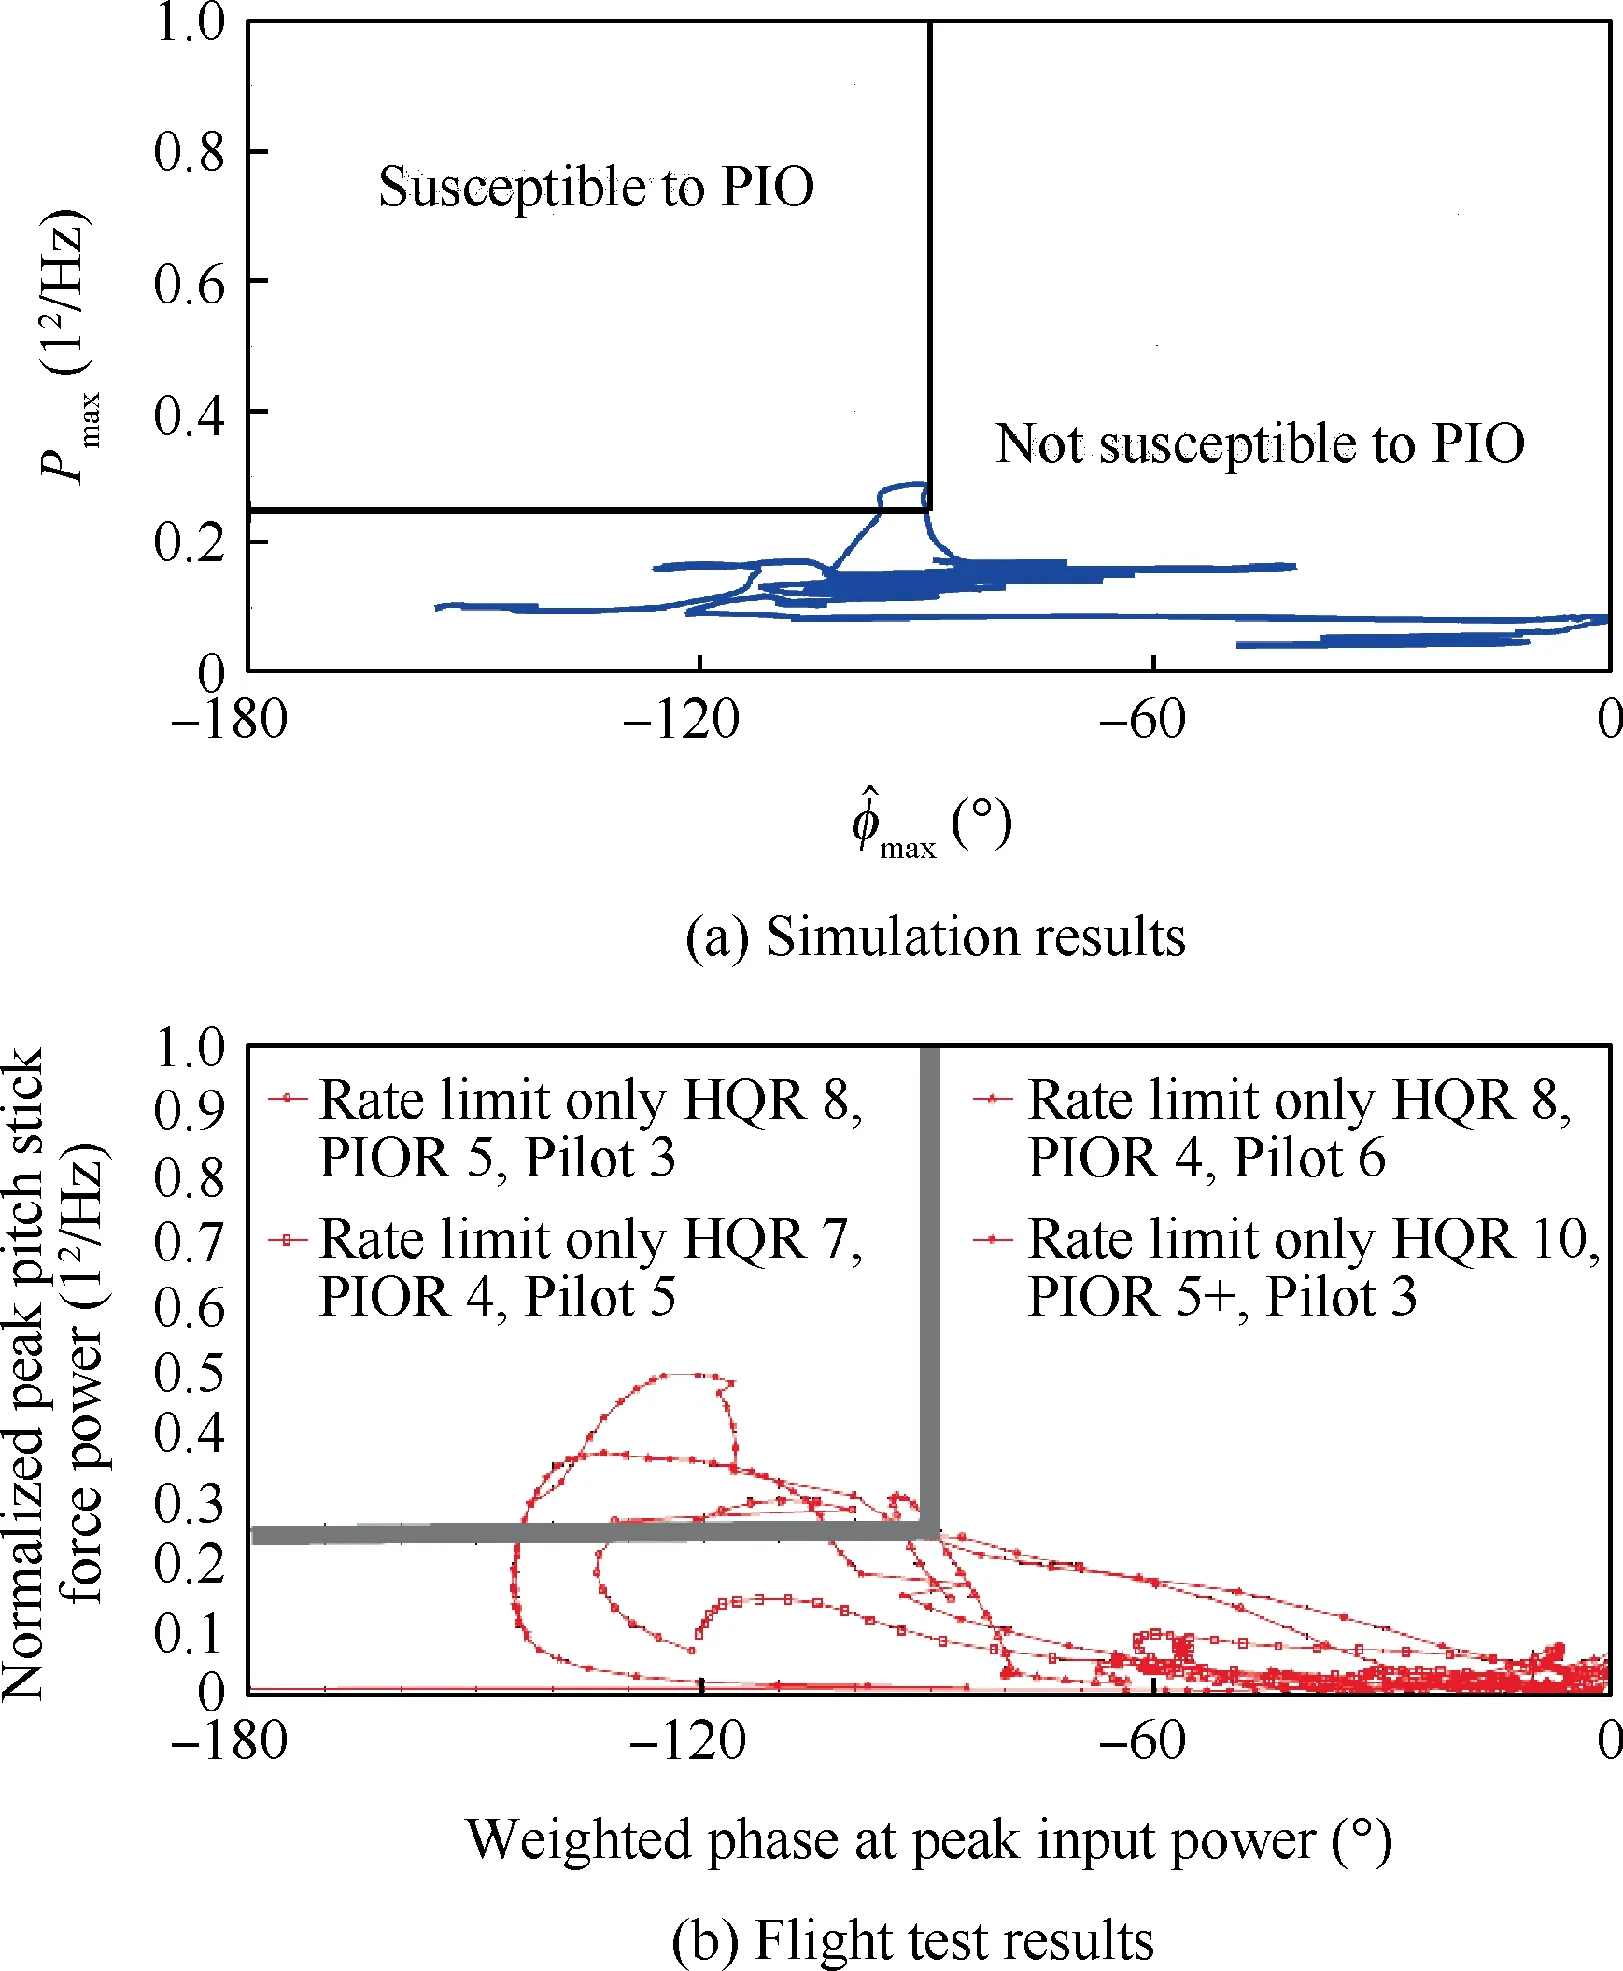
Fig.14 Scalogram-based PIO metric applied to Case 2.
The wavelet-based scalogram of roll inceptor force for algorithm Step 2 is shown in Fig. 17(d). It can be seen that the reduction in rate limit causes the inceptor force to increase,resulting in much larger scalogram magnitudes for the time period considered.
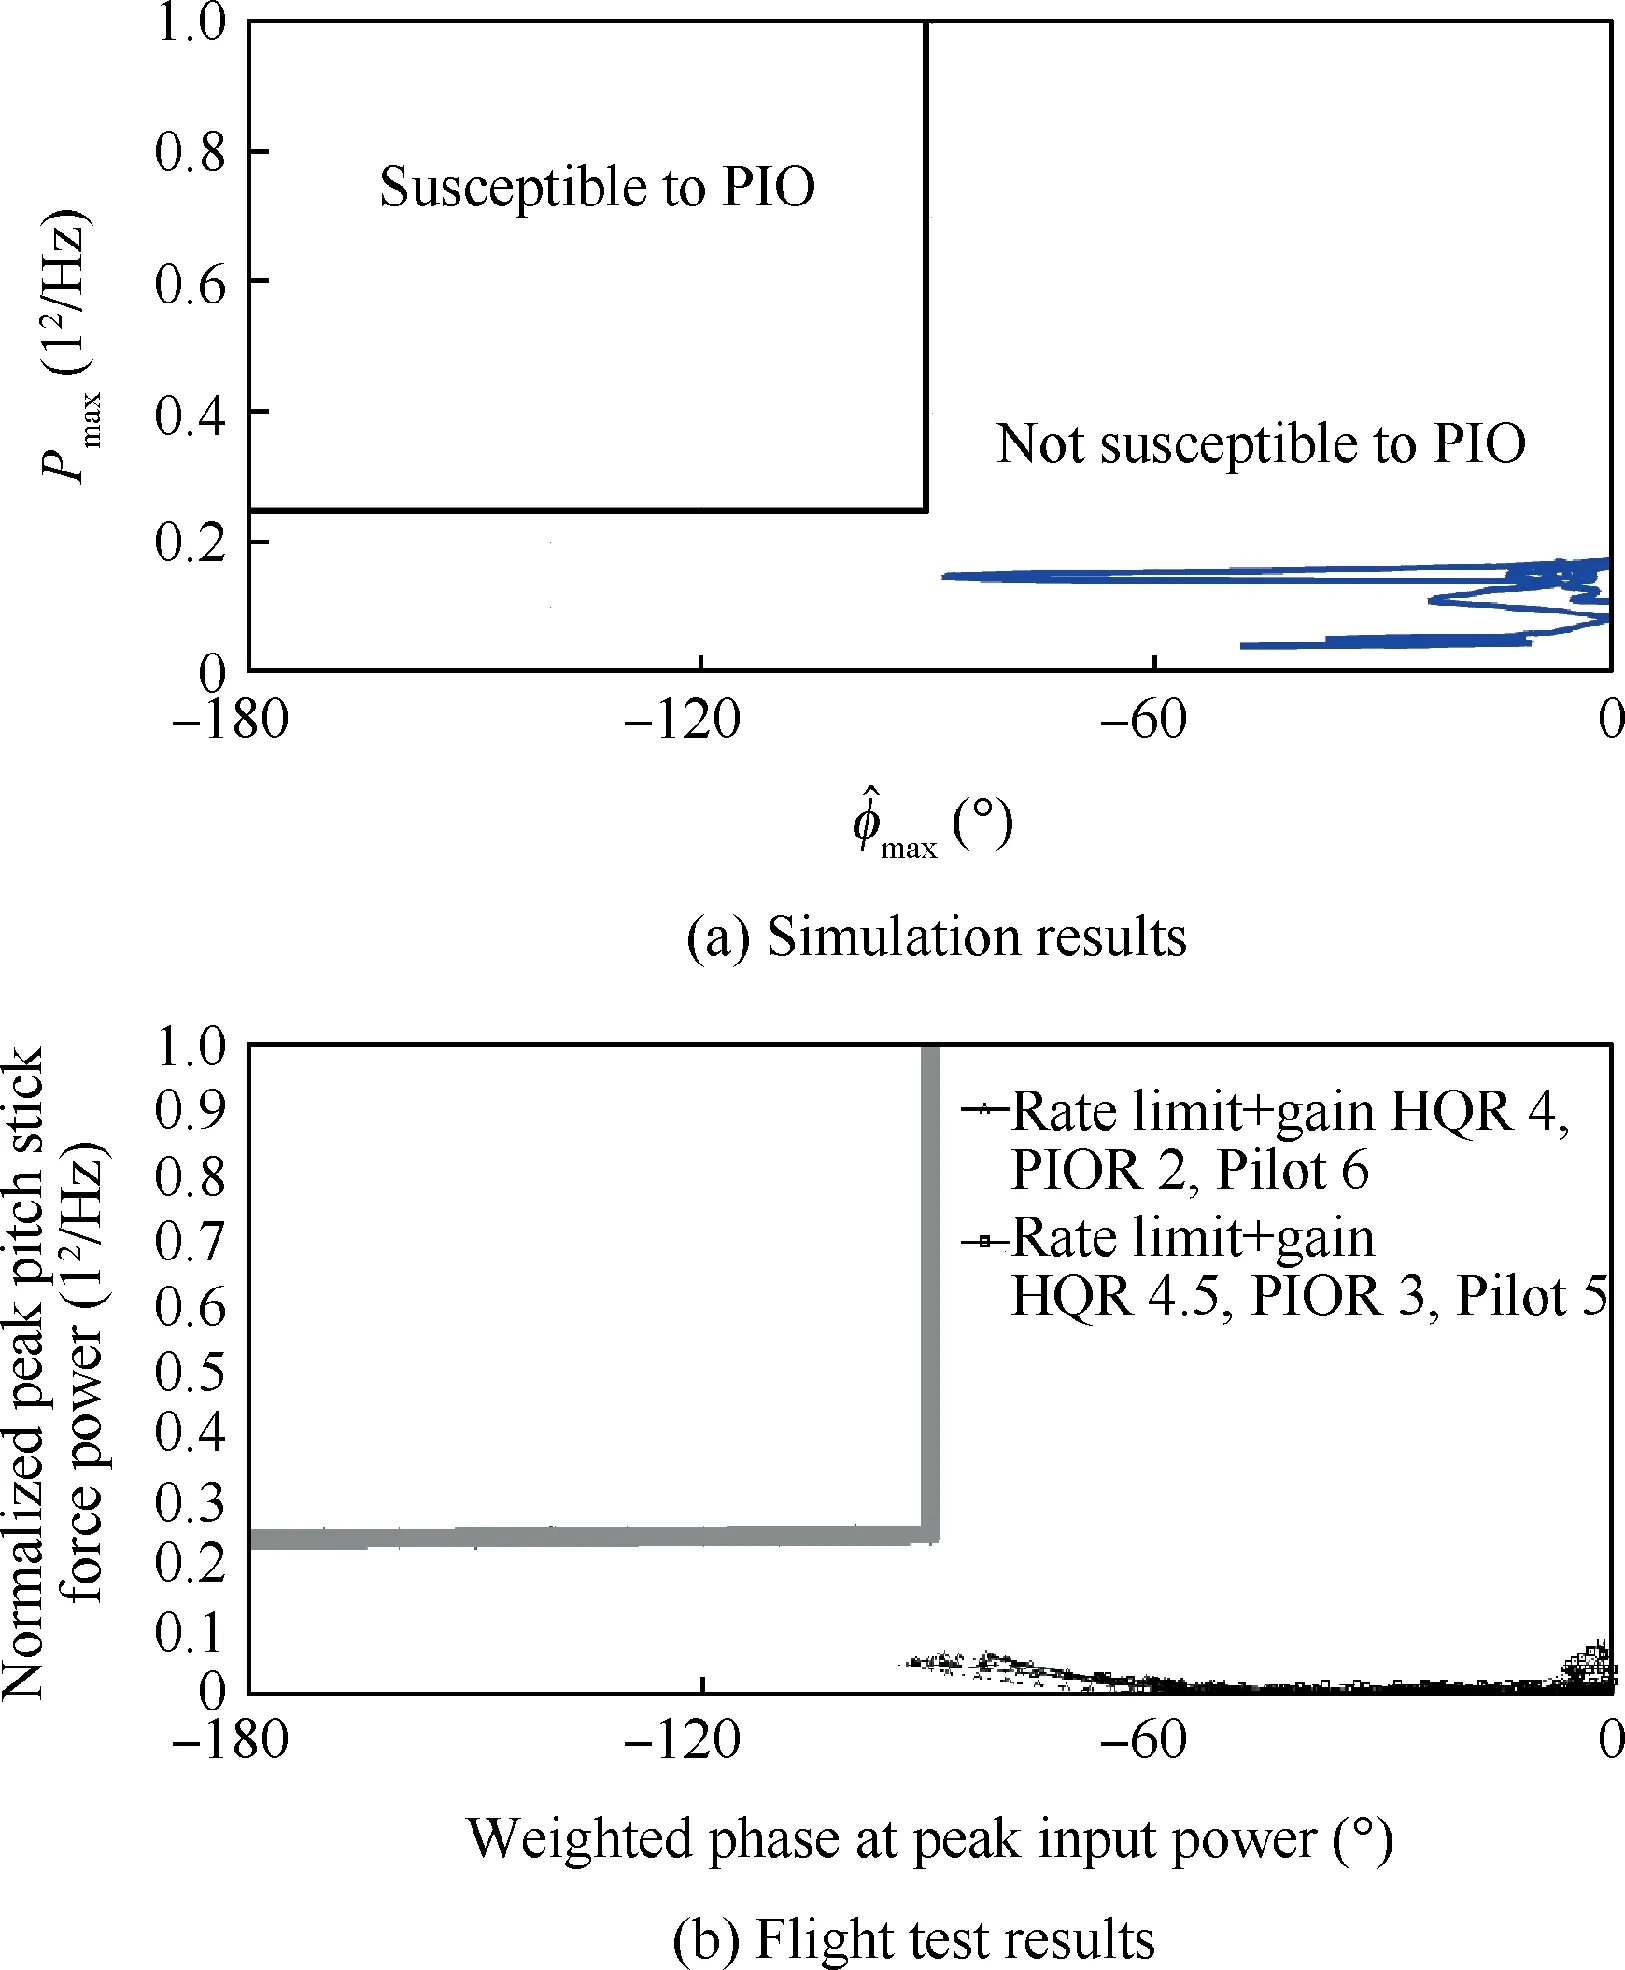
Fig.15 Scalogram-based PIO metric applied to Case 3.

Table 7 Roll evaluation configurations.
In addition, roll inceptor peak amplitude Pmax, weighted frequency ^ωmaxand weighted phase lag ^φmaxfor algorithm Step 3 are shown in Fig. 17(e)-(g), respectively.
(3) Case 6
When the Smart-Gain is used to alleviate the oscillation,the resulting time histories for algorithm Step 1 are shown in Fig.18(a)-(c).It can be observed that the roll attitude response of the aircraft (Fig. 18(a)) is close to the response of Case 4.
The wavelet-based scalogram of algorithm Step 2 (Fig. 18(d)) shows a significant reduction of peak amplitude as compared to Case 5. This reflects that the intelligent pilot model with Smart-Gain can indeed improve the handling qualities and reduce or eliminate the tendency for a PIO to occur.
Moreover,roll inceptor peak amplitude Pmax,weighted frequency ^ωmaxand weighted phase lag ^φmaxfor algorithm Step 3 are seen in Fig. 18(e)-(g), respectively.
6.2. Application of prediction method
To validate the prediction method based on scalogram-based PIO metric,the simulation and flight test data results are compared.Details of the results for algorithm step 4 of three cases are presented in the following.
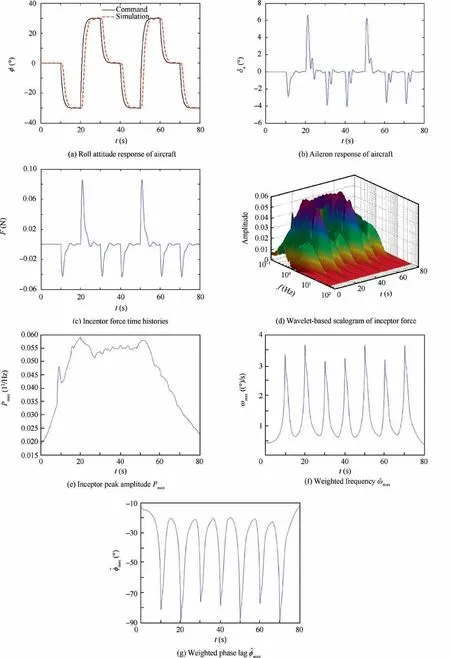
Fig.16 Simulation results for Case 4.

Fig.17 Simulation results for Case 5.
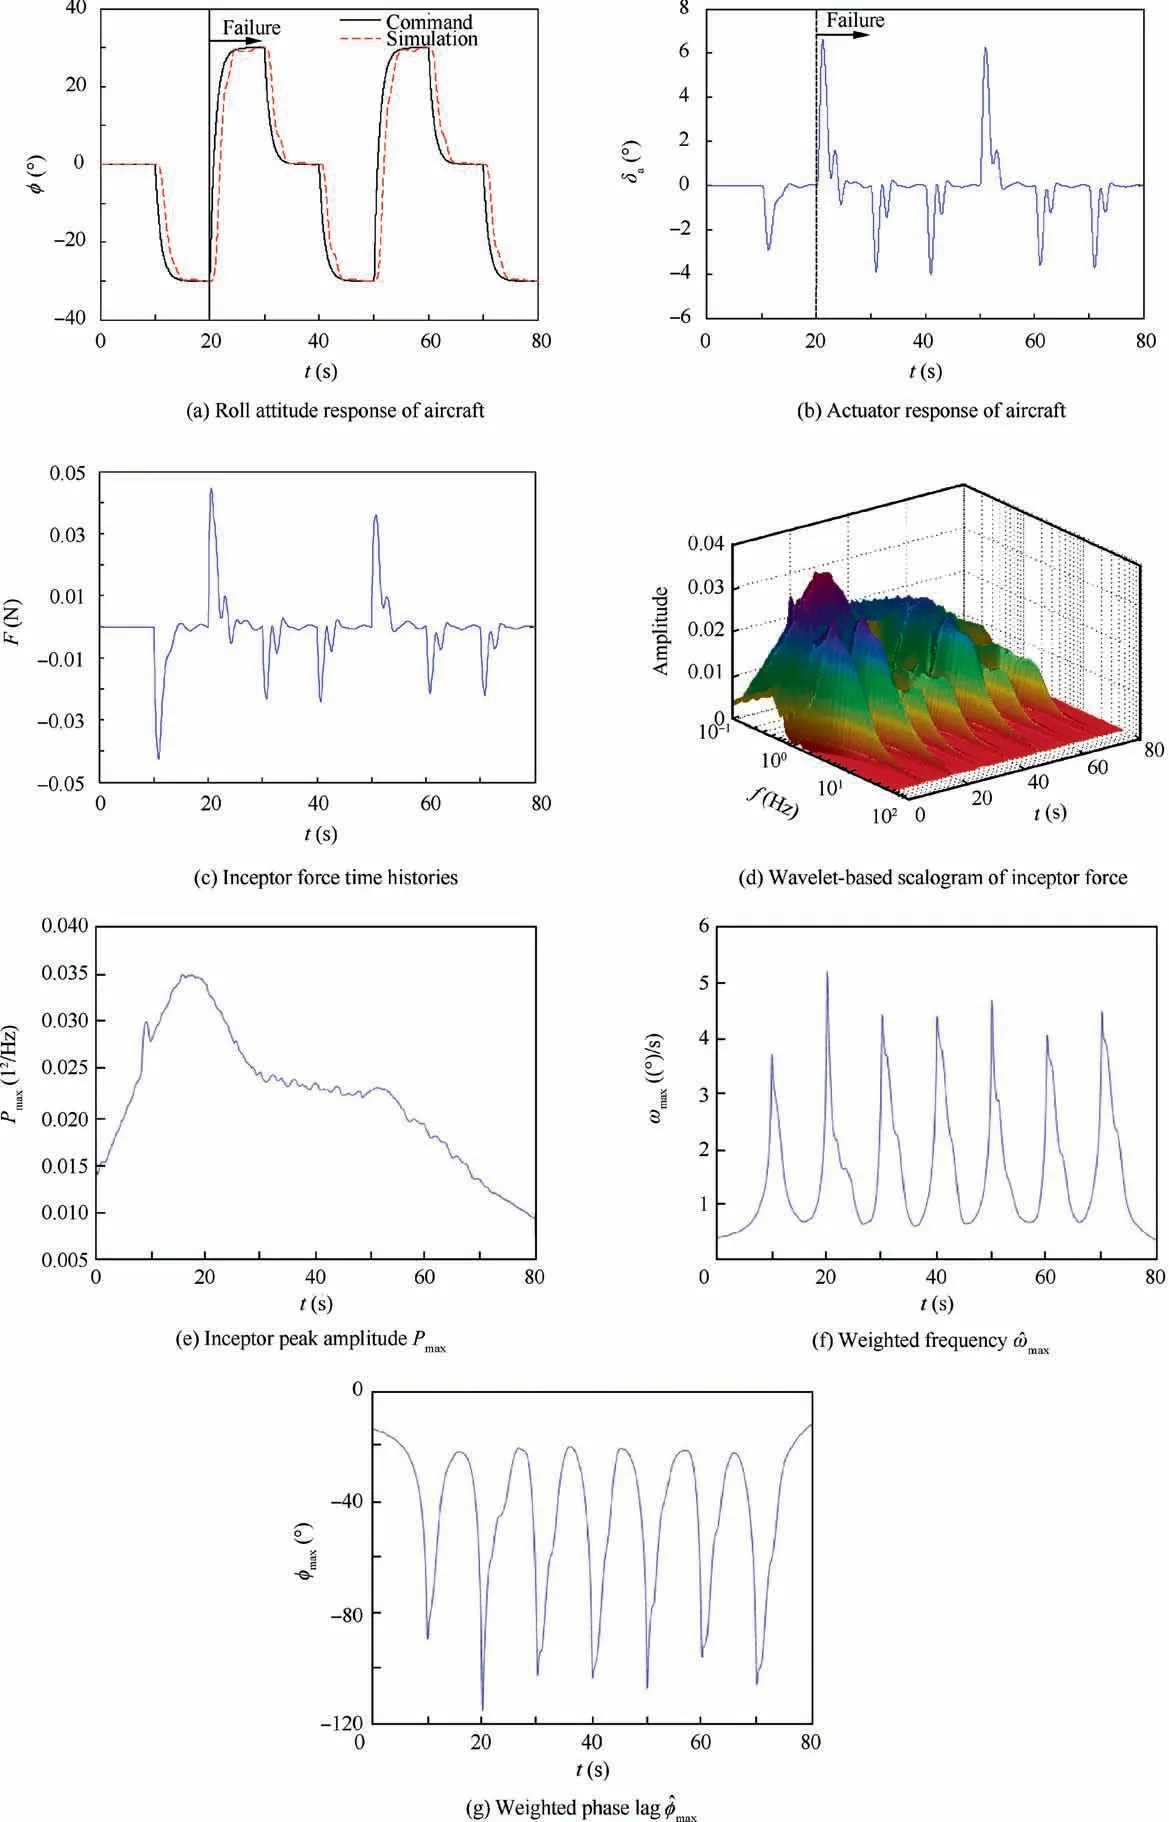
Fig.18 Simulation results for Case 6.

Fig.19 Scalogram-based PIO metric applied to Case 4.
(1) Case 4
The scalogram-based PIO metric prediction results for human pilot model simulation and flight test in Case 4 are shown in Fig.19.For the simulation results,Case 4 clearly represents no-PIO tendency.
Note that the prediction result of human pilot model simulation tends to be close to the flight test. For Case 4, the prediction of the scalogram-based PIO metric using the human pilot model is feasible.
(2) Case 5
The simulation prediction results of Case 5 are shown with the flight test in Fig. 20. For this simulation results, the PIO tendency is identified based on the human pilot model.
Note that there are three sets of test pilot data and three assessment curves used in the flight test results.In comparison to the flight test, both results reach the PIO susceptible area.
(3) Case 6
The prediction results of scalogram-based PIO metric for human pilot model simulation and flight test data for Case 6 are shown in Fig. 21. For the simulation results, no PIO tendency is noted.
In comparison to the flight test,it can be seen that the prediction results obtained by the pilot model lie within the same range of values as the actual flight test data.
7. Application and validation of pilot model and prediction method on GTM aircraft

Fig.20 Scalogram-based PIO metric applied to Case 5.
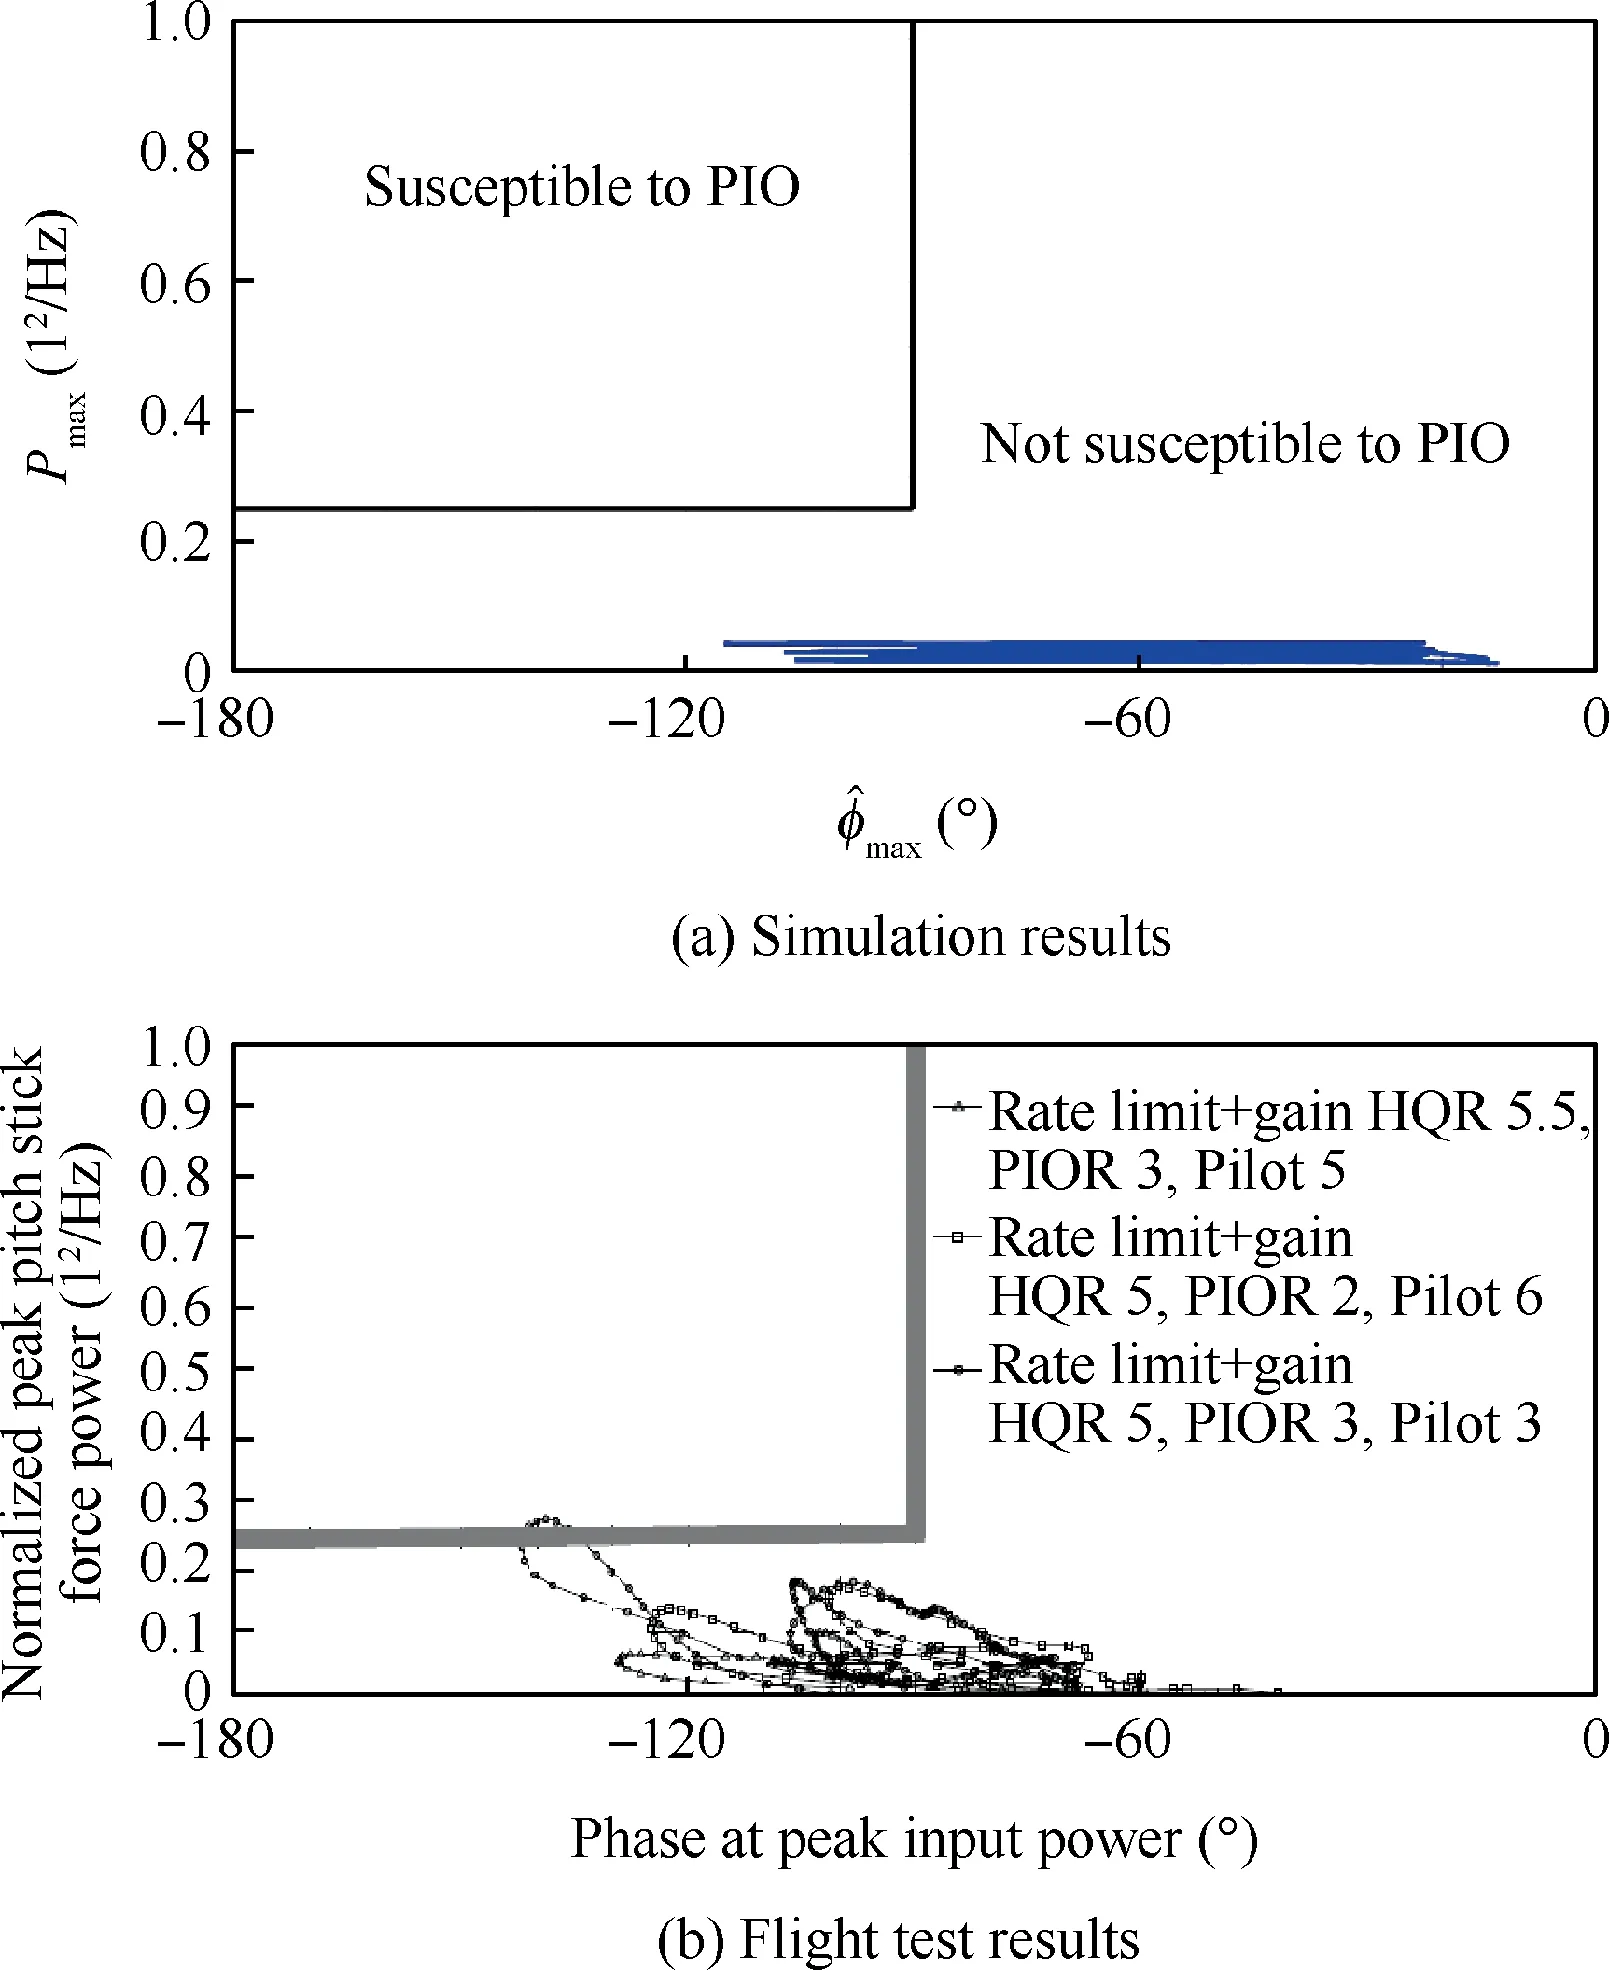
Fig.21 Scalogram-based PIO metric applied to Case 6.
The NASA Generic Transport Model (GTM)33was selected for the validation of the pilot model and prediction method.The selected flight condition was an altitude of 4572 m and a calibrated airspeed of 481 km/h. And the short period mode is as follows.
The flight control system is identified in Table 8.It includes the rate limit, surface actuator, and surface position limit.

Table 8 Parameters of flight control system.

Table 9 Failure scenarios.

A team led by Systems Technology, Inc. for NASA VSST Project33developed the pilot-in-the-loop flight experiment in a simulator. In the experiment, a pitch tracking task and Sum-Of-Sines(SOS)command signals were used to ensure that the pilot tracked the displayed attitude command.The nonlinear PIO is caused by the elevator damage,including the reduction in elevator effectiveness and elevator rate. Failure scenarios were created as shown in Table 9.
Fig.22 compares the tracking performance of pitch sum-ofsines histories for pilot model simulation and pilot-in-the-loop experiment. Note that the phase lags tend to look the same in the simulation and experiment. It also can be seen that the responses of the simulation and the experiment are consistent with the tracking task.These indicate that the pilot model and actual pilot are able to approach the desired performance.Fig. 23 shows the curves of Kpand Krof the human pilot model. Due to the signal feedback of smart inceptor, the gain of the pilot model decreases so as to reduce the manipulation,which can improve the rate limit effectively.The inceptor force and the wavelet-based scalogram of this inceptor force are presented in Figs.24 and 25,respectively.The scalogram shows a small peak input amplitude of inceptor force. The prediction results of scalogram-based PIO metric for human pilot model simulation (Fig. 26) show that there is no PIO tendency.
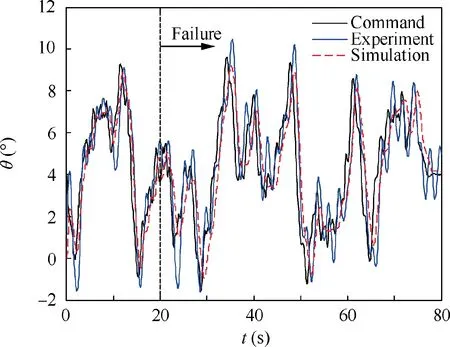
Fig.22 Time domain tracking performance.

Fig.23 Kp and Kr.
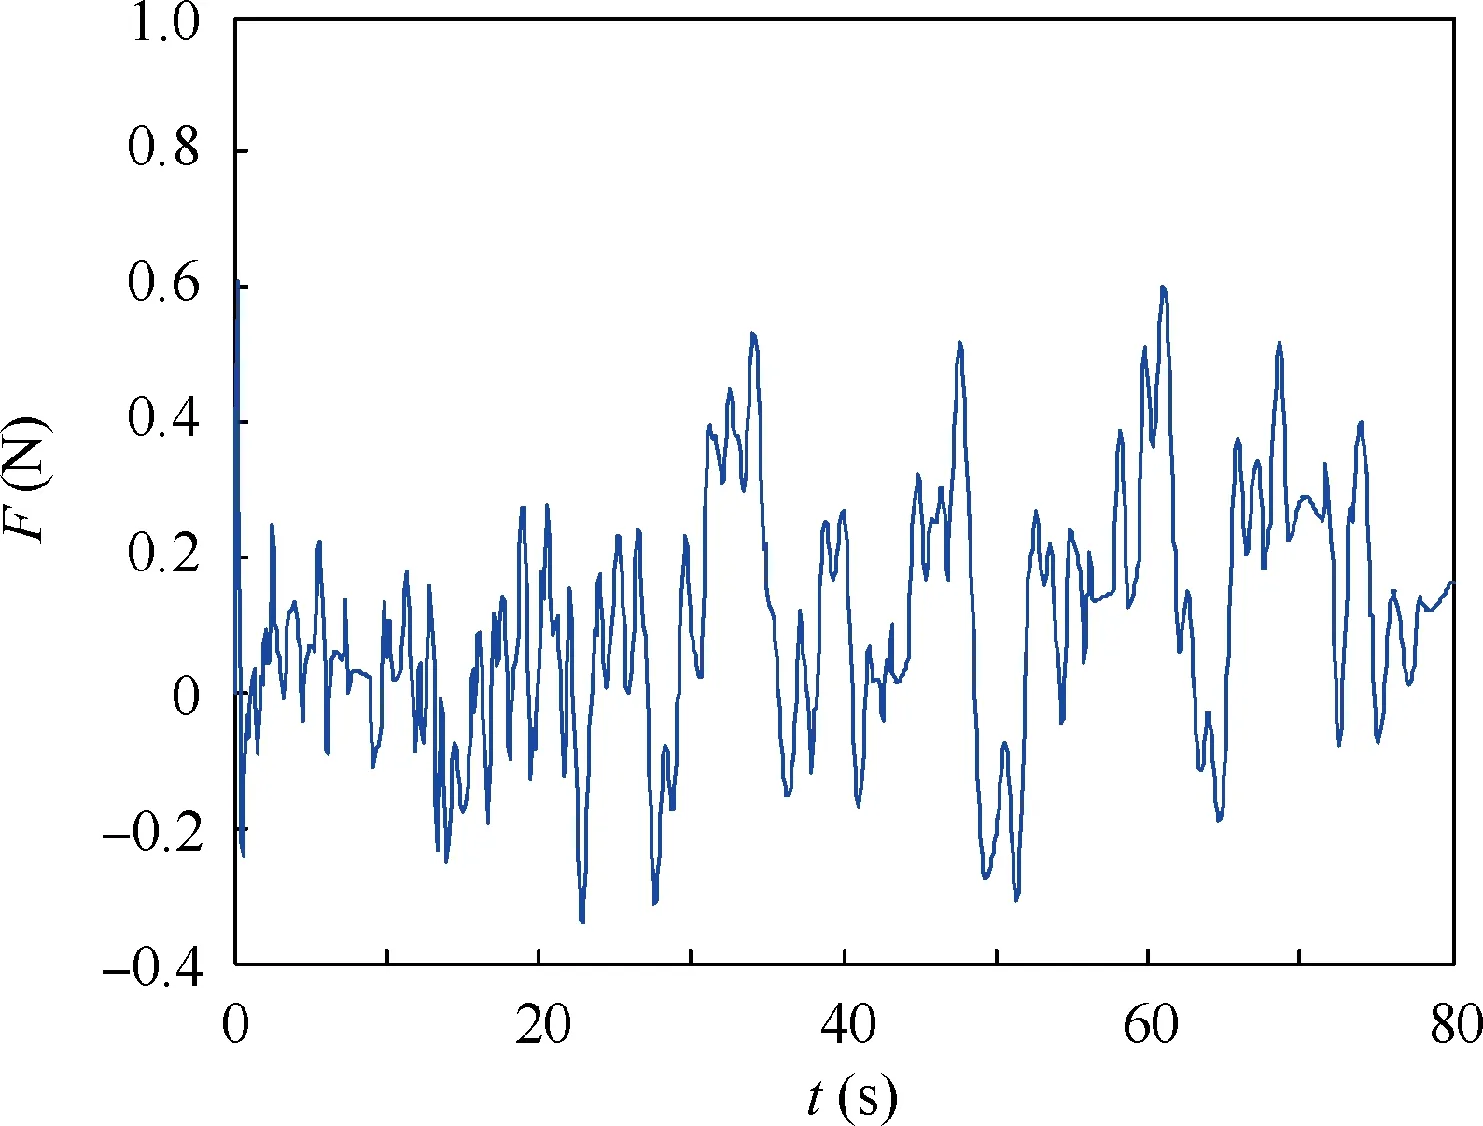
Fig.24 Inceptor force time histories.
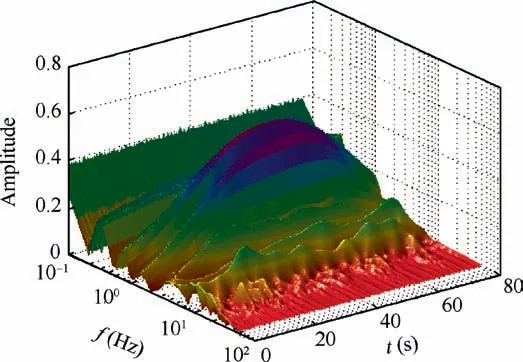
Fig.25 Wavelet-based scalogram of inceptor force.
8. Discussion

Fig.26 Simulation results of scalogram-based PIO metric applied to GTM aircraft.
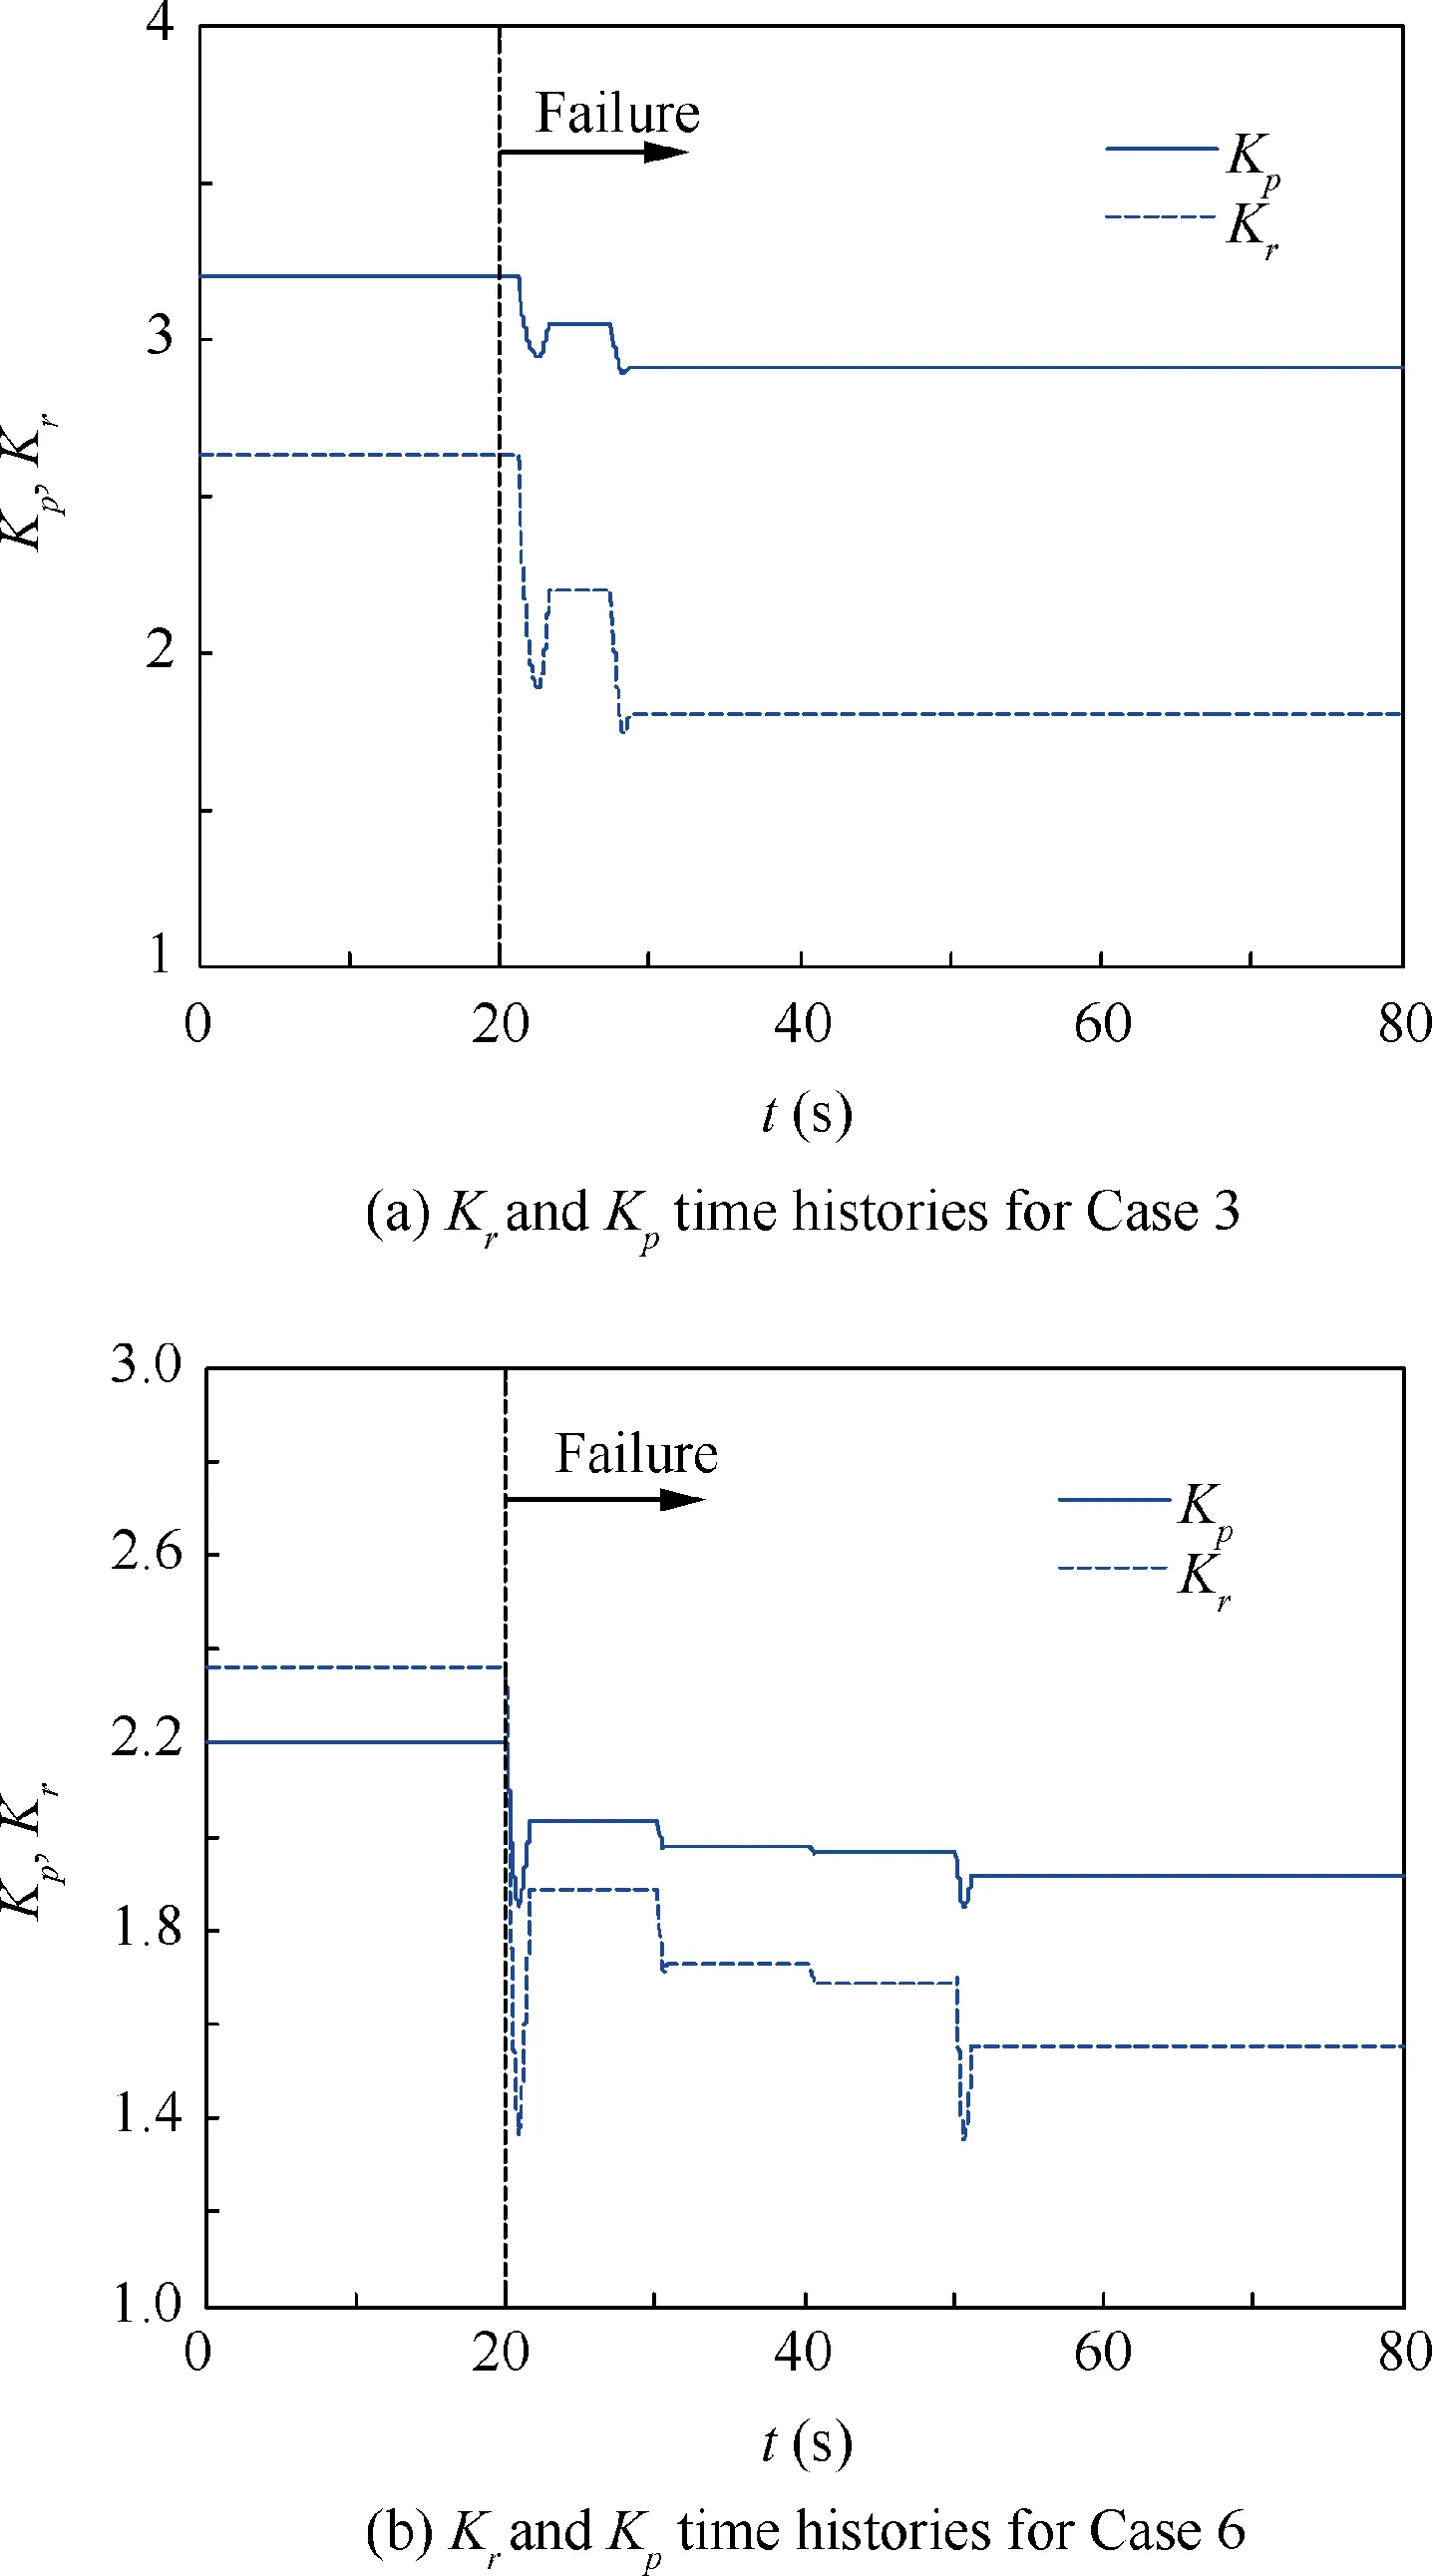
Fig.27 Kr and Kp time histories.
The prediction method that has been proposed resulted from the application of a special model of the human pilot, with some fixed parameters and adaptive parameters.Among them,the adjustments of gains Kpand Krreflect the adaptation of the human pilot.
Fig. 27(a) shows time histories of Krand Kpfor Case 3.Case 3 is the pitch configuration with reduced rate limit and Smart-Gain. When the actuator rate limit is reduced(t=20 s), the human pilot adaptations occur within 2 s and take almost 10 s to complete.For Fig.27(b),Case 6 represents the roll configuration with reduced rate limit and Smart-Gain.The human pilot adaptations also occur when the actuator rate limit is reduced.It can be seen that nearly 30 s pass before the human pilot completes the adaptive adjustments.These results are mainly due to input mode of serious pulses(each pulse lasting 10 s), which lead to the changes of gains Kpand Krin various pulse stages as well(Fig.18(a)).Based on these two cases,with the adaption of the human pilot adjusted by gains Kpand Krand the Smart-Gain, pilot-aircraft system performance has been improved (Figs. 12(a) and 18(a)) compared with the results of Case 2 and Case 5(Figs. 11(a) and 17(a)). Besides,in Case 2 and Case 5, the pilot cannot perceive the cue from the Smart-Cue/Smart-Gain system. The sudden occurrence of the elevator rate limit will add phase lag, increasing the delay between the pilot input and aircraft response.The actual pilot tends to compensate with fast responses and make large command inputs, often worsening the situation and causing the oscillations.
The human pilot model developed herein cannot be considered to be in its unique and final form.It can be changed based on the different inceptor cues to address more nonlinear PIO cases.However,it is offered as a model of the manner in which a human pilot may adapt to the nonlinear PIO events such as reduced actuator rate limit. Besides, the limitation of the method is that the adaptation of the human pilot is based on the Smart-Cue/Smart-Gain system. This requires the aircraft using a smart control inceptor implemented with the Smart-Cue/Smart-Gain system.
9. Conclusions
In this paper, an innovative method was proposed as a means to predict nonlinear PIO using an intelligent human pilot model.
(1) The method depends on a scalogram-based PIO metric,which was evaluated by the flight test data in the previous study.We expanded the application of the PIO metric based on an intelligent human pilot model.Considering the human pilot accommodating the nonlinear PIO event, the intelligent and adaptive characteristics of the human pilot, including the neural network receptor, the fuzziness decision and adaptation, are presented in the literature to describe the human pilot control behavior. In particular, the fuzzy decision and adaptation reflect the behavior that the human pilot makes decision to adapt to the new situation.
(2) Based on the pilot-aircraft system analysis,an algorithm was put forward to describe the procedures of predicting nonlinear PIO, including the time domain simulation,wavelet-based analysis, and parameter calculation and validation of the scalogram-based PIO metric.Note that the wavelet-based scalogram reflects the characteristics of the human pilot control behavior when the nonlinear PIO is triggered. The prediction results by human pilot simulation are compared with the assessments of flight test data. It can be seen that the model could explain the flight test data rather well.
(3) In addition, further investigation of the prediction method based on the human pilot model is needed.First of all, the other nonlinear PIOs with transients can be identified by the scalogram-based PIO metric using the human pilot model. Secondly, investigation of the human pilot model applied to the scalogram-based PIO metric is recommended with evaluation of more aircraft configurations and more aircraft loss-of-control events.
Acknowledgements
This study was co-supported by the National Natural Science Foundation of China (No. 11502008) and the Aeronautical Science Foundation of China (No. 2017ZA51002).
杂志排行
CHINESE JOURNAL OF AERONAUTICS的其它文章
- A CFD-based numerical virtual flight simulator and its application in control law design of a maneuverable missile model
- Numerical investigation of flow mechanisms of tandem impeller inside a centrifugal compressor
- Experimental investigation on dynamic response of flat blades with underplatform dampers
- Non-random vibration analysis for general viscous damping systems
- Numerical analysis of hypersonic thermochemical non-equilibrium environment for an entry configuration in ionized flow
- Multiple hierarchy risk assessment with hybrid model for safety enhancing of unmanned subscale BWB demonstrator flight test
