Seismic Fragility Analysis of Long-Span Bridge System with Durability Degradation
2019-11-26YanLiangJialeiYanZhanqiChengHuaiChenandRuiminMao
Yan Liang ,Jialei YanZhanqi Cheng ,Huai Chen and Ruimin Mao
Abstract: An offshore long-span continuous rigid-frame bridge is taken as an example to study the effect of degradation of bond-slip behavior on the seismic performance of bridges in an offshore environment during a service period.On the basis of a numerical simulation analysis using the OpenSeeS platform,the influence of durability degradation of concrete carbonization,steel corrosion,and degradation of bond-slip performance is considered collectively using incremental dynamic analysis method to examine the time-varying seismic fragility of the offshore bridge.Results show that when bond slip is considered,the exceedance probability of the bridge components and the system increases significantly,and the durability degradation caused by concrete carbonization and chloride ion erosion in the whole life cycle increases the seismic response of the bridge structure.The results of the proposed time-varying seismic fragility analysis indicate that,considering the degradation of bond-slip behavior of reinforced concrete after the durability degradation of materials,the exceedance probability of the pier,bearing,abutment,and system increases with the extension of service period and the increase in seismic strength under earthquake action.In addition,with the extension of service time,the effect of bond slip on the seismic fragility of components and system gradually decreases.
Keywords: Bridge,durability degradation,bond slip,seismic fragility.
1 Introduction
Bridges play an important role as transportation hubs,and when they are damaged by strong earthquakes,traffic lines may break,seriously affecting post-earthquake rescue.In recent years,great achievements have been made in the construction of sea-crossing bridges,such as the Hong Kong-Zhuhai-Macao Bridge,which has brought enormous convenience to the development of human society.However,offshore bridges are vulnerable to the influence of sea salt environments.Durability degradation,such as concrete carbonation and steel corrosion,causes the seismic performance of concrete bridges to deteriorate considerably in their whole life cycle.Therefore,the influence of material deterioration on seismic performance during service time must be considered.Scholars all over the word have conducted numerous related studies [Deng,Yan and Li (2019)].Luis et al.[Luis,Tomás and Herrera (2007)] studied the corrosion of carbon steel in unbuffered NaCl solutions by applying linear potential sweep technique to a rotating disk electrode.Muralidharan et al.[Muralidharan,Vedalakshmi,Saraswathi et al.(2005)] carried out various extraction methods to estimate the free chloride and total chloride contents in different types of concrete,namely,ordinary Portland cement (OPC),Pozzolana Portland cement (PPC),and Portland slag cement (PSC).Glass et al.[Glass and Buenfeld (2000)] conducted considerable research on chloride binding by using cement in concrete,which affected the rate of chloride ingress and chloride threshold level,and thus determined the initiation time of chloride-induced corrosion.Alonso et al.[Alonso,Andrade and González (1988)] established a model for the relationship between corrosion rate and concrete resistivity.Lindorf et al.[Lindorf,Lemnitzer and Curbach (2009)] performed pull-out tests with cyclic tensile loading and considered different preadjusted crack widths along the pull-out bar to evaluate the bond behavior between ribbed bars and normal-strength concrete under transverse tension and repeated loading.Salem et al.[Salem and Maekawa (2009)] simulated elastic and post-yielding bond mechanisms between deformed bars and concrete via nonlinear 3D asymmetric finite element analysis.Akiyama et al.[Akiyama,Frangopol and Mizuno (2009)] summarized the earthquake damage of Japanese viaducts and analyzed the seismic fragility curves of reinforced and unreinforced viaducts on the Shinkansen Northeast Line based on nonlinear dynamic analysis and Monte Carlo method.Their results showed that the median of the ultimate state fragility curve of the strengthened viaduct is five times that of the completed viaduct.Jeon et al.[Jeon,Shafieezadeh,Lee et al.(2015)] established the system fragility curve and analyzed the impact of vertical earthquakes on the seismic fragility of existing highway bridges by using nonlinear dynamic analysis method to determine the damage index and correlation of components.
Some developments on durability degradation,bond slip,and fragility analysis have been achieved based on previous studies.However,most previous studies only analyzed the impact of one factor on seismic performance,and the influence of the three factors on reinforced concrete structures was not considered comprehensively.In addition,only the time-varying effect of material properties was considered,and the time-varying effect of ground motion was ignored.Thus,the finite element model fails to achieve the best practical example.In this study,a nonlinear finite element model based on an offshore continuous rigid-frame bridge is established that considers the durability degradation of materials,the bond-slip effect between reinforcement and concrete,and the time-varying effect of ground motion to analyze the time-varying fragility of the bridge in its life cycle,and the structure of the paper is shown in Fig.1.
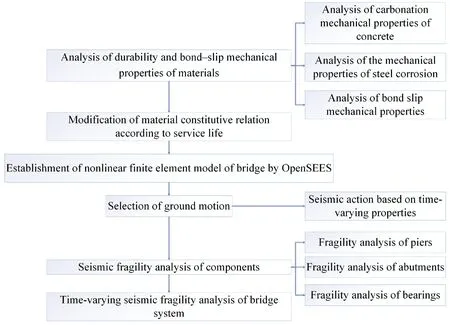
Figure 1:Structure of the paper
2 Analysis of durability and bond-slip mechanical properties of materials
2.1 Analysis of carbonation mechanical properties of concrete
Carbonation of concrete is a chemical corrosion manifested by the cracking of concrete,loss of cross-section of steel bar,and reduction of bonding performance between steel bar and concrete.Carbonation reduces the alkalinity of concrete,increases the amount of hydrogen ion in concrete pore solutions,and weakens the protective effect of concrete on steel bars.
2.1.1 Constitutive relationship of concrete
The mechanical properties of concrete structural components must be considered in the numerical analysis of concrete structures.After many years of experiments and theoretical research,scholars have proposed various constitutive models.The model can be divided into four categories according to the theoretical basis of mechanics:linear elasticity,nonlinear elasticity,plastic theory,and other mechanical theories.The common stress-strain relationship models of concrete include Kent-Park model,Hognested model,Rüsch model,and Mander model.OpenSees[Eroez and Desroches (2008)] platform provides researchers with a wealth of concrete material library,of which concrete 01 and concrete 02 models are the most commonly used.
Concrete 01 is used to construct uniaxial Kent-Scott-Park [Kent and Park (1971)] concrete material with linear unloading/reloading stiffness and no tensile strength.Concrete 02 is based on the Kent-Scott-Park constitutive model and considers linear tension softening.The constitutive relationship curve of the two materials is shown in Fig.2.
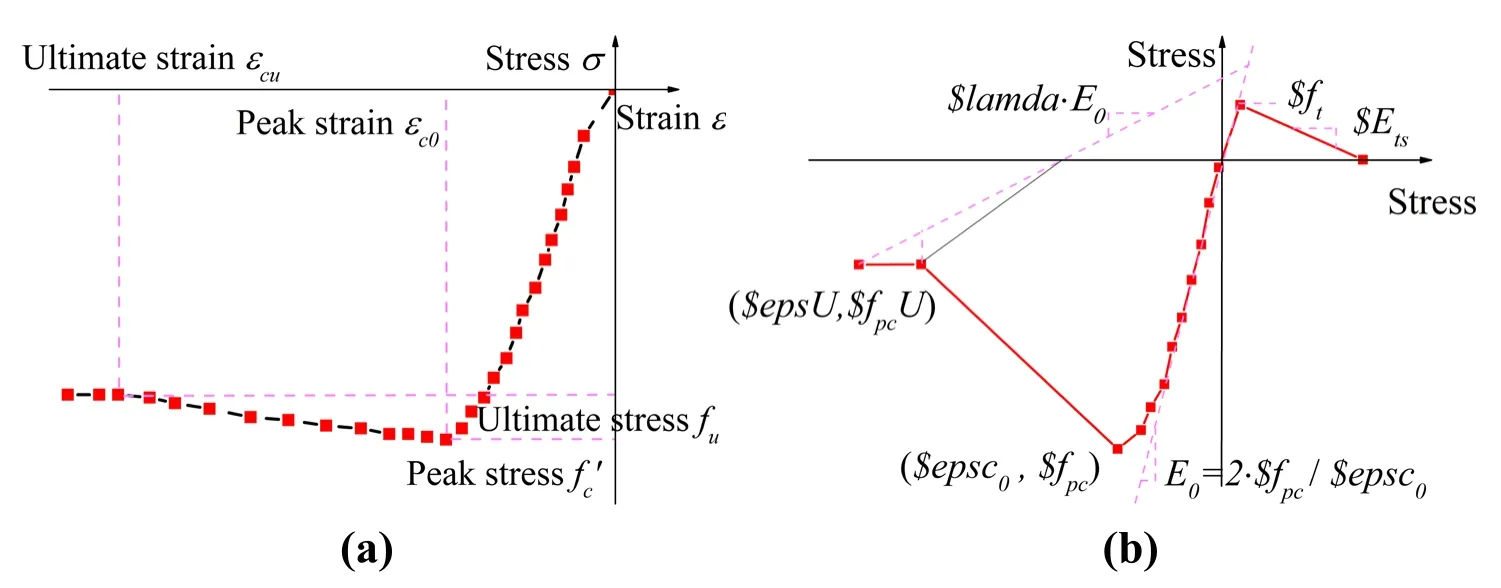
Figure 2:(a)Constitutive relation of concrete 01;(b)Constitutive relation of concrete 02
A bridge structure requires a pier with high ductility.Thus,finite element modeling must simulate the restraint effect of stirrups,which can effectively restrain core concrete and improve the strength and ductility of concrete in the core area.The confinement effect of stirrups on the core concrete is equivalent to the effective uniform lateral pressure for modifying the stress-strain constitutive relationship curve of the core concrete based on the Mander confined concrete constitutive model [Cornell (1967)] and considering the constraint effect coefficient,which can effectively evaluate the ultimate bearing capacity and ductility of the bridge.The stress-strain relationship curve of the Mander constitutive model [Cornell (1967)] is shown in Fig.3.
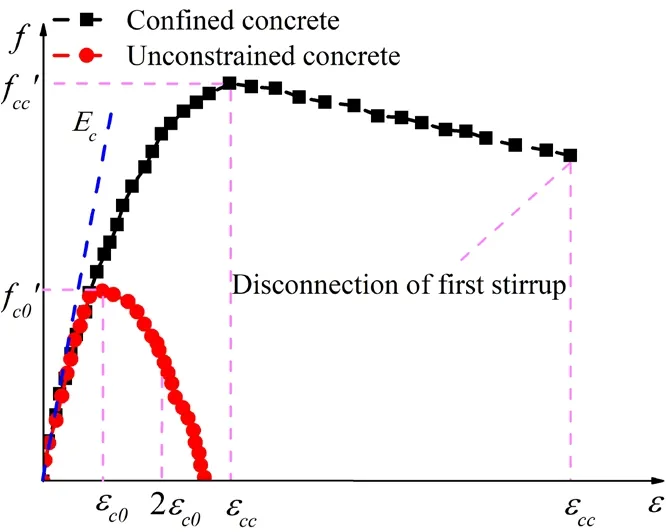
Figure 3:Stress-strain curve
2.1.2 Analysis on the properties of carbonated concrete
The stochastic process model of concrete carbonation depth is as follows [Quan and Yang (2005)]:

In the formula,X(t)is the carbonization depth (mm)of concrete,tis the carbonization time (a),kis the carbonization coefficientKco2is the influence coefficient ofCO2concentration,andKk1is the position influence coefficient.The corner is set to 1.4,and the non-corner is 1.0.Kk2is the influence coefficient of curing pouring,with 1.13 considered for the pouring surface.Kk3is the working stress influence coefficient,which is 1.0 when pressed and 1.2 when pulled.Tis the concrete temperature (°C),RHis the ambient relative humidity,KFis the fly ash substitution coefficient,fcukis the concrete cubic compressive strength value (MPa),andFis the fly ash weight ratio.
The carbonization coefficient ofC50 andC40 concrete can be obtained when considering the bridge site environment and settingKco2=1.2,Kk1=1.0,Kk2=1.0,Kk3=1.0,T=16.5°C,andRH=77%.The carbonization coefficientkis also integrated into Eq.(3).The variation in carbonation depth of the concrete with the service time is shown in Fig.4 (The unit of service life in all the figures and tables in this paper is “a”,and we use “a” to represent year).

Figure 4:Curve of concrete carbonation depth with service time
Fig.4 shows that with the extension of service time,the concrete carbonation depth of each pier gradually increases,and the changes of #1,#4,and #5 piers are more evident.The corresponding carbonization depth of each pier in service for 0,30,50,70,100,and 120 years is shown in Tab.1.

Table 1:Carbonization depth of different piers in different service periods
The current research results [Lam,Wong and Poon (2000)] indicate that the method of using carbonization depth as a parameter neglects the effect of cross-section size and environmental impact of actual components.We combine the research method of concrete carbonization by Ozaki et al.[Ozaki,Okazaki,Tomomoto et al.(1998)] and select the relative carbonization area of concrete section as the parameter to study the performance of carbonized concrete.In addition,we consider the size effect of the component section and reflect the evolution law of mechanical properties of concrete after carbonization reasonably.The section characteristics are shown in Fig.5,and the carbonization rate of concrete can be calculated according to Eq.(4)[Wailer and Ray (1992)].
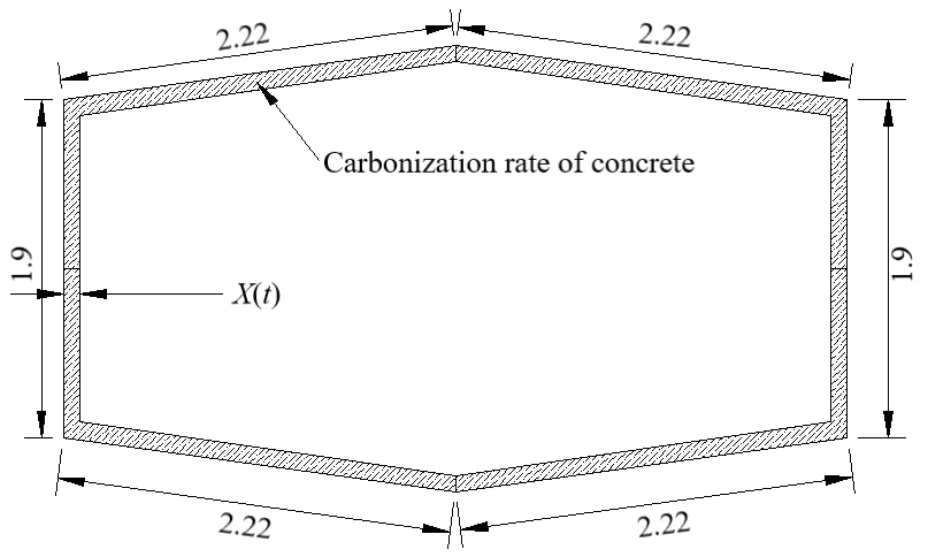
Figure 5:Characteristic of concrete carbonization section (m)

In the formula,is the relative carbonization area of the cross section of the structure or component,Acis the carbonization area of the cross section of the structure or component,andAis the total area of the cross section of the structure or component.The variation in concrete carbonization rate with service time is calculated according to Eq.(6),as shown in Fig.6.

Figure 6:Law of concrete carbonization rate that changes with time
Fig.6 shows that the concrete carbonation rate of each pier increases gradually with the extension of service time,and the changes of #1,#4,and #5 piers are more evident.The corresponding carbonization rates of the piers in service for 0,30,50,70,100,and 120 years are shown in Tab.2.

Table 2:Carbonization rate of different piers in different service periods
Combined with the calculation method of the elastic modulus of carbonated concrete used in Roeder [Roeder (1985)],the variation of elastic modulusEcand shear modulusGcwith carbonation rate is calculated using Eqs.(5)and (6),respectively,as shown in Fig.7.

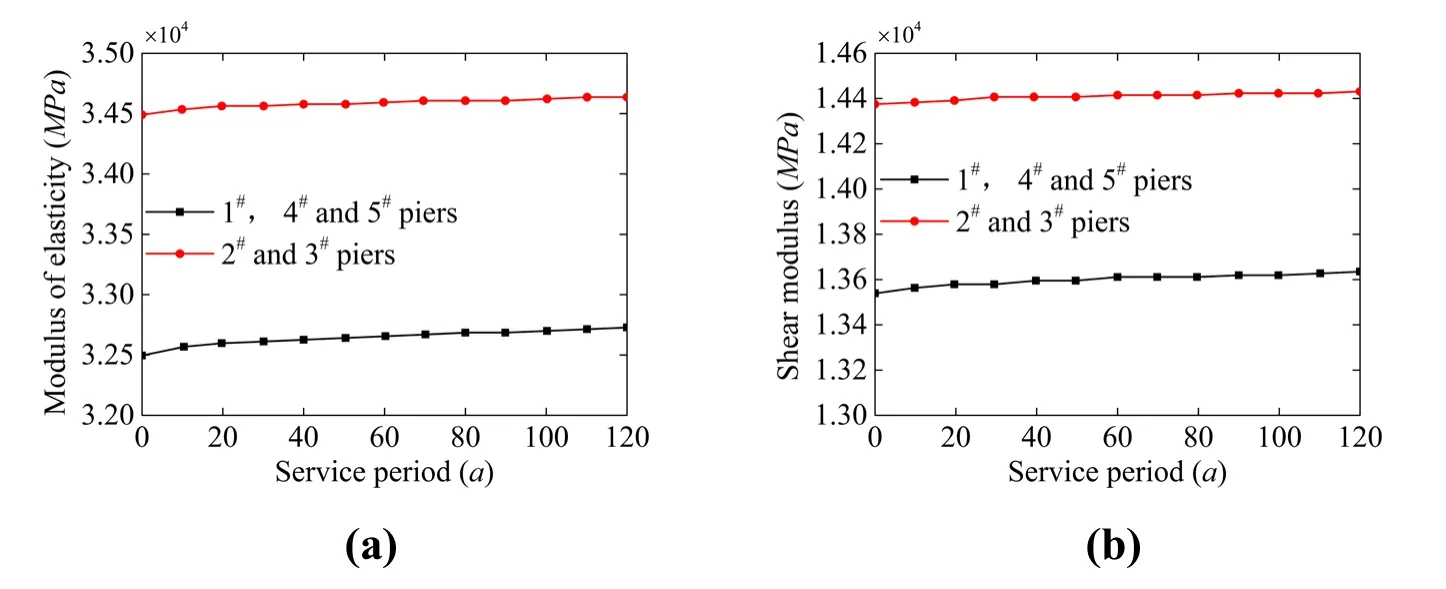
Figure 7:(a)Properties of concrete materials of modulus of elasticity;(b)Properties of concrete materials of shear modulus
2.2 Analysis of the mechanical properties of steel corrosion
Corrosion of steel is the main factor leading to the deterioration of concrete structure performance,thereby affecting the safety performance and normal use of the structure.In offshore environments,reinforced concrete structures are highly susceptible to corrosion damage because of their high chloride content.Corrosion damage can be divided into three stages (Fig.8):diffusion,propagation,and degradation.Traditional research methods do not consider the repair of concrete crack damage.However,in practical engineering,cracks caused by steel corrosion are often repaired,causing the corrosion rate of important indicators in the analysis of steel corrosion to be relatively different from the actual rate.Therefore,this section combines the research on reinforcement corrosion and material degradation and puts forward a method to study the time-varying law of bridge structure performance under the influence of deterioration of reinforcement material based on the repair of concrete cracks in protective layer.This research can provide reference for the study on the seismic performance of bridge structures with material deterioration in offshore environments.The concrete of the protective layer begins to peel off according to the classification ofSSLSby Vu and Stewart when the crack width reaches 1 mm.The safety against serviceability limit state (SS)is defined based on the degree of cracking (characterized by crack width)in the girder due to chloride induced corrosion of reinforcement and the classification ofSS stateis shown in Tab.3 [Vu and Stewart (2005)].
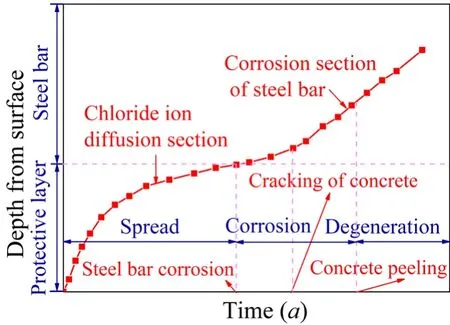
Figure 8:Significance of chloride ion erosion damage

Table 3:Classification of SS stat
2.2.1 Constitutive relationship of steel
Steel bars in concrete bridge structures mainly consist of longitudinal steel bars and hoop stirrups.The stirrups are used to fix the position of the main reinforcement to satisfy the shear strength of the inclined sections and connect the main tension reinforcement and the concrete in the compression zone to enable them to work together.The stirrup effect is set to be equivalent to the restraint coefficient of core concrete according to the section characteristics to determine the stress-strain relationship of unconstrained and restrained concrete more reasonably.This step ensures the accuracy of the nonlinear analysis of bridge structure.OpenSeesmaterial library provided numerous constitutive models of steel bars.The commonly used models,according to the bridge sample,are Steel 01 material,Steel 02 material,Steel 04 material,and Reinforcing Steel material,based on the modified Giuffr Menegotto-Pinto model and considering the bidirectional Bauschinger effect and the isotropic strengthening effect.The Steel 02 steel bar material,which is expressed by the explicit function of strain and efficiency in calculation,is selected for nonlinear analysis,As shown in Fig.9.

Figure 9:Stress-strain relationship curve of Steel 02 steel bar
2.2.2 Analysis on the properties of corroded steel bar
The two traditional methods for calculating the corrosion performance of steel bars in their complete life cycle are Fick’s second law and the durability evaluation criteria of Chinese concrete structures.We systematically compare and discuss the effects of the two methods on the corrosion performance of steel bars in the service life of reinforced concrete structures and conduct a detailed analysis and evaluation of the two methods.
(1)Fick’s Second Law
The corrosion of reinforcing bars is influenced by the air composition in the offshore environment.Fick’s second diffusion law is often used to fit the corrosion process [Missel (2000)].The initial corrosion time of steel bars is shown in Eq.(7).

In the formula,Xcis the concrete thickness of the protective layer (cm),Dcis the chloride diffusion coefficient,erf-1is the inverse function of the error function,Csis the chloride ion concentration on the concrete surface,andCcris the critical chloride ion concentration for steel corrosion.
Eq.(10)shows that to determine the initial corrosion time of steel bars,relevant parameters such asCs,Ccr,andDcmust be determined initially.Soyluk [Soyluk (2004)] emphasized that some of these parameters change with time and air environment.To some extent,they can be regarded as random variables obeying normal distribution.The statistical results are shown in Tab.4.Combined with the structural form and environmental conditions of the concrete bridge,the initial corrosion time of different piers is calculated as shown in Tab.5.Jiong [Jiong (2007)] and Clark et al.[Clark,Chan and Du (2005)] established the calculation models of yield strength,diameter,and corrosion rate of steel bar based on the analysis of the test results of deterioration of reinforcing bar materials,as shown in Eqs.(8)-(14).

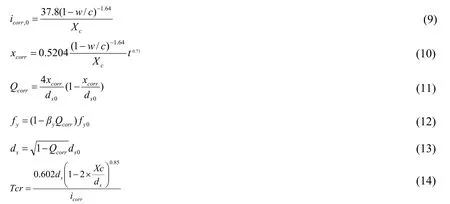
In the formula,icorris the current density (uA/cm2);xcorris the chloride ion corrosion depth;Qcorris the percentage of corrosion loss of steel bar and initial quality of steel bar,which is the corrosion rate of steel bar;DSis the diameter of the steel bar (mm);βyis the yield strength coefficient;FYis the yield strength (MPa);Tcris the cracking time (a).

Table 4:Distribution of different parameters
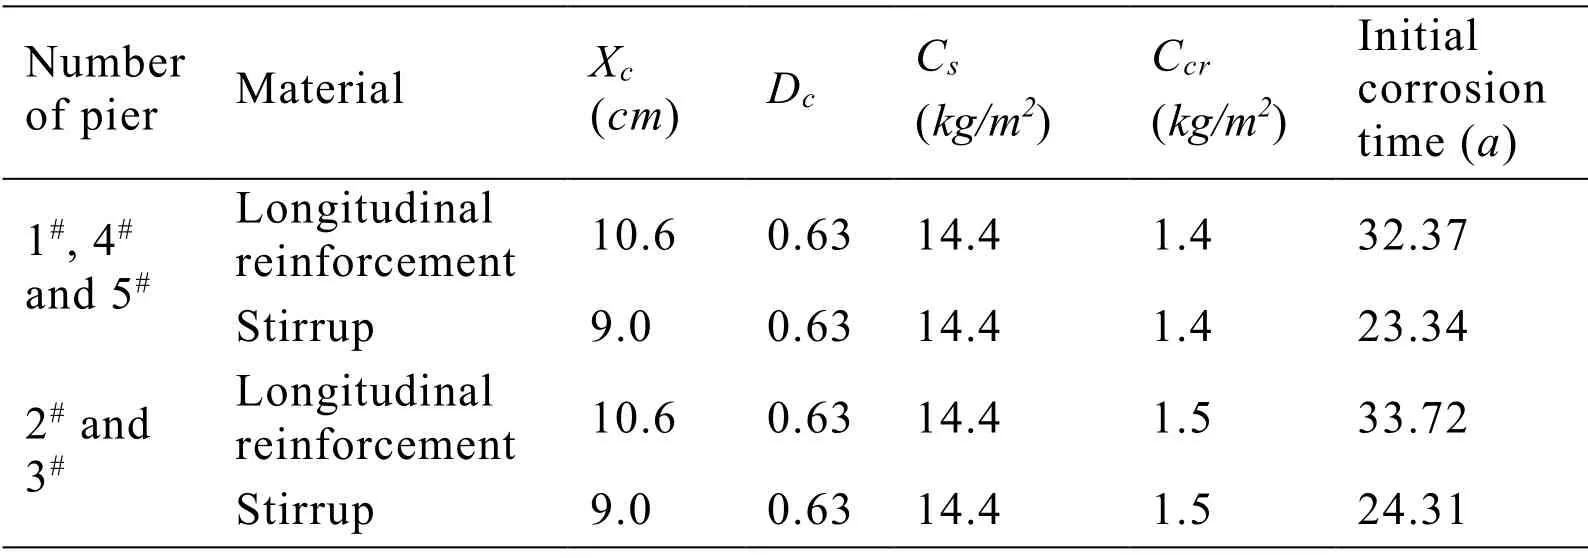
Table 5:Calculating parameters and initial corrosion time
Eqs.(11)-(17)indicate that the variations of steel diameter,yield strength,and corrosion rate with time can be obtained,as shown in Fig.10.The characteristic values of steel bars in 10,30,50,70,100,and 120 years of bridge service are shown in Tab.6.
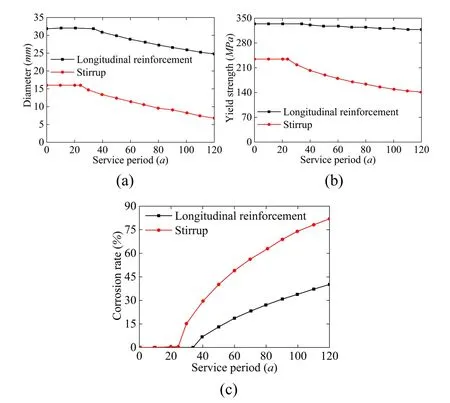
Figure 10:(a)Mechanical properties of steel bars during service of diameter;(b)Mechanical properties of steel bars during service of diameter yield strength;(c)Mechanical properties of steel bars during service of corrosion rate
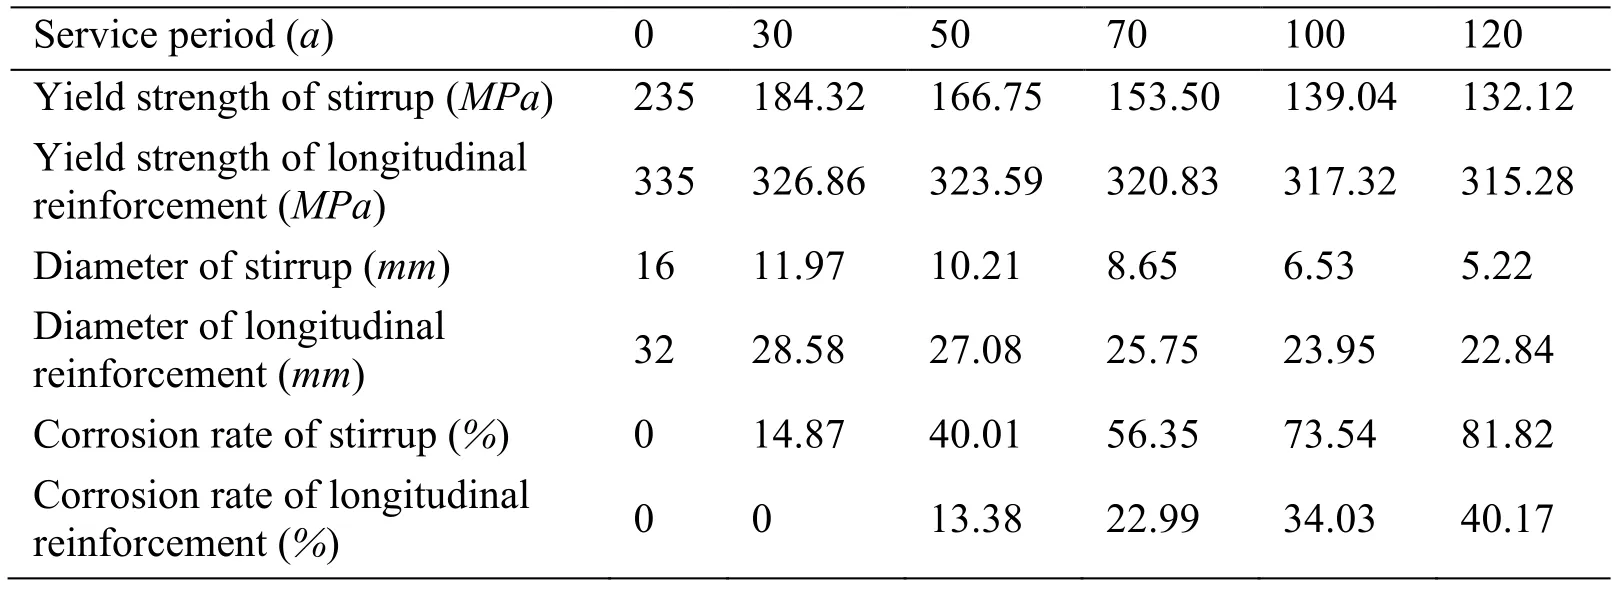
Table 6:Eigenvalues of steel bars corresponding to different service periods
Fig.10 shows that the diameter and yield strength of steel bars decrease gradually with time,and the corrosion rate of steel bars increases gradually because the protective layer of stirrups is thinner and the mechanical properties of reinforcing bars deteriorate more evidently.
(2)Durability assessment criteria for concrete structures
In offshore environments,steel bars in concrete structures are vulnerable to chloride corrosion,which results in steel bar corrosion.At present,the common methods for calculating the variation law of steel bar corrosion under chloride ion erosion environment include Fick's second law and standard for durability assessment of concrete structures,but the corrosion rate calculated by Fick’s second law is higher than that calculated by the actual situation,and the result based on standard for durability assessment of concrete structures is in good agreement with the actual situation.Furthermore,as the example of offshore bridges is located in the China,in order to more reasonably and rigorously calculate the variation law of steel corrosion under chloride ion erosion environment,standard for durability assessment of concrete structures is adopted in this paper.So,the variation rule of steel bar corrosion under chloride ion erosion environments is estimated based on CECS 220:2007 [Celik,Meral andPetek Gursel(2015);CECS (2007)].The initial times of steel bar corrosion are estimated by Eqs.(15)and (16),which do not consider the time-varying diffusion coefficient of chloride ions under offshore environments.

In the formula,ti’is the initial corrosion time of reinforcing steel bars (a),tiis the initial corrosion time of reinforcing steel bars (a),t1is the accumulation time of chloride ions on the surface of concrete (a),cis the thickness of protective concrete (mm),andKis the chloride corrosion coefficient.
The cumulative timet1(a)of chloride ion reaching a stable value on the concrete surface under infiltrating chloride erosion should be determined according to Tab.7.According to the environment of the bridge,t1should be 1.25.

Table 7:Environmental grade and parameters of chloride erosion
In the absence of effective measured data,the chloride ion concentration of concrete surface in an offshore atmospheric environment can be estimated by Eq.(17)[Celik,Meral and Petek Gursel (2015);CECS (2007)].The distance between the bridge structure and coastline is assumed to be 0.5km.

In the formula,Msis the chloride ion concentration on the concrete surface (kg/m3);Ms’is the chloride ion concentration on the concrete surface at 0.1kmaway from the coast (kg/m3),as shown in Tab.8;andKis the location correction factor of the distance from the coastline,as shown in Tab.9.

Table 8:Concentration of chloride ion on concrete surface at 0.1 km from coast Ms’

Table 9:Correction coefficient of surface chloride concentration k
The diameter,yield strength,elastic modulus,and corrosion rate of the reinforcing bars of concrete bridges after chloride ion erosion can be estimated according toCECS220:2007 [Celik,Meral and Petek Gursel (2015);CECS (2007)] by using Eqs.(18)-(28).
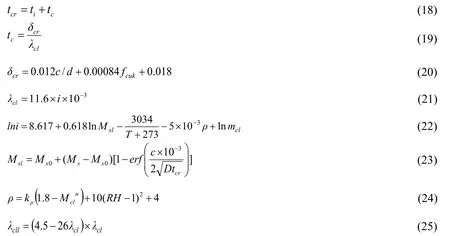
Whenλcll<1.8λcl,takeλcll=1.8λcl.

In the formula,tcis the time from steel bar corrosion to concrete cracking (a),δcris the depth of steel bar corrosion (mm),λclis the average annual corrosion rate of steel bar prior to concrete cracking (mm/a),dis the diameter of steel bar (mm),fcukis the standard value of compressive strength of concrete cube (MPa),iis the corrosion current density of steel bar (μA/cm2),andMslis the chloride ion concentration on the surface of steel bar (kg/m3).Tis the atmospheric ambient temperature (℃),ρis the concrete resistivity (KΩ·cm),mslis the local environmental coefficient,Ms0is the chloride ion content (kg/m3)mixed in the concrete preparation process,andkρis the coefficient.When the watercement ratio is 0.3-0.4 or concrete isC40-C50,the value is 11.1.When the watercement ratio is 0.5-0.6 or concrete is C20-C30,the value is 5.6.Mcluis the average chloride ion concentration (kg/m3)of the protective layer concrete.RHis the relative humidity of the environment,λcllis the average annual corrosion rate of steel bar after concrete cracking,fycis the yield strength of steel bar (MPa),andExis the elastic modulus of steel bar (MPa).
The variation rules of diameter,yield strength,elastic modulus,and corrosion rate of reinforcing bars in #1,#2,#3,#4,and #5#piers can be estimated by using Eqs.(21)-(31),which consider the parameters of bridge piers.Only the results of #2 and #3 piers are presented,as shown in Fig.11,because the time-varying laws of steel bars in piers #1,#4,and #5 are similar to those in piers #2 and #3.
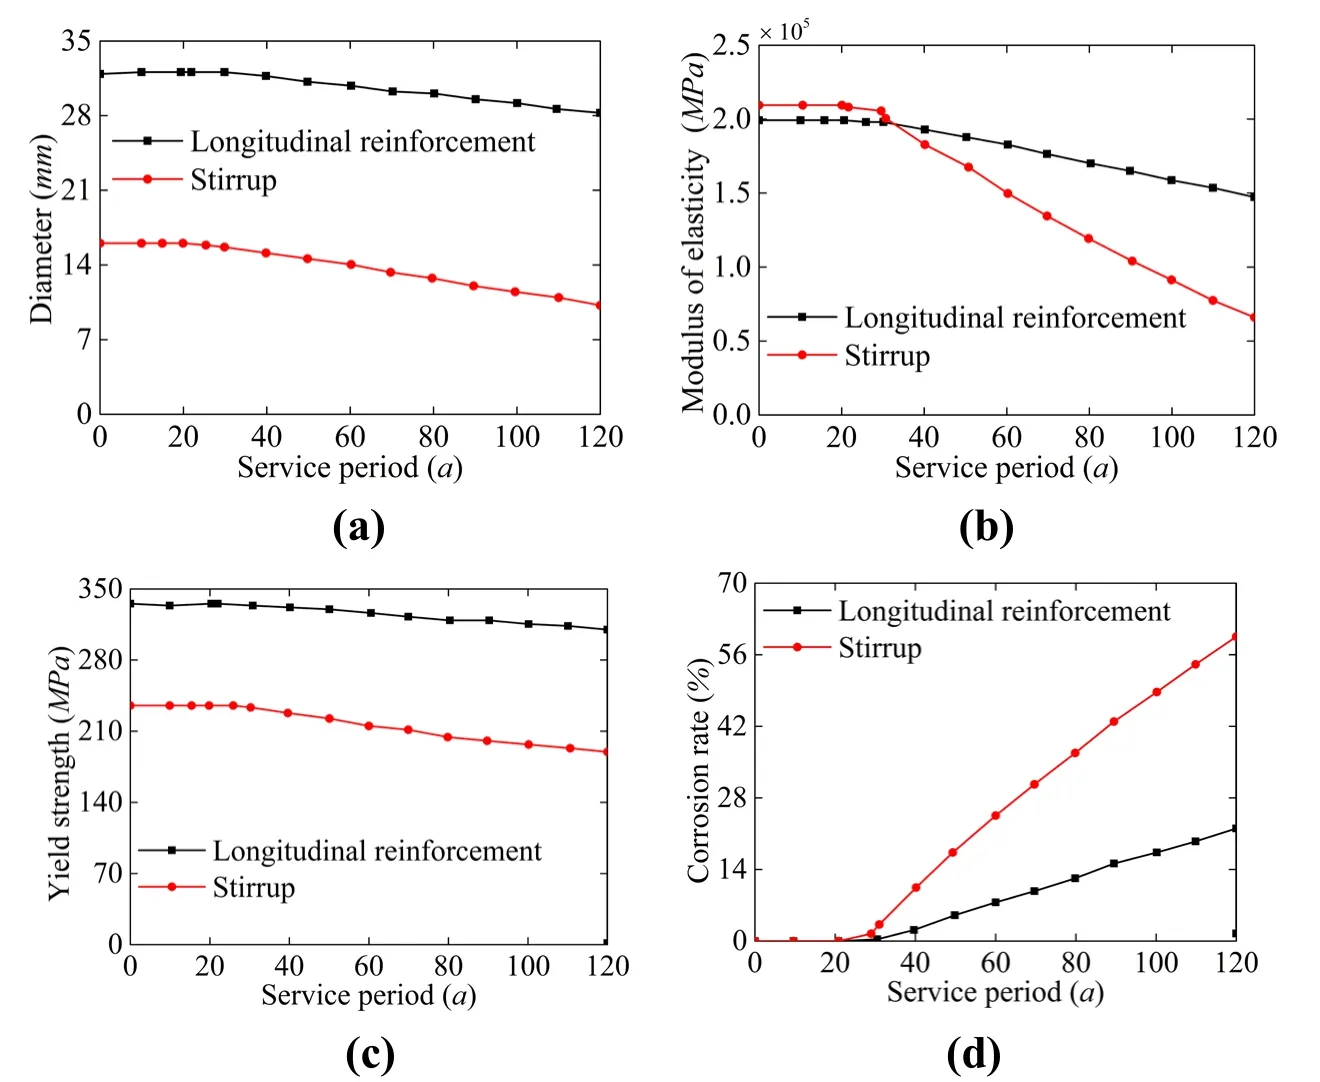
Figure 11:(a)Time-dependent curves of steel bar parameters of #2 and #3 piers for diameter;(b)Time-dependent curves of steel bar parameters of #2 and #3 piers for modulus of elasticity;(c)Time-dependent curves of steel bar parameters of #2 and #3 piers for yield strength;(d)Time-dependent curves of steel bar parameters of #2 and #3 piers for corrosion rate
(3)Analysis of material damage repair
The comparison and summary of corrosion rates of longitudinal bars and stirrups in the service period calculated based on Fick’s second law and the durability evaluation standard of concrete structures are shown in Fig.12.
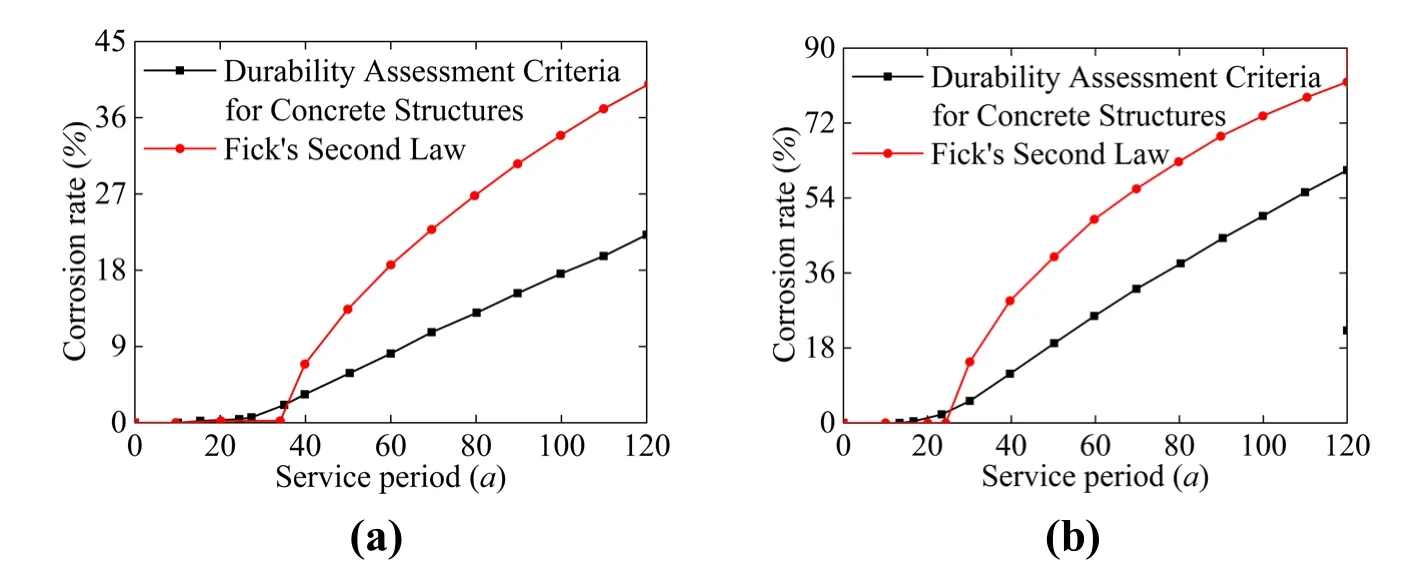
Figure 12:(a)Corrosion rate of longitudinal bar varies with time;(b)Corrosion rate of stirrups varies with time
Fig.12 shows that both methods of calculating the corrosion rate of the stirrups reveal that the initial corrosion time of the stirrups is earlier than that of the longitudinal bars,and the corrosion rate of the stirrups is much higher than that of the longitudinal bars after the cracking of the protective layer concrete.The corrosion rate of concrete with protective layer after cracking,which is calculated by Fick’s second law,is higher than that by Durability Assessment Criteria for Concrete Structures [Celik,Meral and Petek Gursel (2015);CECS (2007)].Some deviations between the two methods are discussed as follows.The deterioration process of concrete structure under the action of environment is very complex,and the randomness of various environmental factors is considerable.The Durability Assessment Criteria for Concrete Structures [Celik,Meral and Petek Gursel (2015);CECS (2007)] is compiled by accumulating a large number of engineering practice data and experience,which are more suitable for the durability study on concrete structures in offshore environments.Therefore,the calculation method based on the Durability Assessment Criteria for Concrete Structures [Celik,Meral and Petek Gursel (2015);CECS (2007)] is used to study the durability of materials.
1.Analysis of the mechanical characteristics of longitudinal bar considering crack repair In previous theoretical research on steel corrosion,the repair of concrete cracks in the protective layer is generally not considered in practical engineering,and the corrosion rate of steel after concrete cracks is higher than the actual value,thereby affecting subsequent research results of concrete structures.As shown in Tab.3,the critical crack width of concrete spalling is 1 mm.Thus,the bridge pier is assumed to be repaired when the concrete crack of the protective layer reaches 1 mm under chloride ion erosion,and after repair,the steel bar in the pier is in the state of corrosion before cracking.
Vidal et al.[Vidal,Castel and Francois (2004)] obtained the calculation method of crack width by analyzing the corrosion of reinforced concrete structure as follows:


In the formulas,wis the crack width (mm);Kis the coefficient,the value of which is 0.0575;andαis the corrosion coefficient,the value of which is 1 for uniform corrosion and 4 for non-uniform corrosion.
The parameters of the corroded steel bars of #1,#2,#3,#4,and #5 piers change regularly.Thus,the degradation process of the mechanical properties of #2 and #3 pier materials,considering the repair of concrete cracks in the protective layer,are presented in detail.The influence of chloride ion in air on offshore bridges is random.Eqs.(31)-(33)indicate that the crack width of the self-protective concrete reaches 1 mm,which lasts 0.759 years,assuming that the corrosion coefficient is 4.When the longitudinal steel bars begin to rust to crack the protective layer,using Eqs.(23)and (27),the average annual corrosion rate of steel bars is 0.015 (mm/a),and the average corrosion rate of protective layer is 0.061 (mm/a)after cracking.When the crack width reaches 1mm,the repair is carried out.After the repair,the corrosion rate of the steel is the corrosion rate prior to the crack of the protective layer,and the corrosion rate of the steel after the crack of the protective layer is considered in the #2 and #3 piers is shown in Fig.13.
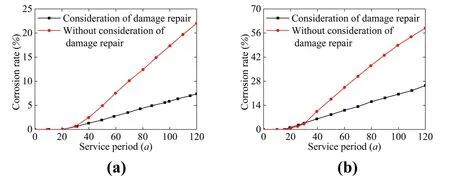
Figure 13:(a)Corrosion rate of steel bars considered and not considered for repair of longitudinal reinforcement;(b)Corrosion rate of steel bars considered and not considered for repair of stirrup
Fig.13 shows that the corrosion rate of steel bars decreased significantly during the service period of the bridges,and after 120 years of service,the corrosion rate of longitudinal bars and stirrups decreased by 65.99% and 57.48%,respectively.In the study of durability evaluation of concrete structures,the corrosion rate of steel bars is an important factor,and the durability of concrete structures should be studied by considering the repair of concrete cracks in the protective layer.
We can obtain the variation rule of longitudinal reinforcement diameter,yield strength,and elastic modulus with time when considering crack repair of the protective layer in accordance with the calculation method of concrete crack repair of protective layer,as shown in Fig.14.The characteristic values of steel bars corresponding to 10,30,50,70,100,and 120 years of bridge service are shown in Tab.10.

Figure 14:(a)Mechanical properties of longitudinal bars considered and not considered for repair of diameter;(b)Mechanical properties of longitudinal bars considered and not considered for repair of yield strength;(c)Mechanical properties of longitudinal bars considered and not considered for repair of modulus of elasticity
Fig.14 shows that the deterioration of longitudinal reinforcement diameter,yield strength,and elastic modulus is evidently reduced after considering the repair of concrete cracks in the protective layer.When the bridge is in service for 120 years,the diameter,yield strength,and elastic modulus of longitudinal reinforcement decrease by 8.23%,5.08%,and 18.66%,respectively.
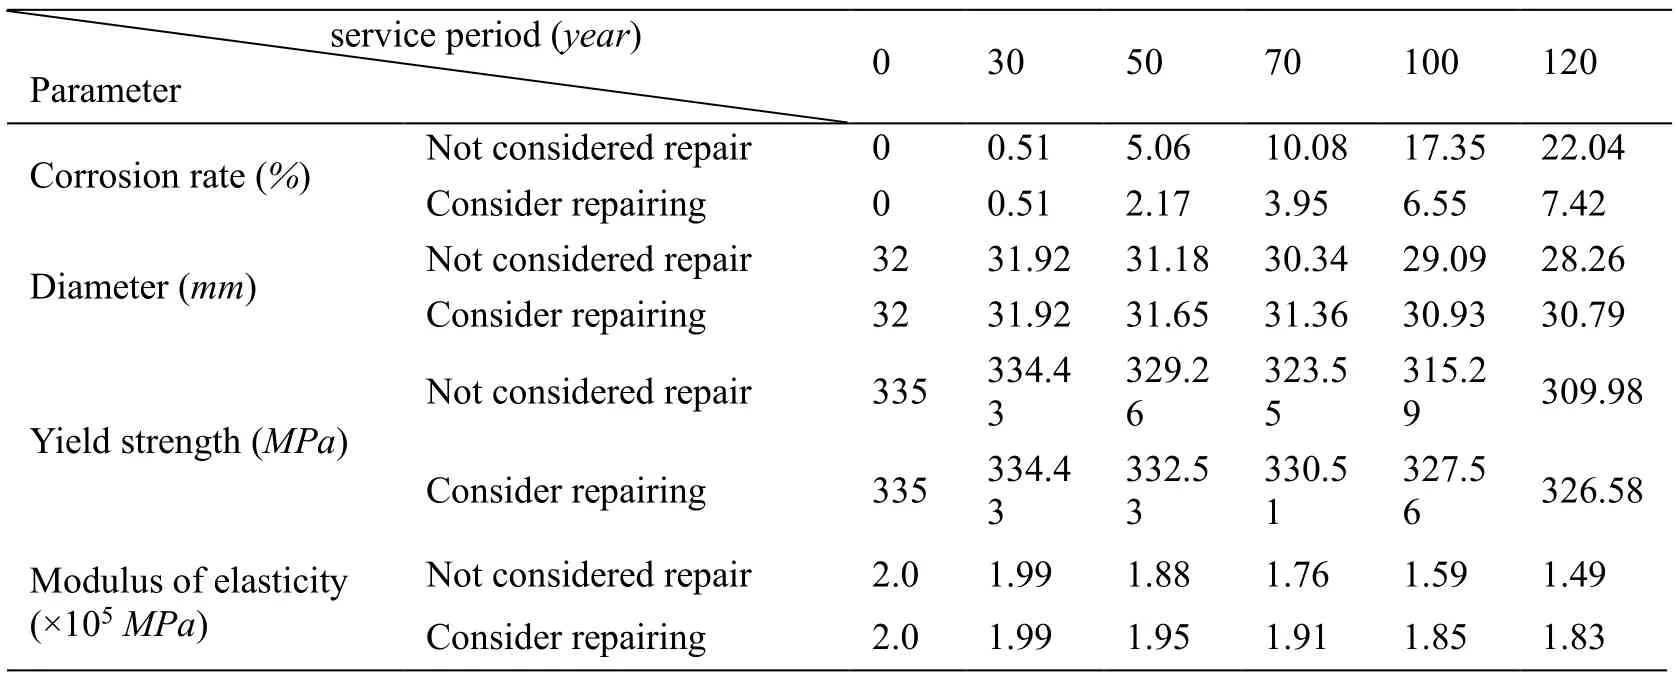
Table 10:Eigenvalues of longitudinal reinforcement in different service periods
2.Analysis of the mechanical properties of stirrups after crack repair
In offshore environments,the corrosion of steel bars in the longitudinal direction indirectly affects the mechanical properties of confined concrete,but the degradation of the stirrup material reduces its confinement to core concrete,thereby changing the peak stress and peak strain of the confined concrete.The corresponding diameter and yield strength of the stirrups can be calculated in accordance with the corrosion rate of the stirrups in different service periods.Then,the mechanical properties,such as peak stress and peak strain of the confined concrete,are calculated by the Mander model.The calculation basis and process are the same as the longitudinal reinforcement and will thus not be described here.
2.3 Analysis of bond slip mechanical properties
The bonding force between steel bar and concrete interface in the reinforced concrete structure ensures that the two materials work together;this force mainly includes chemical bonding force,friction force,and mechanical biting force.Concrete structures are not always in an elastic state under strong earthquakes and may even enter an elasticplastic stage.From the view of energy dissipation,the structure dissipates more seismic energy when it enters the plastic stage.Therefore,in modern seismic theory,under the premise of ensuring the bearing capacity of components,seismic energy is generally consumed through the hysteretic energy dissipation capacity of components.Most traditional finite element models only simulate the complete bond effect,that is,the joint between the steel and the concrete cannot simulate the impact of the bond slip on structural performance,thereby often overestimating the seismic performance of the bridge.The reasonable simulation of bond slip is also greatly significant for evaluating the seismic performance of bridges.
The bond-slip constitutive relationship curve between the steel bar and the concrete interface in the concrete structure is shown in Fig.15.The process is roughly divided into five segments [Fang (2004)]:0A:micro-slip segment,AB:slip segment,BC:split segment,CD:descending segment,and DE:residual segment.The four points A,B,C,and D correspond to the internal crack,split,limit,and residual state,respectively,representing the characteristic values of slip and bond strength.
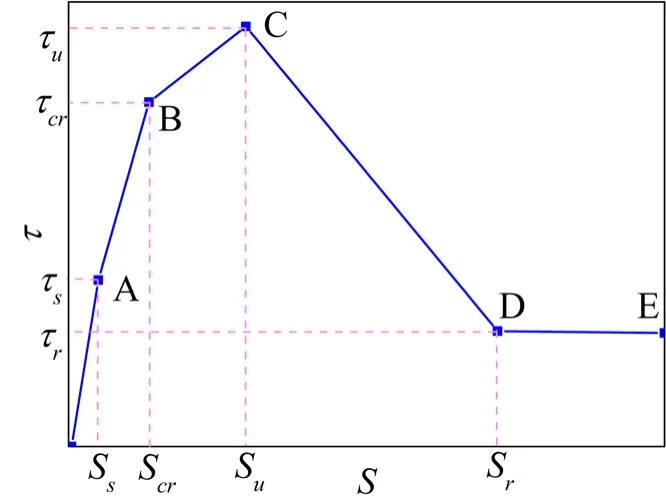
Figure 15:Bond-slip constitutive relation curve
The reinforced concrete pier is the main energy-consuming component of the bridge structure.A large number of seismic damages show that the bottom end of the structure is the first to be destroyed because it is most affected by the bond slip.Zhao et al.[Zhao and Sritharan (2007)] believed that the deformation of reinforced concrete piers under earthquake action mainly includes bending deformation and steel corner deformation.The deformation of the bottom end of the pier is analyzed by a zero-length unit (Fig.16),to better simulate the bond slip between the steel bar and the concrete at the bottom of the reinforced concrete pier.

Figure 16:Model of bond slip
At present,the commonly used models considering bond slip include rotating spring model,1D spring model,and separated spring model.The simplified model is shown in Fig.17.The spring element based on the fiber section model is used to analyze the effect of bond slip on the seismic performance of reinforced concrete piers and columns,which can consider the influence of section characteristics and reinforcement conditions on the seismic performance of structures.The modeling process is concise,and the calculation efficiency is high.

Figure 17:(a)Simplified model of bond slip for rotating spring model;(b)Simplified model of bond slip for 1D spring model;(c)Simplified model of bond slip for separate spring model
Bond_SP01 element and Zero-length Section Element provided byOpenSeessoftware are used based on the fiber section model to simulate the bond-slip constitutive model of steel bar and the deformation of the end part,respectively.These elements can simulate the bond-slip effect of two materials in reinforced concrete pier columns as well as improve the calculation accuracy and efficiency.The stress-slip relationship curves under monotonic and repeated loading are shown in Figs.18 (a)and 18(b),respectively.
Zhao et al.[Zhao and Sritharan (2007);Li (1997)] of Washington University,USA,studied the stress-slip curve model of the steel bar through experiments and obtained the calculation formula ofSyby fitting a large number of experimental data.

In the formula,αis the parameter that describes the local bond slip of the reinforcing bars,and the value is 0.4 according to theCEB-FIPModel 90 [FIB (2000)];dbis the diameter of the longitudinal reinforcement (mm);andfc’is the peak compressive stress of concrete (MPa).
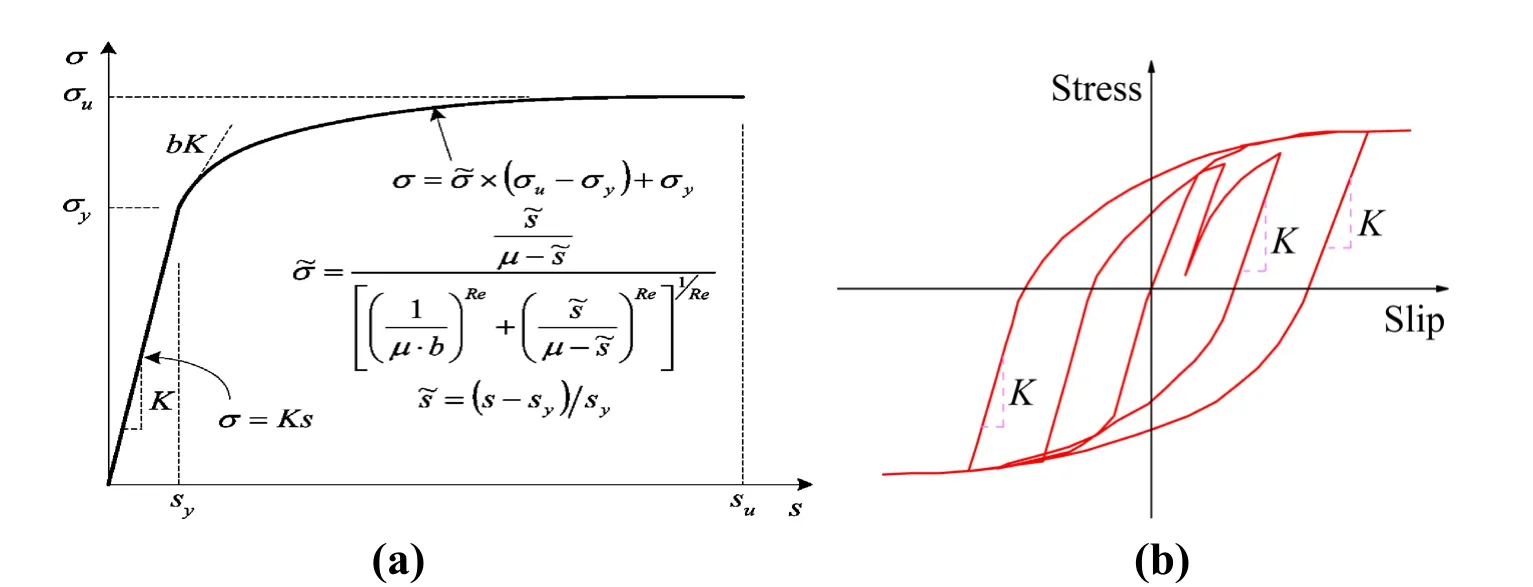
Figure 18:(a)Stress-slip curve under monotonic loading;(b)Stress-slip curve under cyclic loading
3 Establishment of finite element model
3.1 General situation of the bridge
The research object is an offshore 6×60mcontinuous rigid-frame bridge,and the dynamic increment method is used to analyze the fragility of the components and the system.The elevation layout of the bridge is shown in Fig.19.The cross-section form and characteristics of the beam are shown in Fig.20 and Tab.11,respectively,and the pier heights,concrete,and steel material characteristics,protective layer thickness,and axial compression are shown in Tab.12.

Figure 19:Bridge elevation layout

Figure 20:Section of the deck (m)

Table 11:Section characteristics of beam

Table 12:Material characteristics of piers
3.2 Simulation of beam
Under the earthquake,in most cases,the beam is in the elastic state,which seldom suffers injuries.Therefore,the beam is generally designed according to the elastic structure.In this paper,the elastic beam-column element is used to simulate the beam,and the unit length mass of the element includes the dead weight and second-stage load.Concrete 01 and steel 02 material constitutive models are used for the concrete of beam and steel bar,respectively.The concrete material characteristic parameters of different service periods,considering the influence of offshore environments,are given in Section 1.
3.3 Simulation of pier
3.3.1 Pier design
The bridge has five piers;except for the materials and connection mode of the pier top,the interface settings of each pier are the same.Only the #2 rigid-frame pier is taken as an example for detailed introduction.The bottom of the pier is an enlarged foundation,the pier top is consolidated with the beam,and the cross section is hexagonal.The Mander model is used to divide the section into concrete with confined concrete and protective layer,considering the influence of the stirrup on the concrete in the core area.The specific section form and reinforcement of the pier are shown in Fig.21.

Figure 21:Design of pier section
3.3.2 Definition of pier model
(1)Element type of material
Concrete 01,steel 02,and Bond-SP 01 constitutive models are adopted and combined with the research results of durability in Section 1 for rigid-frame pier concrete,longitudinal reinforcement,and bonding slip material,respectively.The characteristic parameters of concrete and steel in rigid-frame piers for bridge service life of 0,30,50,70,100,and 120 years are shown in Fig.6 and Tab.10.The characteristic parameters of the plastic hinge zone bond slip material at pier bottom for the same service life are shown in Tab.13.
InOpenSeessoftware simulation,the pier is divided into 37 nonlinear beam-column elements.The expanded foundation at the bottom of the rigid-frame pier is directly consolidated without considering the pile-soil interaction.The zero-length section element is used at the bottom of the pier to simulate the angular and displacement deformations caused by bond slip.The consolidation between the pier top and the beam is simplified as a zero-length element.The simplified model of the rigid-frame pier is shown in Fig.22.
(2)Division of fiber section
The section of the rigid-frame pier is an irregular rectangle or sector.Thus,the concrete should be divided quadrilaterally.The division method and situation are shown in Figs.23 and 24.The division method of steel fiber is the same as that of concrete;thus,it will not be repeated here.

Figure 23:Division method of concrete

Figure 24:Fiber division of rigid-frame pier section
3.3.3 Simulation of pier
Reinforced concrete piers,the most common form of piers,are mainly composed of bending and shear failure.Highly flexible piers often undergo ductile bending failure,which produces large plastic deformation.Brittle shearing damage also occurs in short thick piers.As the example has high piers,the nonlinear beam-column element inOpenSeessoftware material library is selected to simulate the plastic deformation at the end of the piers,which are prone to bending failure under earthquake.The characteristic value of the bond-slip material of steel bars is shown in Tab.14.

Table 14:Parameters of Bond-SP 01 material
3.4 Simulation of bearing
Spherical bearings are used for all bridge bearings in this study,and their structural composition is shown in Fig.25.The small sliding friction between the spherical plate and the spherical polytetrafluoroethylene (PTFE)plate enables flexible rotation.The sliding between the upper support plate and the flat PTFE plate realizes the displacement.Spherical force transmission avoids the force reduction phenomenon,and the bearing capacity is better.The connection forms of the pier and beam of offshore bridges selected in this section are shown in Tab.15.QZ12500 andQZ6000 spherical bearings are used in #1,#4,and #5 piers and abutment.When establishing the bearing model,based on the calculation method of Jiong [Jiong (2007)],the horizontal stiffness values ofQZ12500 andQZ6000 bearings are set to 125,000kN/mand 60,000kN/m,respectively,by defining a large vertical stiffness to simulate vertical constraints.

Figure 25:Spherical bearing structure

Table 15:Connection form between pier and beam
3.5 Simulation of abutment
In the seismic design of bridges,an expansion device is often used to reduce the effect of the seismic inertia force of the beam on the abutment to ensure the integrity of the backfill behind the abutment.The left abutment of the bridge is equipped with a modular expansion device,the expansion is 2240 mm,and the right abutment is equipped with an MTL-320 expansion device to reduce the abutment response.
Chinese codes have no explicit regulation for abutment simulation.Thus,the simplified model of abutment is established according to Caltrans Seismic Design Criterial Version 1.6 in 2010 by simplifying the interaction between abutment and main girder into longitudinal and transverse stiffness [Caltrans Seismic Design Criterial Version (2010)].The rigid elements are established at the same width of the beam.The abutment simulation method inOpenSeessoftware is shown in Fig.26.Only the seismic response of bridges under longitudinal seismic action is studied;the influence of lateral filling is disregarded.Uniaxial elastic material constitutive model with large stiffness is adopted in lateral and vertical directions to consider the effect of expansion joints.Hyperbolic gap material model is used in longitudinal bridge,and zero-length element is used to simulate abutment.
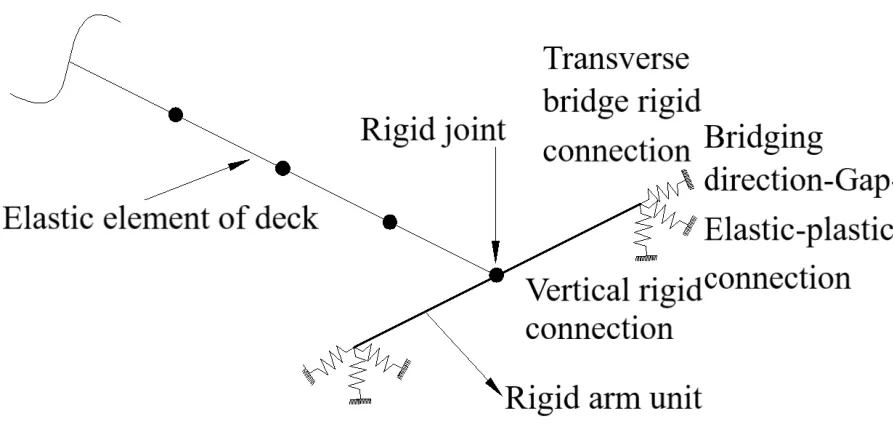
Figure 26:Sketch of bridge abutment simulation
4 Seismic motion and fragility analysis
4.1 Selection of ground motion
Ten eligible seismic waves are selected from the ground motion records provided by the Pacific database of the United States in accordance with the target response spectrum.The characteristic period,peak acceleration,and duration of the selected seismic waves should be consistent with the site conditions and bridge characteristics.The specific conditions of the original seismic waves selected for the nonlinear analysis of bridges are shown in Tab.16.At present,the commonly used strength indicators are peak acceleration (PGA)and spectral acceleration (SA).SA is selected as a strength indicator to obtain sufficiently discrete ground motion and improve fragility evaluation results.The spectral acceleration value of 10 selected seismic waves is determined,the amplitude ofSAis adjusted to 150 seismic waves by MATLAB software,and the spectral acceleration range is 0.01-1.5 g,in accordance with the characteristic of the bridge (1.012s).
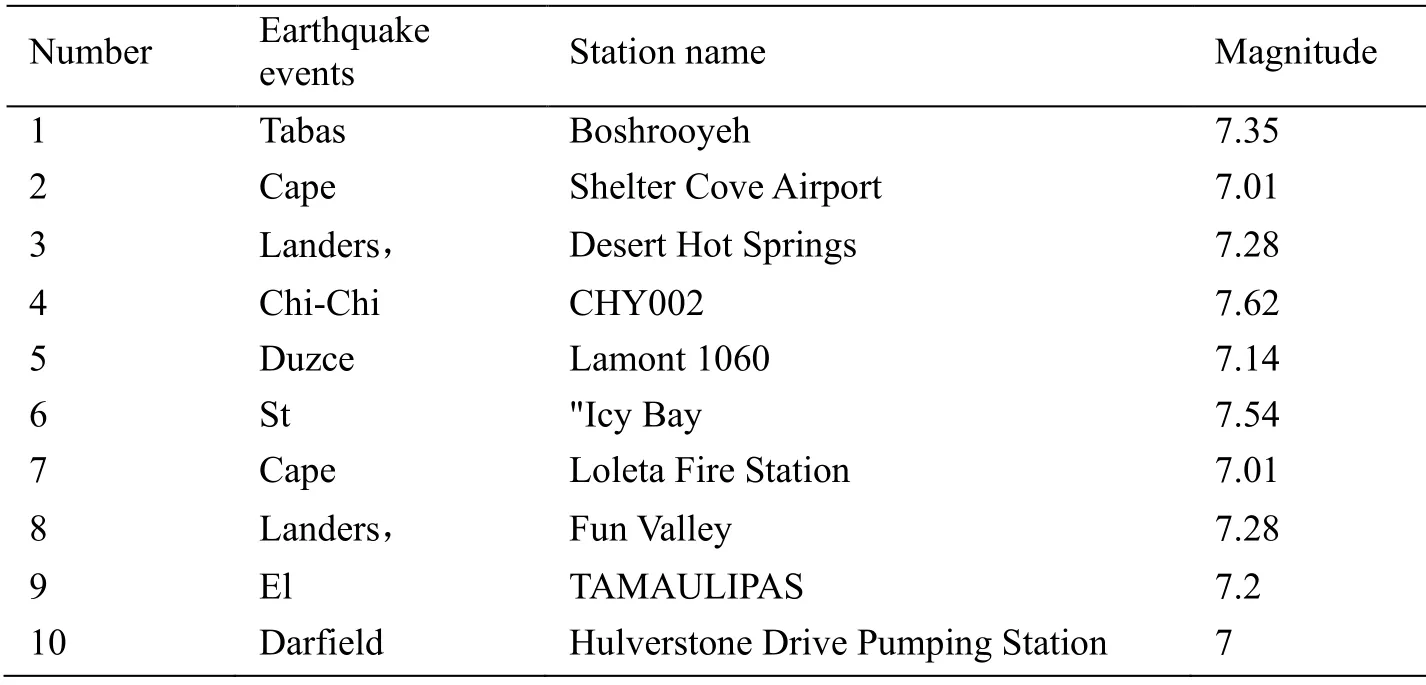
Table 16:Primitive seismic station and magnitude
4.2 Seismic action based on time-varying properties
During the service period of offshore bridges,the changes in seismic fortification standards in the area where the bridges are located may cause different seismic effects on the structures,and material deterioration may occur due to the influence of the surrounding environment.As a result,the seismic performance and seismic demand of the structures change with time and a reasonable evaluation of the bridge structures must be conducted.
Gao et al.[Gao and Bao (1985)] assessed the seismic safety of existing structures and found that the base period of evaluation changes with the change in service time.He also provided reasonable and feasible seismic action criteria for seismic evaluation and reinforcement design of existing structures.
Earthquake recurrence period is obtained as follows:

In the formula,Tis the earthquake recurrence period (a),Pis the annual exceedance probability,andtis the follow-up service life of the structure (a)
The Chinese seismic design code suggests that the 100th year is the reference period of bridge design.The seismic effects of different follow-up service years of the structure are calculated according to frequent,fortification,and rare earthquakes,whose exceedance probability values are 63.2%,10%,and 2.5%,respectively [Monteiro,Branco,Brito et al.(2012)].
Fortification IntensityIis obtained as follows:

In the formula,Xis the earthquake recurrence period (a);and the values ofa,b,andcin the basic intensity region of seven degrees are 0.02,1.50,and 2.85,respectively.
The expressions of peak accelerationAand maximum earthquake impact coefficientamaxare shown in Eqs.(39)and (40),respectively [Hall,Heaton,Halling et al.(1995)].

The time-varying law of the maximum intensity of seismic action evaluation and the influence coefficient of seismic action,considering the uncertainties of seismic action in the subsequent service period,are calculated by combining them with the seven-degree area of foundation intensity in the example field,as shown in Fig.27.

Figure 27:(a)Seismic time-varying effect of earthquake intensity;(b)Seismic timevarying effect of peak acceleration;(c)Seismic time-varying effect of maximum influence coefficient of earthquake action
4.3 Fragility analysis
Earthquake fragility refers to the possibility of different degrees of damage or the probability of exceeding a certain limit state under different intensity earthquake actions.Computational efficiency is significantly improved with the continuous improvement of computer hardware performance.Among the many methods of seismic fragility analysis,the method based on structural nonlinear dynamic time history analysis has gradually become an important tool for probabilistic seismic analysis and optimization of bridge seismic design in the performance-based seismic engineering field.The specific calculation method is as follows [Hwang,Liu and Chiu (2001)]:

In the formula,Pfis the exceedance probability,IM (SA/PGA)is the ground motion parameter representing the intensity of the ground motion,SA is the spectral acceleration,and PGA is the peak acceleration of the ground motion.Dis the seismic response of the structure under the earthquake,corresponding to the structural demand;Cis the structural damage index,corresponding to the structural capacity;Scis the structural capacity;andSdis the structural demand according to classical reliability theory.The two parameters are often assumed to obey lognormal distribution [Hwang,Liu and Chiu (2001);Zhang and Huo (2009)];μcandβcare the mean and logarithmic standard deviation of the structural seismic capacity,respectively;andμdandβdare the mean and logarithmic standard deviation of the structural seismic demand,respectively.
The seismic fragility function is transformed into a standard normal distribution based on Eqs.(42)and (43),as shown in Eq.(40).

Cornell et al.[Cornell,Jalayer,Hamburger et al.(2002)] assumed that the mean valueμdof the earthquake demand parameter (EDP)is exponentially related to the ground motion intensity parameter IM,as shown in Eq.(41).The probabilistic seismic demand model can be obtained by taking logarithms on both sides of the model,as shown in Eq.(42).

In the formula,aandbare constants.The seismic fragility function can be obtained by introducing Eq.(42)into Eq.(40),as shown in Eq.(43).

According to HAZUS99 [HAZUS99 (1999)],when the spectral acceleration SA is considered an independent variable,is 0.4.
5 Time-varying seismic fragility analysis of continuous rigid-frame bridge considering bond slip
At present,structural failure criteria mainly include strength,deformation,energy,double index,and performance-based failure criteria [Kiureghian and Neuenhofer (1992)].Performance-based failure criterion is a multi-stage seismic design idea that considers the use,function,and safety of the structure,which closely links the performance objectives of the structure with its damage status.Therefore,the damage status of different components in the bridge system under earthquake must be determined.Bridge construction technology and construction process affect the mechanical properties of the completed bridge.The durability of offshore bridge materials is damaged and the seismic performance of the bridge is changed with the extension of service period.The timevarying seismic fragility of bridge is analyzed by the evaluation system for the seismic safety of highway bridges and exceedance probability in seismic codes.It has great practical significance for earthquake relief and post-disaster reconstruction of bridges.
5.1 Fragility analysis of piers
5.1.1 Damage index of piers
Displacement,capacity demand,or displacement ductility ratio are generally used as damage indices of piers in the analysis of pier fragility.Seismic damage can be divided into five states,as follows:non-damage,minor damage,medium damage,serious damage,and complete destruction [Hose,Silva and Seible (2000);Jernigan (1998)].The use of displacement ductility ratio as a damage index is feasible and convenient to analyze pier fragility because of the bending failure of bridge piers.The definition of damage state of pier by displacement ductility ratio [Hose,Silva and Seible (2000)] is shown in Tab.17.
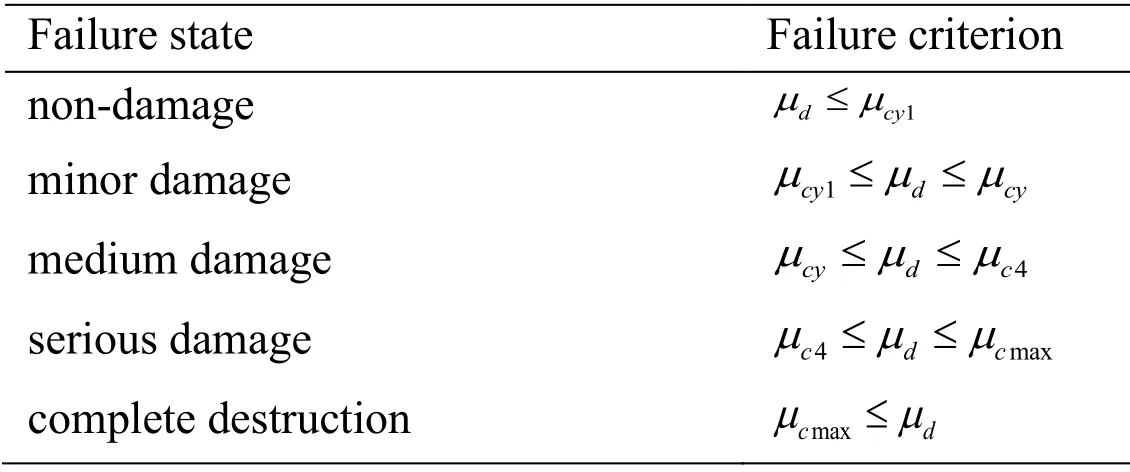
Table 17:Definition of pier failure state by displacement ductility ratio
The expression of pier displacement ductility ratio is as follows:
In the formula,Δis the relative displacement of the pier top under earthquake (mm),andΔcy1is the relative displacement of the pier top when the steel bar of the pier bottom section yields for the first time (mm).
The critical value of displacement ductility ratio corresponding to the five damage states are calculated according to the theory of Clark et al.[Clark,Chan and Du (2005)].The section curvature of the first yield,equivalent yield,strain of 0.004,and ultimate state are obtained,and then the displacement ductility ratio of the corresponding state is determined according to the calculation principle.
The calculation process for the damage index of the pier under different limit states is as follows [Masanobu,Feng and Jongheon (2000)]:

In the formula,Δcyis the relative displacement of the pier top when the pier section yields equivalently,Δc4is the relative displacement of the pier top when the strain is 0.004,φ’is the first yield curvature,φis the equivalent yield curvature,Lis the distance from the plastic hinge section to the reverse bending point,andLPis the equivalent plastic hinge length [Beer,Kougioumtzoglou,Patelli et al.(2015)].
5.1.2 Time-varying fragility analysis of piers
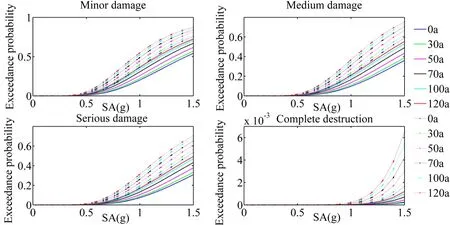
Figure 28:Time-varying seismic fragility curve of #2 pier
The time-varying fragility curve of five piers under four damage states are obtained through the seismic analysis with service life of 0,30,50,70,100,and 120 years,considering the material damage of offshore bridges with the extension of service life.Only the curve of #2 pier is presented in Fig.28 because the fragility curves of #1,#2,#3,#4,and #5 piers are basically similar.
Fig.28 shows that under earthquake action,the exceedance probability under four damage states of piers increases with the increase in service life.In addition,the difference between disregarding and considering the bond slip of the same component under the same state gradually reduces with the increase in service life owing to the deterioration of materials and the decrease in seismic performance.The slip between the steel bar and the concrete in the yield and the ultimate state of the steel bar and the difference between neglecting and considering the bond slip decrease as well.The exceedance probability of piers increases with the increase in seismic intensity and service life,and the changes in two rigid-frame piers are more evident due to the increase in seismic intensity leading to the increase in pier top displacement and service life,thereby causing the deterioration of bridge materials.Finally,the decrease in pier seismic absorption capacity and the increase in pier top displacement increase the exceedance probability.WhenSA≤0.6g,the exceedance probability under serious damage and complete destruction of rigid-frame piers is less than 1%.This Figure indicates that no two damage states of the rigid-frame piers under earthquake exist in this intensity range.Therefore,their safety and seismic performance is good.
5.2 Fragility analysis of bearings
5.2.1 Damage index of piers
Previous bridge seismic damage shows that the commonly used damage indicators include bearing shear,displacement or relative displacement,displacement ductility ratio,and shear strain.Shear strainγis often used as a damage indicator for plate rubber bearings,and displacement is often used for slide plate,basin,and spherical movable bearings.The common failure of spherical steel bearings is mainly caused by the displacement of the bearings beyond the allowable range.Related research [Choi,Desroches and Nielson (2004)] recommended the relative displacement values of 37,104,136,and 187 mm as damage indices of the bearings.
5.2.2 Time-varying fragility analysis of bearings
Consistent with the time-varying fragility analysis method,the curves of five bearings under four damage states are obtained.Only the curve of #2 bearing (#1 pier top bearing)is presented in Fig.29,given that the fragility curves of #1,#2,#3,#4,and #5 bearings are basically similar.
Fig.29 shows that the difference of exceedance probability between disregarding and considering the bond slip of the same component under the same damage state gradually reduces with the increase in service life.Such reduction is attributed to the material deteriorating and the slip between the steel bar and the concrete decreasing with the extension of service,thereby resulting in the reduction of displacement difference between the pier top.Therefore,the displacement difference between the bearing and the exceedance probability is reduced.For example,in #1 pier bearing that suffers from the earthquake effect of SA=0.2gfor 0,30,50,70,100,and 120 years of service,the respective differences of exceedance probability under minor damage is 2.74%,2.42%,2.14%,2.19%,2.04%,and 1.8%.The exceedance probability increases with the increase in seismic spectral acceleration and the service life of the bridge because of the increase in seismic intensity,which increases the displacement response of the pier top.The increase in service life leads to the deterioration of the materials,decrease in seismic absorption capacity of piers,and increase in displacement response of pier top.Furthermore,the increase in the displacement of the pier top increases the displacement of the bearing,thereby increasing the exceedance probability.

Figure 29:Time-varying seismic fragility curve of #2 bearing (#1 pier top bearing)
5.3 Fragility analysis of abutments
5.3.1 Damage index of abutments
Abutment is one of the vulnerable components of bridge structure,but no uniform methods are available to determine the damage index of abutment.HAZUS (American Earthquake Risk Assessment Software)regards abutment displacement over 50 mm as the criterion for judging medium damage failure state [Dhs (2009)].Choi [Choi (2002)] considered that the active deformation of abutment is related to the settlement of backfill behind abutment and placed the maximum displacement of backfill behind abutment as the critical values of four failure states of abutment at 4,8,25,and 50 mm.In this section,50 mm is selected as the benchmark value of abutment damage and failure state.The corresponding amplitude modulation coefficients of the four damage states are 0.5,1.0,2.0,and 3.0,and the corresponding critical displacement value of abutment is obtained by conversion [Park (1985)].
5.3.2 Time-varying fragility analysis of abutments
Consistent with the time-varying fragility analysis method of piers,the curves of two abutments in four damage states are obtained.Only the curve of the left abutment is presented in Fig.30,given that the law of fragility curves of the left and right abutments is similar.
Fig.30 shows that the exceedance probability of abutment increases with the increase in spectral acceleration and with the extension of bridge service time.For example,in the left abutment,when SA=0.2g,the exceedance probability under minor,medium,serious damage,and complete destruction in the service period of 0,30,50,70,100,and 120 years increased by 1.14%,1.59%,1.27%,0.83%,and 0.53%,respectively.
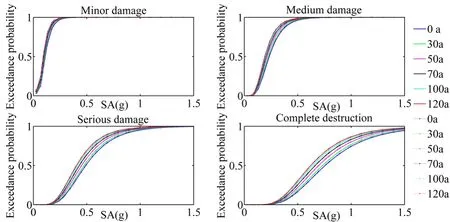
Figure 30:Time-varying seismic fragility curve of the left abutment
5.4 Fragility analysis of the bridge system
Bridges are composed of beams,piers,abutments,and bearings.Any component may be damaged in an earthquake;thus,the bridge fragility analysis should include system fragility rather than single-component fragility.At present,most studies do not consider the correlation between components,focusing instead on component-level research.The overall ductility of the structure is closely related to the ductility of each component,and the fragility of the bridge system is higher than that of each component.Thus,the seismic performance of the bridge is overestimated using the single component [Nielson and Desroches (2007)].Therefore,the system fragility of the bridge system considers the correlation among piers,bearings,and abutments.
The common methods of bridge system fragility research include first-order boundary and second-order boundary methods,which are easy to understand and operate and are widely used in engineering applications.The first-order boundary method has series and parallel models.The series model considers components are completely correlated.If any component is destroyed,then the entire structure will be destroyed.This model has the lower bound of system exceedance probability.When the components are fully correlated,the minimum exceedance probability of these components is the upper bound of the system exceedance probability.
The commonly used first-order boundary method is the series model because the upper and lower bounds of the parallel model are wider and a large difference exists between the parallel model and the actual bridge evaluation.The calculation is shown in Eq.(50).

Ditlevsen et al.[Ditlevsen (1979);Hunter (1976)] put forward the method of exceedance probability of the entire structure,which is the second-order boundary estimation method,considering the correlation between different components,as shown in Eq.(51).

In the formula,Psysis the system exceedance probability;PfiandPfjare the exceedance probabilities of componentsiandj,respectively;Pfijis the exceedance probability of componentsiandjbeing destroyed simultaneously;andnis the number of components that may be destroyed.
The upper and lower limits of the fragility curve obtained by the second-order boundary method are within the first-order boundary method.The damage probability range of the system is evidently reduced because the first-order boundary method only considers the components to be completely correlated or independent.The fragility range of the system is wider and the error is large.However,the second-order boundary method considers the actual correlation between components,and the system fragility range is narrowed.Thus,the seismic performance of the bridge system can be accurately evaluated.The secondorder boundary method is used to calculate the system fragility to more accurately describe the influence of bond slip on the system fragility.The method can also reflect the time-varying fragility of the bridge structure under material deterioration and different earthquake intensities given that the system is closely related to the component.The exceedance probability of the same damage state corresponding to a different service life is plotted on a graph,called the seismic fragility surface,which considers the durability degradation of materials,bond slip,and time-varying effect of earthquake ground motion,as shown in Fig.31.
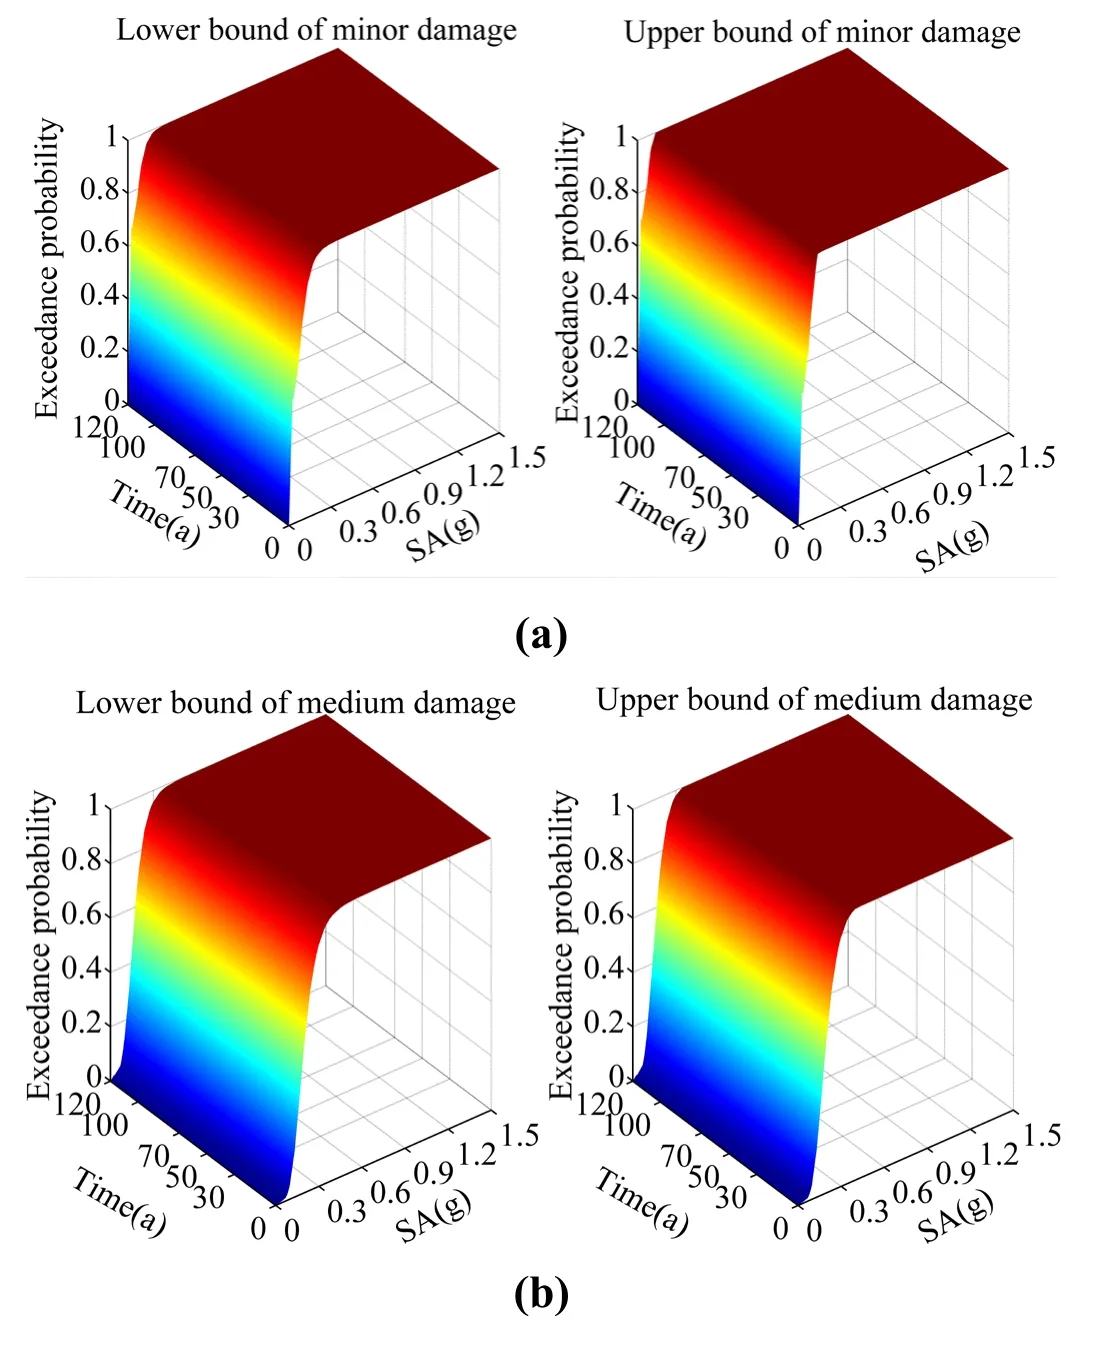

Figure 31:(a)System fragility surface under minor damage;(b)System fragility surface under medium damage;(c)System fragility surface under serious damage;(d)System fragility surface under complete destruction
Fig.31 shows that during earthquake,with the increase in seismic spectral acceleration and the extension of service time,the exceedance probability of the system increases gradually.In addition,the dynamic response of each component increases with the increase in earthquake intensity and the deterioration of the material,thereby increasing the exceedance probability of the component.Additionally,the fragility of the system increases.When SA is greater than 0.3 g,the probability of minor and medium damage is almost 1;when SA is greater than 0.6 g,the probability of serious damage is almost 1;and when SA is greater than 0.9 g,the probability of complete destruction increases in value.
6 Conclusio ns
The time-varying seismic fragility of offshore bridges is studied based on the numerical simulation of theOpenSeesplatform by incremental dynamic analysis method,considering the durability degradation of concrete carbonation,steel corrosion,and degradation of bond-slip performance of an offshore long-span continuous rigid-frame bridge.The main conclusions are as follows.
The durability degradation process of materials caused by concrete carbonization and chloride ion erosion in an offshore environment is described in detail.We also provide a detailed introduction of the time-varying model of the mechanical properties of carbonated concrete and corroded steel bars in an offshore environment as well as the damage repair model of reinforced concrete structures under the boundary condition of durability degradation analysis with the limit value of crack width of the protective layer concrete.
During an earthquake,the exceedance probability of piers,bearings,and the system under different damage states increase clearly when bond slip is considered.With the increase in seismic spectral acceleration,the influence of bond slip on the exceedance probability of piers and bearings becomes greater.The slip between steel bar and concrete and the displacement of bearing and pier top increase during earthquake.Bond slip greatly influences the seismic fragility of piers and bearings.If the bond slip is disregarded,the seismic performance of the bridge structure will be overestimated.
In the entire life cycle,the exceedance probability of the bridge components and the system under different damage states increases with the extension of service life and the increase in earthquake intensity.The slip between reinforcement and concrete decreases due to the durability degradation of materials,which decreases the influence of the bond slip on seismic fragility with the extension of service life.
The upper and lower bounds of the fragility curve of the bridge system in the entire life cycle are clearly reduced under the second-order boundary method,considering the durability degradation,bond slip,and seismic time-varying effects of materials comprehensively,compared with the first-order boundary method,which can effectively improve the calculation accuracy.
Acknowledgments:This work was supported by the National Natural Science Foundation of China (Grant Nos.51608488,11872339,11472248).
杂志排行
Computer Modeling In Engineering&Sciences的其它文章
- Forced Vibration of the Non-Homogeneously Pre-Stressed System Consisting of the Hollow Cylinder and Surrounding Medium
- Dynamic Analyses of a Simply Supported Double-Beam System Subject to a Moving Mass with Fourier Transform Technique
- Numerical Study of Trapped Solid Particles Displacement From the Elbow of an Inclined Oil Pipeline
- Analytical and Numerical Solutions of Riesz Space Fractional Advection-Dispersion Equations with Delay
- 3-D Thermo-Stress Field in Laminated Cylindrical Shells
- Partitioned Method of Insect Flapping Flight for Maneuvering Analysis
