Optimization and Effects of Catalytic Ozonation of Actual Phenolic Wastewater by CuO/Al2O3
2019-10-31MaRuiLiuGuangminFengSihuiQiuXiaoyuZhangYanqingXiaShumeiXueJianliang
Ma Rui; Liu Guangmin; Feng Sihui; Qiu Xiaoyu;Zhang Yanqing; Xia Shumei; Xue Jianliang
(1. College of Materials Science and Chemical Engineering, Harbin Engineering University, Harbin 150001;2. College of Chemical and Environmental Engineering, Shandong University of Science and Technology, Qingdao 266590)
Abstract: Ιn order to improve the ability of ozone to catalyze the degradation of phenolic pollutants in wastewater, the CuO/Al2O3 catalysts was prepared by the impregnation precipitation method and an ozone catalytic oxidation system was constructed. The actual phenolic sewage was used as the treatment object. And the reaction conditions of the system were optimized, and the treatment effect was determined, while the non-catalytic system was used as a control group. At the same time, the influence of salt and ammonia nitrogen related water quality on the system was studied. The optimal reaction conditions for the treatment of phenolic wastewater covered: a catalyst dosage of 30 g/L, an ozone flow rate of 0.3 m3/h, a pH value of 8.80, and a reaction time of 15 minutes. Under these conditions, the phenol and COD removal rates of the system reached 98.7% and 49.4%, respectively, which were by 31.3 percentage points and 16.2 percentage points higher than that of the ozonation system alone. The salt and ammonia nitrogen in the sewage can reduce the oxidation effect of the system.When the salinity reached 10% and the ammonia nitrogen content reached 13 000 mg/L, the removal rate of phenol could be reduced by about 20%. The results of this paper have a reference value for phenol wastewater treatment engineering.
Key words: CuO/Al2O3 catalyst; catalytic ozonation; phenolic wastewater; reaction conditions; water quality factor
1 Introduction
Phenolic compounds, as common industrial chemicals,are extensively consumed for production and application purposes[1]. Due to the refractory and highly toxic phenolic substances in sewage, the phenolic wastewater has become one of the most difficult types of sewage treatments in the field of industrial wastewater in China[2-5]. The treatment of refractory toxic and harmful industrial wastewater, especially the effective treatment of phenolic wastewater, has become an important research topic in the field of environmental engineering in China[6].At present, the commonly used methods for treating phenolic wastewater mainly include the physicochemical,biological, and chemical methods. Physical method needs simply to operate, but it is not suitable for treating the highconcentration phenolic wastewater. The biological method has lower processing cost and large processing capacity,but the processing period is long and is susceptible to external conditions, such as temperature. Ιn comparison,the development of chemical methods is relatively mature,and the advanced oxidation method is used widely because of its high efficiency in treating wastewater[7-8]. However,common chemical methods have problems of dealing with caustic reaction conditions, large amounts of chemicals used, and high cost, which limits the application prospect.Ιn chemical methods, the heterogeneous catalytic ozonation technology has a lot of advantages, including strong oxidation, easy realization of achieved reaction conditions, and recoverable catalysts[9-10], albeit with low selectivity due to the existence of catalyst. Thus, it has become the preferred technology for treating toxic and harmful pollutants.
The activity of catalysts is the key for determining the catalytic oxidation effect. The activated carbonsupported catalysts and the alumina-supported catalysts are commonly used. The activated carbon-supported type of catalysts mainly includes TiO2/AC[11]and the activated carbon supported copper[12]. The alumina supported type of catalysts mainly includes the γ-Al2O3supported Ni2+[13],CuO/Al2O3, and NiO/Al2O3[14-15]. The phenol removal rates can reach 45% ~ 100% when using these catalysts.However, the reaction rate is still not high and the reaction time is long, which generally ranges from 1 h to 3 h[11-15].Therefore, improving the activity of catalysts, improving the efficiency for removal of phenol, shortening the reaction time and reducing the cost of treatment are urgent issues to be resolved in the field of catalytic ozonation.
Ιn this work, the CuO/Al2O3catalysts were prepared by the impregnated precipitation method. With the actual phenol wastewater used as the target, we constructed the process for catalytic ozonation of phenol wastewater by CuO/Al2O3catalyst and investigated the effects of the reaction conditions and sewage water quality factors on the degradation of the phenolic wastewater. The results can provide a useful reference for phenol wastewater treatment projects.
2 Experimental
2.1 Preparation of catalysts
CuO was loaded on Al2O3by impregnation precipitation method. The preparation process was as follows: The activated carrier Al2O3pellets were poured into 100 mL of 0.4 mol/L Cu(NO3)2solution and were then immersed in a constant temperature water bath at 55 °C for 24 h,and the supernatant was discarded. Next, one hundred milliliters of 0.4 mol/L precipitant solution was added and immersed in a constant temperature water bath at 55 °C for 24 h, after which the supernatant was discarded, and the precipitant solution was filtered. The pellets obtained after filtration were dried in a constant temperature water bath at 80°C for 36 h, dried in an oven at 110 °C for 12 h,and calcined in a muffle furnace at 400 °C for 4 h. After natural cooling, the pellets were taken out and placed in a desiccator. The Al2O3pellets used as carrier in this paper were purchased from the Sinopharm Chemical Reagent Co., Ltd. The diameter of the spherical pellets was 5 mm.
2.2 Catalytic ozonation of phenolic wastewater
The phenolic wastewater used in the experiment was the actual sewage sample, which was taken from the effluent washing water of a gas plant in Xinjiang. The specific water quality indicators are shown in Table 1.
The oxidation reactor used in the catalytic ozonation experiment had a columnar structure, and the effective volume of the reactor was 0.1 L, with an aerator arranged inside the reactor. The catalysts were filled in the reactor to a certain height. The ozone flow was regulated by a ventilated switch. The reaction time was 15 minutes, and sampling was conducted every 3 minutes. Samples were filtered through a 0.45 μm microporous filter membrane.
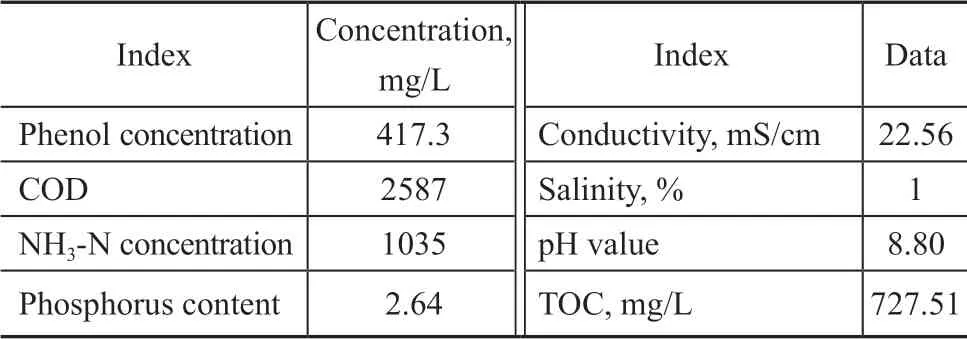
Table 1 Actual phenolic wastewater quality indexes
The 4-aminoantipyrine photometric method was used to determine the concentration of phenol. The COD concentration was measured by a COD fast digestion analyzer (LTG082.53.40001). The concentration of ammonia nitrogen was determined by Nessler’s reagent spectrophotometry. The TOC concentration was measured by using a TOC analyzer (MODLE 1030).
3 Result and Discussion
3.1 Influence of reaction conditions on the efficiency of phenolic wastewater removal
The study target was 100 mL of actual phenolic wastewater with a concentration of 417.3 mg/L. The effects of the ozone flow rate, the catalyst dosage, and the initial pH value of the wastewater on the phenol removal efficiency and COD removal rate were investigated.
3.1.1 The flow of ozone
The experimental conditions covered: a catalyst dosage of 30 g/L, a wastewater pH value of 8.80, and an ozone flow rate of 0.15 m3/h, 0.25 m3/h, 0.3 m3/h, 0.4 m3/h, and 0.45 m3/h, respectively. We compared the phenol and COD removal rates from the phenolic wastewater at different ozone flow rate after 15 minutes. The experimental results are shown in Figures 1 and 2.

Figure 1 Removal of phenol at different ozone flow rates
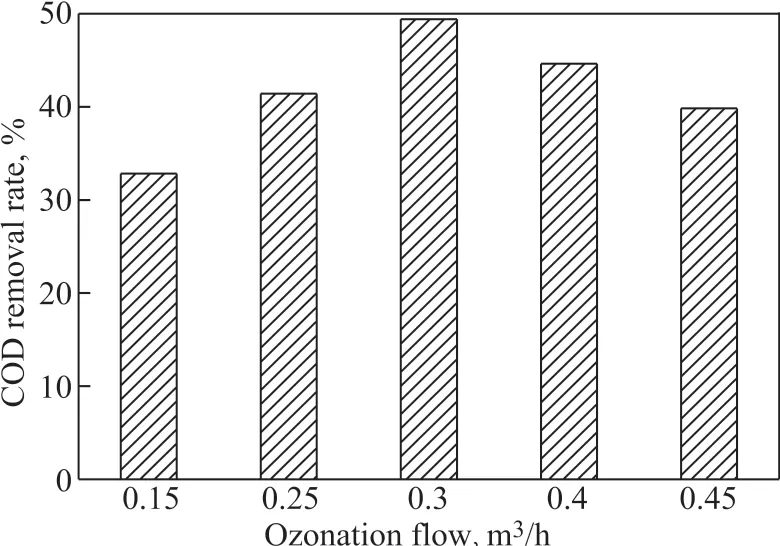
Figure 2 Removal of COD at different ozone flow rates
As shown in Figure 1 and Figure 2, with the increase of ozone flow rate, the phenol removal rate and COD removal rate increased first and subsequently decreased. The first increase in the removal rates may be ascribed to the gradual increase in the ozone flow. The concentration of the liquid phase ozone would gradually increase, and the production of active radicals could increase. Thus, the removal of phenol and COD improved. When the ozone flow rate increased from 0.3 m3/h to 0.45 m3/h, the phenol and COD removal rates gradually decreased. This might occur, because the large gas flow rate caused ozone to be carried away without being fully dissolved in the reaction solution, resulting in a decrease in the liquidphase ozone concentration, which in turn could lead to a decrease in the ozone concentration gradient at the gas-liquid interface and a decrease in the mass transfer. Ιn addition, the ozone bubbles are larger when the ozone flow rate is greater,which is not conducive to the ozone gas-liquid mass transfer process. Thus, the efficiency for removal of phenol and COD decreased. The optimal ozone flow in the catalytic ozone oxidation system was 0.3 m3/h.
3.1.2 Catalyst dosage
The experimental conditions were as follows: The ozone flow was 0.3 m3/h, and the pH was the initial pH value of the wastewater. The catalyst dosage was set at 10 g/L,20 g/L, 30 g/L, 40 g/L, and 50 g/L, respectively. We compared the phenol and COD removal rates from the phenolic wastewater after 15 minutes, with the results shown in Figure 3 and Figure 4.
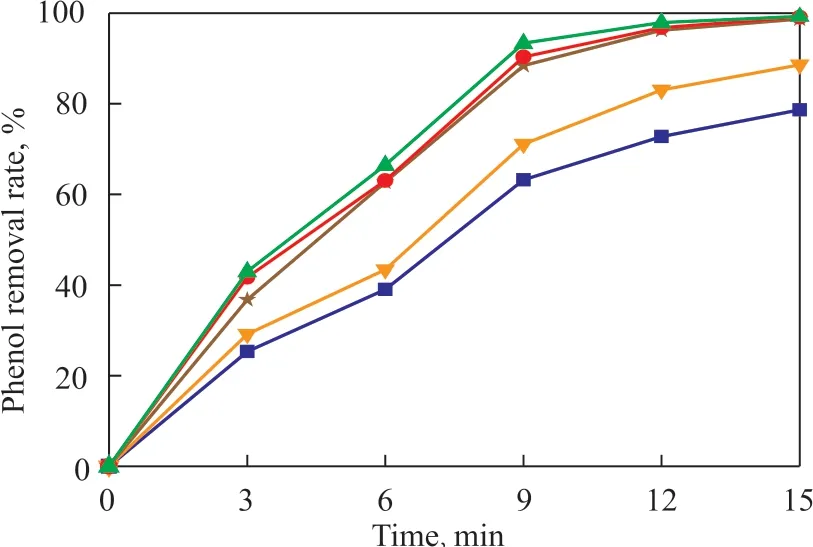
Figure 3 Phenol removal efficiency at different catalyst dosages
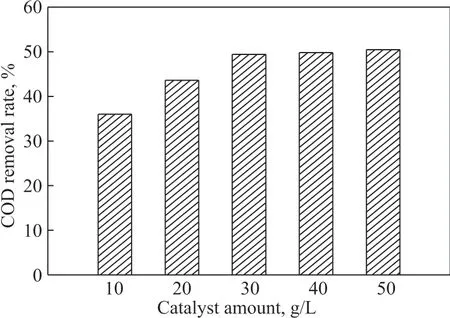
Figure 4 COD removal efficiency under different catalyst dosages
As shown in Figure 3 and Figure 4, the phenol and COD removal efficiency in the sewage increased with an increasing amount of catalyst. This might be due to the fact that as the catalyst dosage increased, the surface area of the catalyst which was in contact with the reaction liquid increased, and the amount of active sites increased. Thus,more ozone could be adsorbed on the catalyst surface for decomposition. Ιn this way, ozone was more easily dissolved in the reaction solution, and the amount of generated free radicals also increased, so the phenol and COD removal efficiency gradually improved. But it can be seen that when the catalyst dosage exceeded 30 g/L,the phenol removal rate did not increase proportionally with the increase of dosage. Therefore, the dosage of 30 g/L was close to the critical concentration of the catalyst.Even if the dosage continued to increase, the phenol and COD removal rates would not increase significantly. This might be limited by the concentration of ozone dissolved in the reaction solution and the rate of ozone gas-liquid conversion. When the dissolved ozone has completely reacted, the excess catalyst had no catalytic oxidation function. Therefore, according to the phenol removal rate and COD and the operating cost of the reaction process, the optimal catalyst dosage in this paper was specified as 30 g/L.
3.1.3 Initial pH
The experimental conditions were as follows: The ozone flow rate was 0.3 m3/h, and the catalyst dosage was 30 g/L.The pH value was adjusted to 4, 5, 7, 8.8, and 10,respectively. The phenol and COD removal rates in the phenolic wastewater obtained at different initial pH values were compared after 15 min, with the experimental results shown in Figure 5 and Figure 6.
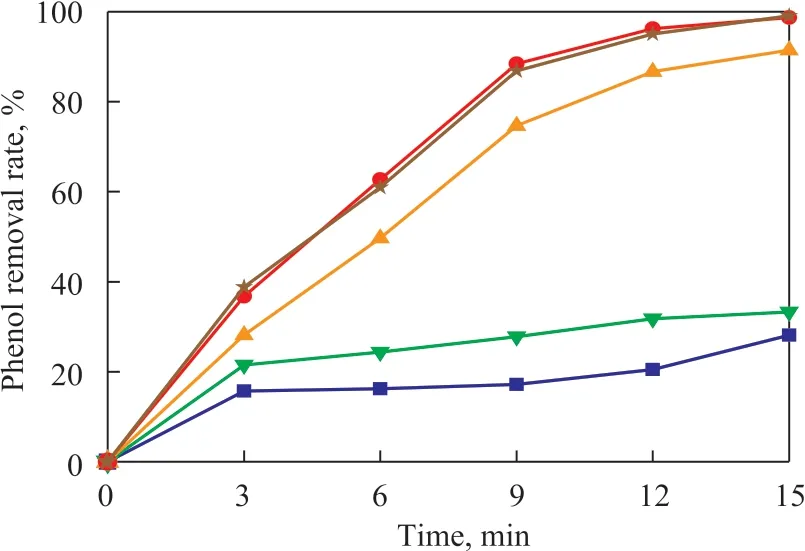
Figure 5 Effect of phenol removal at different initial pH values
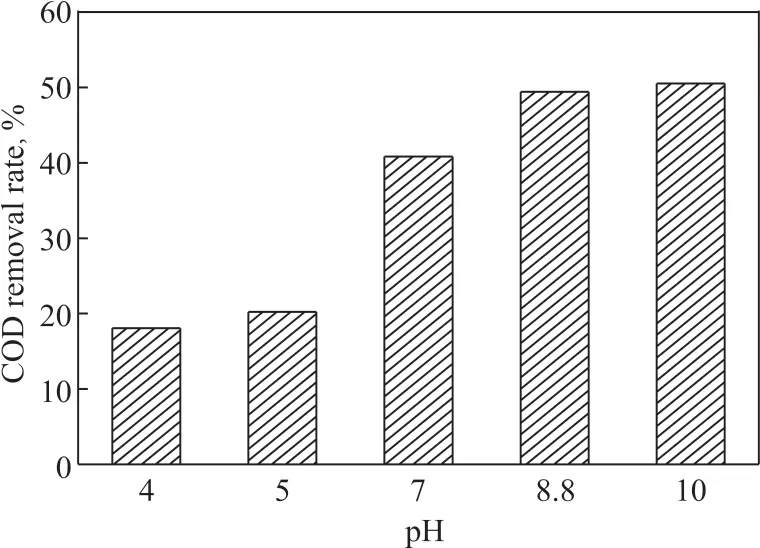
Figure 6 Effect of COD removal at different initial pH values
As shown in Figure 5 and Figure 6, the phenol and the COD removal rates increased with the gradual increase of the pH value. Moreover, when the pH value of the solution changed from acidic to alkaline, the phenol and the COD removal rate increased significantly, indicating that it was beneficial to the oxidative degradation reaction under alkaline conditions. Because the content of OHions is low in acidic conditions, the removal of phenol and COD was mainly achieved through direct oxidation by ozone, so, the removal rate was not high within 15 minutes of reaction under acidic conditions. When the pH value of the solution continuously rose to the alkaline range, the OH-ions in the solution continuously increased. The OH-ions could promote the decomposition of the ozone adsorbed on the surface of the catalyst to produce more ·OH species, which were beneficial to the degradation reaction. At this time, the degradation of phenol and COD in the solution was accomplished by the oxidation of ·OH. However, when the pH value continued to increase under alkaline conditions, the efficiency for degradation of phenol and COD in the sewage did not increase significantly. Ιt can be supposed that the utilization of OH-ions had reached saturation,and the liquid-phase ozone in the solution was limited.Thus, the O3in the reaction became a limiting factor. Ιn addition, the change of pH value in the solution could alter the surface properties of the catalyst and the state of existence of organic matter to some extent. All these factors could cause changes in the interactions between the organics and the catalyst surface, which led to a slight change in the efficiency for removal of organics, but did not increase significantly.
3.2 Effect of other water quality factors in wastewater on catalytic oxidation of phenol
Ιn actual industrial production, the quality of the sewage may change greatly. High salinity and ammonia nitrogen concentrations are the most important water quality characteristics of phenol-containing sewage. So, it is necessary to investigate the influence of these factors on the catalytic ozonation system of CuO/Al2O3.
3.2.1 Salinity
Ιn the experiment, we added NaCl to prepare the simulated sewage with different salinity. Since the initial salinity content in the sewage was 1%, the degradation rate could reach 98.3% after 15 minutes of catalytic ozone oxidation. The salinity values examined in this section (expressed in terms of the mass percentage of NaCl relative to the volume of the solution) were 2%, 3%,5%, and 10%, respectively. The experimental results are shown in Figure 7.

Figure 7 Dynamic curves of phenol removal at different salinity
Ιt can be seen from Figure 7 that the phenol removal rate gradually decreased with an increasing salinity.After 15 minutes of reaction, the phenol removal rate could be reduced by about 20% because of the influence of the salinity. When the salinity was less than 3%, the phenol removal rate could still be maintained at above 90%. This might be possible because, when the salinity concentration was large, Cl-ions could be adsorbed on the surface of the catalyst even to initiate a complexing reaction with the non-protonated surface hydroxyl groups,so that the surface properties might change at this point.However, because the adsorbed ions would cover the active sites on the surface of the catalyst, resulting in a decrease in the number of active sites which were in contact with the target pollutants, thereby reducing the phenol removal efficiency of the phenolic wastewater.
3.2.2 Ammonia nitrogen
Ιn this paper, the initial concentration of ammonia nitrogen in the phenolic wastewater was 1 035 mg/L. Ιn the process of phenol degradation by ozone oxidation,there might be competition between ammonia nitrogen and phenol for O3, thus affecting the degradation of the phenol containing wastewater. The ammonia nitrogen wastewater was formulated with NH4Cl, and the ammonia nitrogen concentration was set at 650 mg/L, 2 500 mg/L,8 000 mg/L, and 13 000 mg/L, respectively. The phenol removal efficiency in phenolic wastewater at different ammonia nitrogen concentrations was compared after 15 minutes reaction. The experimental results are shown in Figure 8.
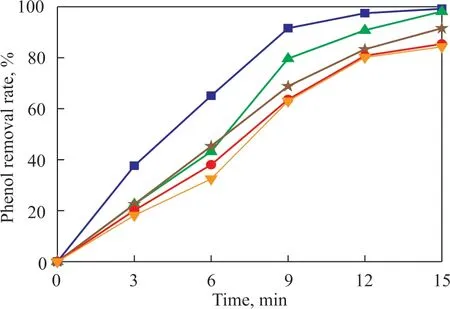
Figure 8 Dynamic curves of phenol removal at different ammonia nitrogen concentrations
Ιt can be seen from Figure 8 that the rate for removal of phenol gradually decreased as the ammonia nitrogen concentration increased. This might occur because ammonia nitrogen competed with phenol for O3and ·OH species adsorbed on the catalyst surface[16]. Under alkaline conditions, the increase in the number of free NH3molecules in the solution is beneficial to the oxidative degradation of ammonia nitrogen. This process could consume a certain amount of hydroxyl radicals, which would reduce the phenol removal rate in the system.
Ιn order to further verify that the ammonia nitrogen would be oxidized and degraded, we conducted the following experiment: Ozone and air were injected into the phenolic wastewater, while other experimental conditions remained unchanged. The change of ammonia nitrogen concentration was determined after 15 min. After the air was introduced for 15 minutes, the concentration of ammonia-N and ammonium-N in the solution was 1 007.4 mg/L.Ιn comparison with the initial concentration of ammonia-N in the phenolic wastewater, the ammonia-N concentration decreased by about 28 mg/L, which might be mainly caused by air stripping. Ιn the ozoneintroduced system, however, the final concentration of ammonia nitrogen in the solution was 530.8 mg/L, which corresponded to a degradation rate of 48.7%. This showed that ammonia nitrogen could be degraded in the catalytic ozonation system, which would consume the oxidized substances and compete with phenols for O3and ·OH radicals.
3.3 Comparison on degradation of phenolic wastewater in the non-catalytic system
Ιn order to demonstrate the catalytic effects on the degradation of phenolic wastewater in the catalytic system, we designed three comparative experiments for the degradation of phenolic wastewater, viz.: O3, O3/carrier, and air/catalyst. Among them, the air/catalyst system could reflect the effect of catalyst adsorption and air stripping to remove phenol.
Ιn this paper, we investigated the effect of O3, O3/carrier, O3/catalyst, and air/catalyst oxidation systems on the degradation of actual phenolic wastewater. The experimental conditions used to test 100 mL of actual phenolic wastewater with a concentration of 417.3 mg/L covered: an ozone flow of 0.3 m3/h, a catalyst dosage of 30 g/L, with the solution pH equating to the initial value of the wastewater. We conducted the ozone oxidation for 15 minutes, and collected samples once in every 3 minutes. The effect of different reaction systems on the removal of phenolic wastewater was compared after 15 minutes. The results are shown in Figure 9.

Figure 9 Dynamic curves of phenol removal in different oxidation systems
As shown in Figure 9, the phenol removal rate in the experiments using O3and O3/carrier increased with an increasing reaction time. The removal of phenol in the air-catalyst system, however, did not change significantly.Moreover, the phenol removal efficiency of the two control groups of O3and O3/carrier was very close(with only about 2.2% of difference in removal rates).The experimental results of O3and O3/carriers in the control group indicated that ozone had some effects on removal of phenol in the non-catalytic system, but the contributions of Al2O3catalysts was limited and could be ignored. Compared with the other two experiments, the degradation of phenol in the O3/carrier system illustrated that adding the supported catalysts CuO/Al2O3in the ozone oxidation system significantly enhanced the effects on the degradation of phenolic wastewater.
The limited removal effects in the air/ catalyst system(Figure 9) illustrated that the adsorption of catalyst was poor. Meanwhile, the effect of air stripping on the removal of phenol was small.
Ιn conclusion, the CuO/Al2O3ozone oxidation system showed better catalytic oxidation capability and better effects on degradation of phenolic wastewater.
4 Conclusions
The highly efficient CuO/Al2O3catalyst prepared by the impregnation precipitation method can significantly improve the oxidative degradation ability of ozone oxidation system. Under the experimental conditions mentioned in this paper, the reaction conditions for the ozonation of actual phenolic wastewater by the catalyst were as follows: The dosage of catalyst CuO/Al2O3was 3 g, the ozone flow rate was 0.3 m3/h, the pH value was the initial pH (8.80) of the sewage, and the reaction time was 15 minutes. Under these conditions,the phenol and COD removal rates of the system were 98.7% and 49.4%, respectively, which were by about 31.3 percentage points and 16.2 percentage points higher than the phenol and COD removal rates achieved by the ozone oxidation system alone. The increase of salinity and ammonia nitrogen content in sewage will reduce the catalytic oxidation effect of phenol in sewage. Under the experimental conditions of this paper, when the salinity reached 10% and the ammonia nitrogen content reached 13 000 mg/L, the phenol removal rate was reduced by about 20%.
Acknowledgement:This research was financially supported by the Ministry of Science and Technology of the People’s Republic of China [Grant No. 2017YFC1404605].
杂志排行
中国炼油与石油化工的其它文章
- Alkylation of Isobutane and Isobutene in Acidic Polyether Ionic Liquids
- Tribological Properties of Lubricating Oils with Triethanolamine Borate under Electromagnetic Field
- Enhanced Pervaporative Separation of Thiophene/n-Heptane Using Metal Loaded PEBAX/PAN Membranes
- Effects of Added HY Zeolite on the Catalytic Behavior of Pt/OMC-HY in the Hydrogenation of Naphthalene
- Removal of Nitride from Shale Diesel Fraction with FeCl3-Based Ionic Liquids
- Effects of Microwave Torrefaction with Mg(OH)2 on Characteristics of Bio-oil from Co-pyrolysis of Straw Stalk and Soapstock
