Hypersonic flutter and flutter suppression system of a wind tunnel model
2019-10-26ChunweiXUANJinglongHANBingZHANGHiweiYUNXiomoCHEN
Chunwei XUAN, Jinglong HAN,*, Bing ZHANG, Hiwei YUN,Xiomo CHEN
a State Key Laboratory of Mechanics and Control of Mechanical Structures, Nanjing University of Aeronautics and Astronautics, Nanjing 210016, China
b College of Mechanical Engineering, Hefei University of Technology, Hefei 230009, China
KEYWORDS Aeroelastic;Flutter suppression;Hypersonic flutter;Limit Cycle Oscillation(LCO);Wind tunnel
Abstract The aeroelastic behavior of a thin flat rudder model was numerically simulated and experimentally investigated in a hypersonic wind tunnel. In particular, a flutter suppression system taking advantage of collision within small gaps was proposed and a novel system for the flutter simulation of the whole nonlinear aeroelastic system including the flutter suppression system was developed.First,the critical flutter dynamic pressure of the rudder without the flutter suppression system was calculated with different methods. Then, the whole nonlinear aeroelastic system,including the flutter suppression system,was simulated to design the gap size.Finally,the flutter suppression system was experimentally validated in a hypersonic wind tunnel operating at Mach number 5. The typical phenomenon of Limit Cycle Oscillation(LCO)was observed,avoiding the structural failure of the model and the consistency between numerical and experimental results was demonstrated.The proposed suppression system can improve the design and reusability of test models of hypersonic flutter experiments.
1. Introduction
Hypersonic flows are characterized by the existence of complex flow phenomena,1which complicate the research on hypersonic flutter. Therefore, a systematic approach that combines theoretical, numerical, and experimental investigations is usually adopted. The ground wind tunnel flutter test is a typical experimental procedure for aeroelastic investigations in which the effects of aerodynamic heating are excluded.Nevertheless,the impact that the wind may have on the model when the wind tunnel initiates or shuts down must be taken into account during the stage of model design.Furthermore, the current security technology of hypersonic wind tunnel flutter is still not mature enough. Thus, a more improved design is required for hypersonic flutter tests in wind tunnels.
Since the 1950s, NASA and other research institutions,such as the US Air Force Research Laboratory,have launched experimental investigations on high-speed aircraft flutter in wind tunnels and have made great contributions to later hypersonic wind tunnel tests and aircraft designs.2,3Most studies focus on the flutter characteristics of different airfoil shapes,4control surfaces,5and wing platforms.6However, few have performed wind tunnel experiments of hypersonic flutter recently. The researchers of the China Aerospace Aerodynamic Research Institute conducted a wind tunnel flutter test on a 0.47 mm-thick steel plate wing fixed at the root at Mach number 5 and 6.7They found that excessive lateral deflection of the plate wing occurred under high dynamic pressure and that flutter oscillations were difficult to be observed in the wind tunnel.
Generally, hypersonic wind tunnels are intermittent, and this feature produces great impact loads on the test model when the wind tunnel starts or shuts down, possibly leading to structural failure of the model. Once destroyed, debris of the model may cause damage to the wind tunnel facilities and lead to an increase in experiment costs. To overcome these issues, specific safety countermeasures or flutter suppression strategies have to be adopted during the experiment.
Usually, program-controlled or manual emergency shutdown is used to protect the test model.8-10However, emergency stop or rapidly reduced pressure can still stress the test model due to the presence of the impact load caused by the start or shutdown of the hypersonic wind tunnel.To overcome this issue, Yan et al.11developed a supersonic flutter delivery system, whereas Ji et al.7used a protective cover. Both solutions require programed or manual control. Therefore, the operator may not be able to act on time due to the high frequency of hypersonic flutter, and thus the test model may not be effectively protected.
Methods for actively controlling or passively suppressing flutter have been widely studied to increase the flutter speed,which can indirectly protect the test model from structural failure. Song12and Almeida13et al. have proposed an active control strategy of the aeroelastic flutter of curved panels by using piezoceramics. Wang et al.14studied the active flutter control of subsonic and supersonic panels by using the eigenvector orientation method. Song et al.15-19studied the active flutter control of different structures by using different control methods. Compared with active flutter control, passive flutter suppression may be a more desirable strategy,especially if it is thoroughly investigated and properly designed and implemented.20Zhao and Cao21investigated the influence of the stiffness of laminated composite panels in the supersonic flow by applying stiffeners on the surface of the plate. Cunhafilho et al.22studied the flutter suppression of plates using passive constrained viscoelastic layers. Sohn23and Ganapathi24et al.investigated the supersonic flutter characteristics of functionally graded panels under thermal and aerodynamic loads.Given its ability to absorb energy from the structure over a broad frequency range, Nonlinear Energy Sink (NES) has been widely used to suppress oscillations25-28. Hubbard et al.29-30demonstrated that the NES can improve the stability boundary by up to 40% in the transonic regime of the tested wing section. However, NES has its own adverse impacts and challenges. It may actually increase the vibration amplitude of a linear subsystem over specific frequency ranges.31
In this work, a thin flat rudder model is designed and used as the wind tunnel model.A passive flutter suppression system taking advantage of gaps is proposed to protect the wind tunnel model.First,the wind tunnel model and its flutter suppression system are introduced. Second, the critical dynamic pressure of flutter of the rudder is calculated using different methods. Then, the nonlinear aeroelastic system, including the flutter suppression system, is numerically simulated, and its relevant parameter is determined. Finally, a hypersonic wind tunnel flutter experiment is conducted on this rudder,through which the effectiveness of the flutter suppression system is verified.
2. Wind tunnel model and flutter suppression system
The wind tunnel model designed in this work is a rudder model made of aluminum alloy,which has a right trapezoid platform as shown in Fig. 1.
The flutter suppression system shown in Fig. 2 is designed to limit the vibration amplitudes of the rudder, thus protecting the test model from flutter failure. The system is mainly composed of two short rods, four movable blocks, and two bases. As shown in Fig. 1, the rods are located on the root side of the rudder at a fixed distance on both sides of the rudder shaft. The blocks are fixed apart with bolts in the slot of each base, as shown in Fig. 2(a). The bases are mounted on the model support mechanism. As shown in Fig. 2(b), each rod hangs between two blocks, and the gap between them can be changed by adjusting the positions of the blocks inside each slot. The rods will collide with the blocks when the model reaches a certain amplitude, leading to a sharp increase of the dynamic stiffness of the whole system. Given the existence of the gap, the whole aeroelastic system in Fig. 3 becomes nonlinear. The gap between each rod and two blocks is the key parameter of the flutter suppression system, and it has to be properly designed in advance. Indeed,with a large gap, the model is prone to flutter failure due to the weak limit of the amplitude. Conversely, if the gap is too small, the model may be overly constrained, which will lead to a considerably smaller amplitude and consequently make the direct observation of flutter in the wind tunnel more difficult.
3. Numerical simulation
The critical flutter dynamic pressure of the rudder model is calculated with the method of Computational Fluid Dynamics/Computational Solid Dynamics (CFD/CSD) coupling and the commercial software ZAERO. Different aerodynamic models, including Euler equations, Navier-Stokes equations,and ZONA7, are used. Modal superposition is utilized to acquire the structural dynamic responses when using Euler or Navier-Stokes equations to evaluate the critical flutter dynamic pressure. Furthermore, Navier-Stokes equations and the commercial software ANSYS are combined together to simulate the whole nonlinear system, including the flutter suppression system.

Fig. 1 Size of wind tunnel model.
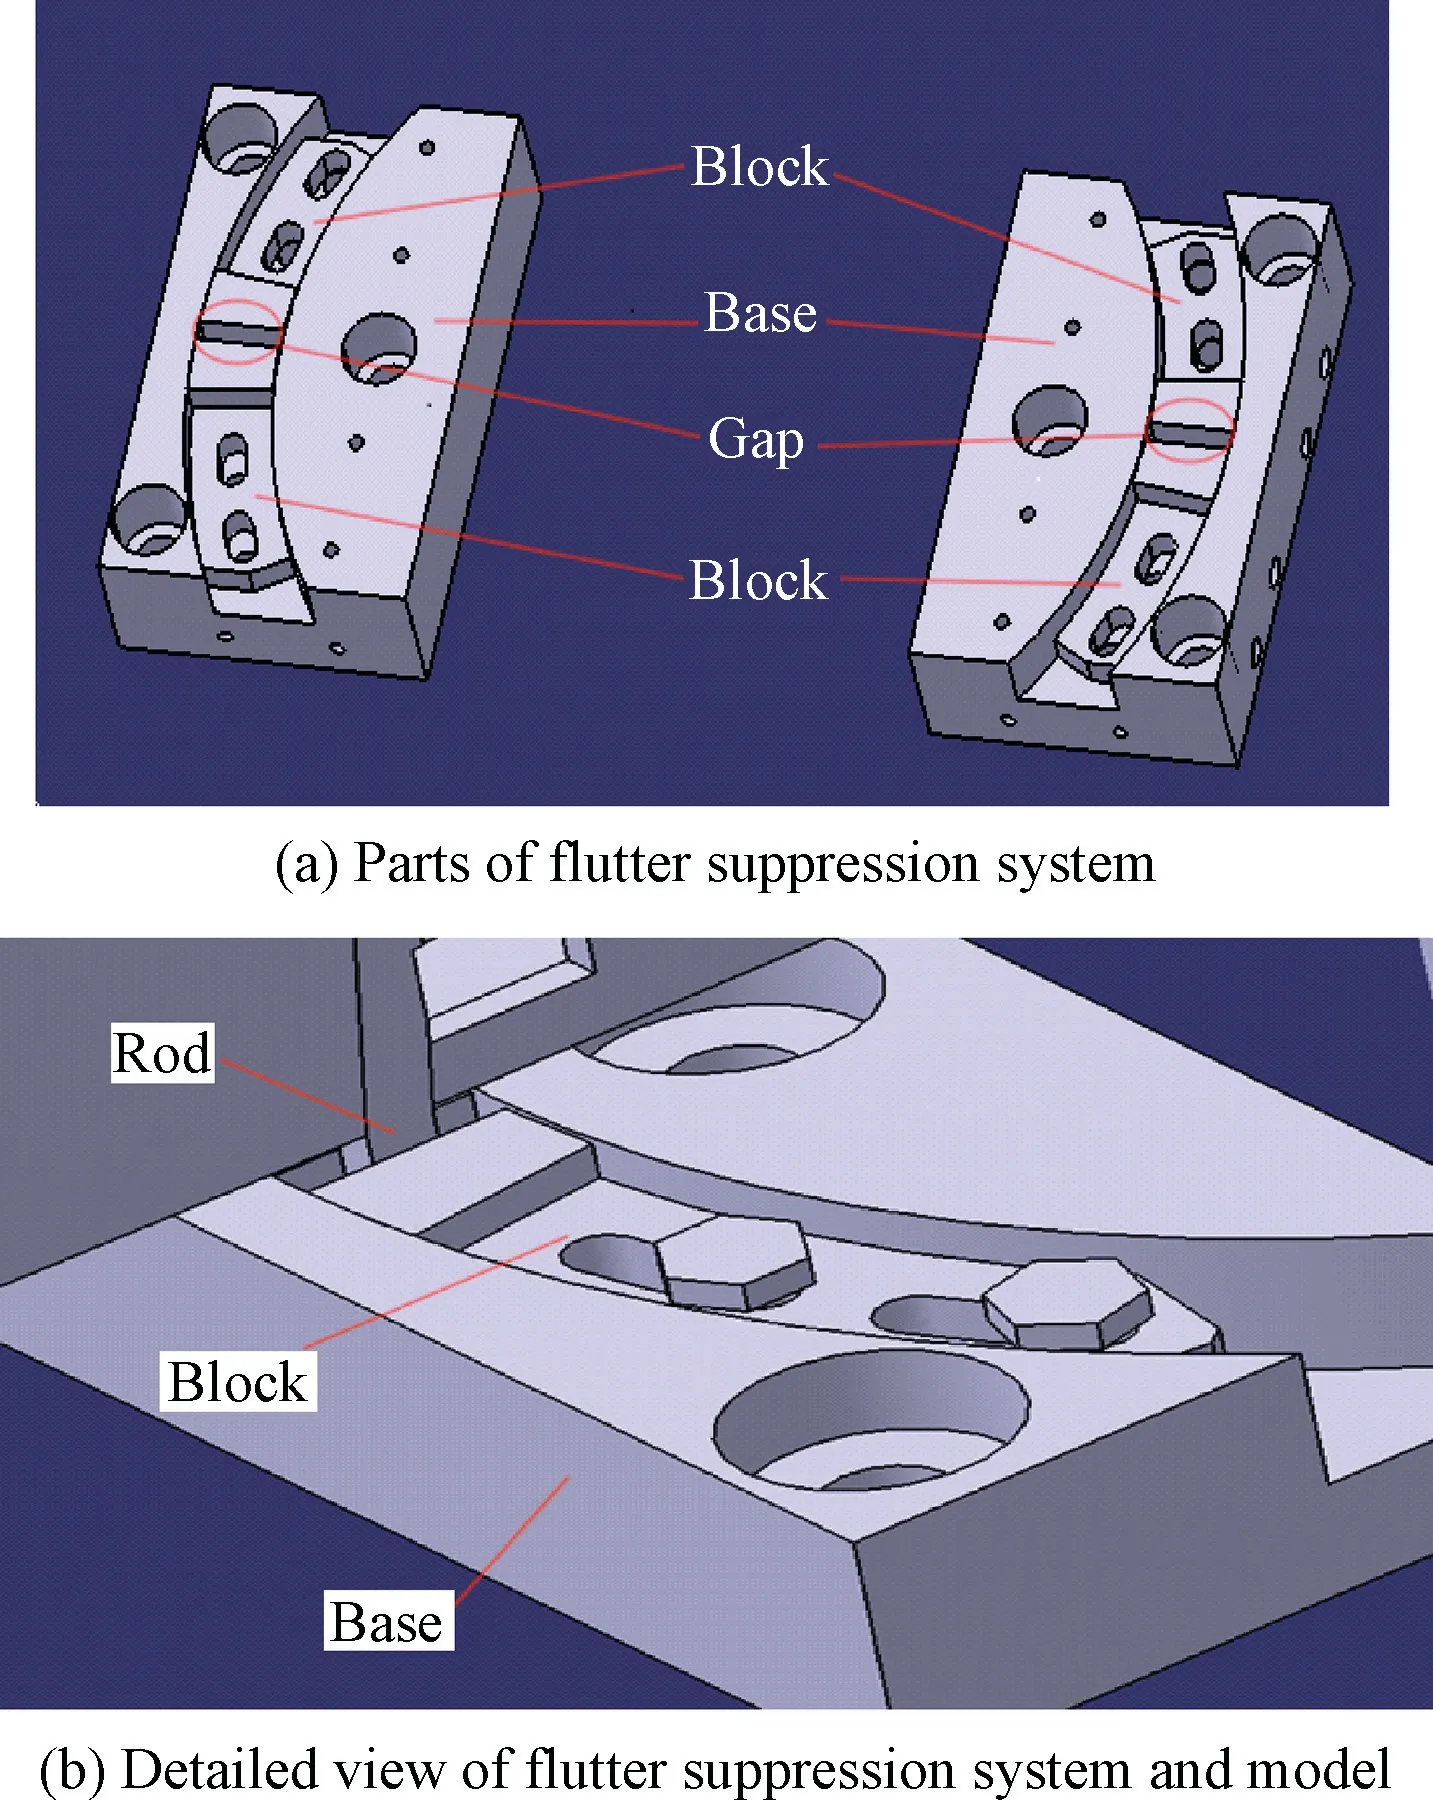
Fig. 2 Flutter suppression system.

Fig. 3 Wind tunnel model and flutter suppression system.
3.1. Flutter calculation of rudder model
3.1.1. Numerical model
For the case of Euler flow, the structured CFD mesh is depicted in Fig. 4, and the height of the first boundary layer is 1 mm. As a comparison, the first boundary layer height is 0.01 mm for the case of Navier-Stokes equations ensuring that Y+is equivalent to 1.The total number of cells is 630000 and 2360000 for the case of Euler and Navier-Stokes flows,respectively. For both cases, the Roe scheme is adopted to evaluate convective fluxes, based on which spatial discretization is second-order accurate after linear reconstruction. Viscous fluxes are discretized in cell-centered scheme with secondorder accuracy. Temporal discretization is performed with the LUSGS method.The two-equation Shear Stress Transport(SST) turbulence model is used to solve the Navier-Stokes equations.
The finite element model of the rudder is built using ANSYS with which natural modes are obtained. As shown in Fig. 5, this model comprises 1168 quadrilateral shells and 1244 nodes. The material used here is aluminum alloy.
When calculating the critical flutter dynamic pressure with ZAERO, the linear aerodynamic model ZONA7 is used.
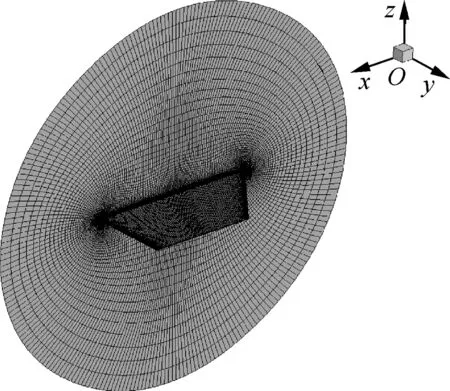
Fig. 4 Structured wing mesh (far-field boundary mesh hidden).

Fig. 5 Finite element model.
3.1.2. Method of CFD/CSD coupling
The hypersonic aeroelasticity of the rudder is first simulated in time domain with CFD/CSD coupling and then in frequency domain with ZAERO.Since the domain of fluid and structure are evaluated separately, the interpolation method of infinite plate spline is used.The whole calculation process is illustrated in Fig.6,where NIterstands for the times of iterations between fluid and structure domain.It is a loose coupling method when NIterequals 1 and is tightly coupled when NIteris larger than 1.In this study, NIteris 3.
3.1.3. Results
Results of these three cases are listed in Table 1, which show that all three calculated flutter results are close to each other.
3.2. Simulation of whole nonlinear system

Fig. 6 CFD/CSD coupling process.

Table 1 Results of different cases.
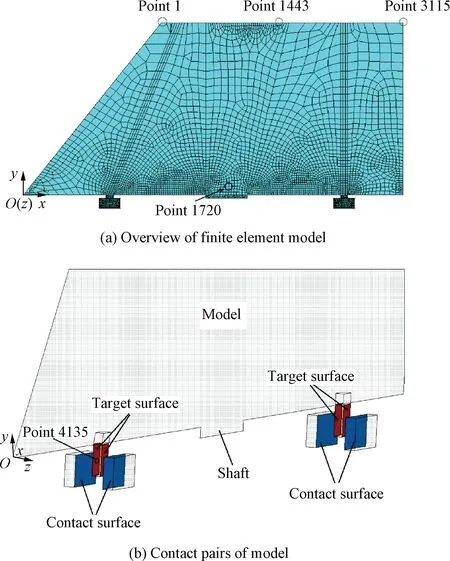
Fig. 7 Test model including flutter suppression system.
The nonlinear aeroelastic system,including the flutter suppression system, is simulated using the CFD/CSD coupling method illustrated in Fig. 6. Unsteady aerodynamic forces are obtained by solving the Euler equations,and the structural dynamic response is attained using ANSYS.The finite element model is shown in Fig. 7(a). Contact pairs (CONTA174/TARGE170) are built on two faces of each rod and one face of each block to simulate the collision between them.As shown in Fig. 7(b), red surfaces of rods are target surfaces and blue surfaces of blocks are contact surfaces.Each contact pair comprises one target surface and one contact surface, which are built with contact elements CONTA174 and target elements TARGE170 respectively. These contact pairs actually provide limiting conditions for the rods.
The normal displacement responses of three points located at the front, middle, and end of the rudder tip are monitored.Fig.8 shows the displacement responses of the rudder without the flutter suppression system, when the freestream dynamic pressure is 31 kPa,which is the critical flutter dynamic pressure of the rudder, as listed in Table 1. 1_UZ, 1443_UZ, and 3115_UZ stand for the normal displacement responses of the three monitor points mentioned above. The displacement response of the rudder diverges gradually after a short period of convergence, indicating that the rudder is already in the state of flutter.

Fig.8 Displacement response of rudder without flutter suppression system.
Fig.9 shows the displacement responses of the rudder with flutter suppression system, when the freestream dynamic pressure is 31 kPa and the gap size is 5 mm.Fig.9(a)illustrates the displacement responses of three monitors mentioned ahead.Although the displacements increase at the beginning, the slope of the envelope decreases gradually, and the divergence decelerates. Eventually, the displacements stop growing, and the rudder ends up oscillating within a certain amplitude.The displacement response of the rod is shown in Fig. 9(b)and 4135_UZ stands for the normal displacement of the center(shown in Fig. 7(b)) of one face of a rod. The displacement of the rod keeps growing until 5 mm after approximately 0.15 s.This is because the gap between each rod and the blocks has been set to 5 mm. The rod collides with the blocks when the amplitude of the rod reaches 5 mm, and thus the rudder's vibration is deterred from aggravating, which in the end protects the model from structural failure. Fig. 9(c) shows the result of Fast Fourier Transformation (FFT) analysis of the normal displacement responses of the rudder. The rudder is vibrating with one frequency, which combined with the situation described in Fig. 9(a) indicates that the whole nonlinear aeroelastic system is already in the state of Limit Cycle Oscillation (LCO).
Based on the comparison between Figs.8 and 9,the flutter suppression system leads the rudder into the state of LCO,showing that the flutter suppression system is an effective solution to avoid the structural failure.
The gap between each rod and the blocks is the key parameter of the flutter suppression system, and the final effectiveness of suppression depends on it. Fig. 10 shows the rudder's displacement responses with the gap of 2, 4, and 5 mm, and their freestream dynamic pressures are all 31 kPa. The wider the gap is,the larger the vibration amplitudes become.A large amplitude leads to more critical stress and strain distribution of the model, which increases the risk of flutter failure. However, a small gap may overly limit the vibration of the model,making the direct observation of the flutter in the wind tunnel more difficult.Therefore,a proper gap size is needed for better performance of the suppression system. Based on the simulations of the whole system with different gaps, the maximum gap size is 4 mm, considering the yield stress of aluminum alloy.
Fig. 11 shows the displacement responses of the rudder when the freestream dynamic pressure is 33 kPa, and the gap is 2 mm. Similar to the case of 31 kPa, the displacement of the rudder grows considerably slower,compared with the case without flutter suppression system. This finding indicates that the flutter suppression system is still effective even when the freestream dynamic pressure exceeds the critical flutter dynamic pressure of the rudder.

Fig.9 Displacement responses of rudder with flutter suppression system.
4. Wind tunnel experiment
4.1. Wind tunnel description

Fig. 10 Rudder displacement responses with different gaps.
This experiment is conducted in the ∅m hypersonic wind tunnel of China Aerodynamics Research and Development Center. This wind tunnel covers Mach number 3 to 8 and altitude from 20 km to 60 km. Its maximum freestream dynamic pressure is 80 kPa at Mach number 5,which is the operating Mach number of this experiment. The freestream temperature is 73 K, and the angle of attack is zero.
4.2. Model setup
The rudder is attached to a fairing through a shaft in the middle of the root of the rudder, while the fairing is installed on a heavy base, the height of which is precisely designed to make the test model properly located in the test section. In particular, the gap size of the suppression system is set to be 2 mm.The final setup of the model is shown in Fig. 12.
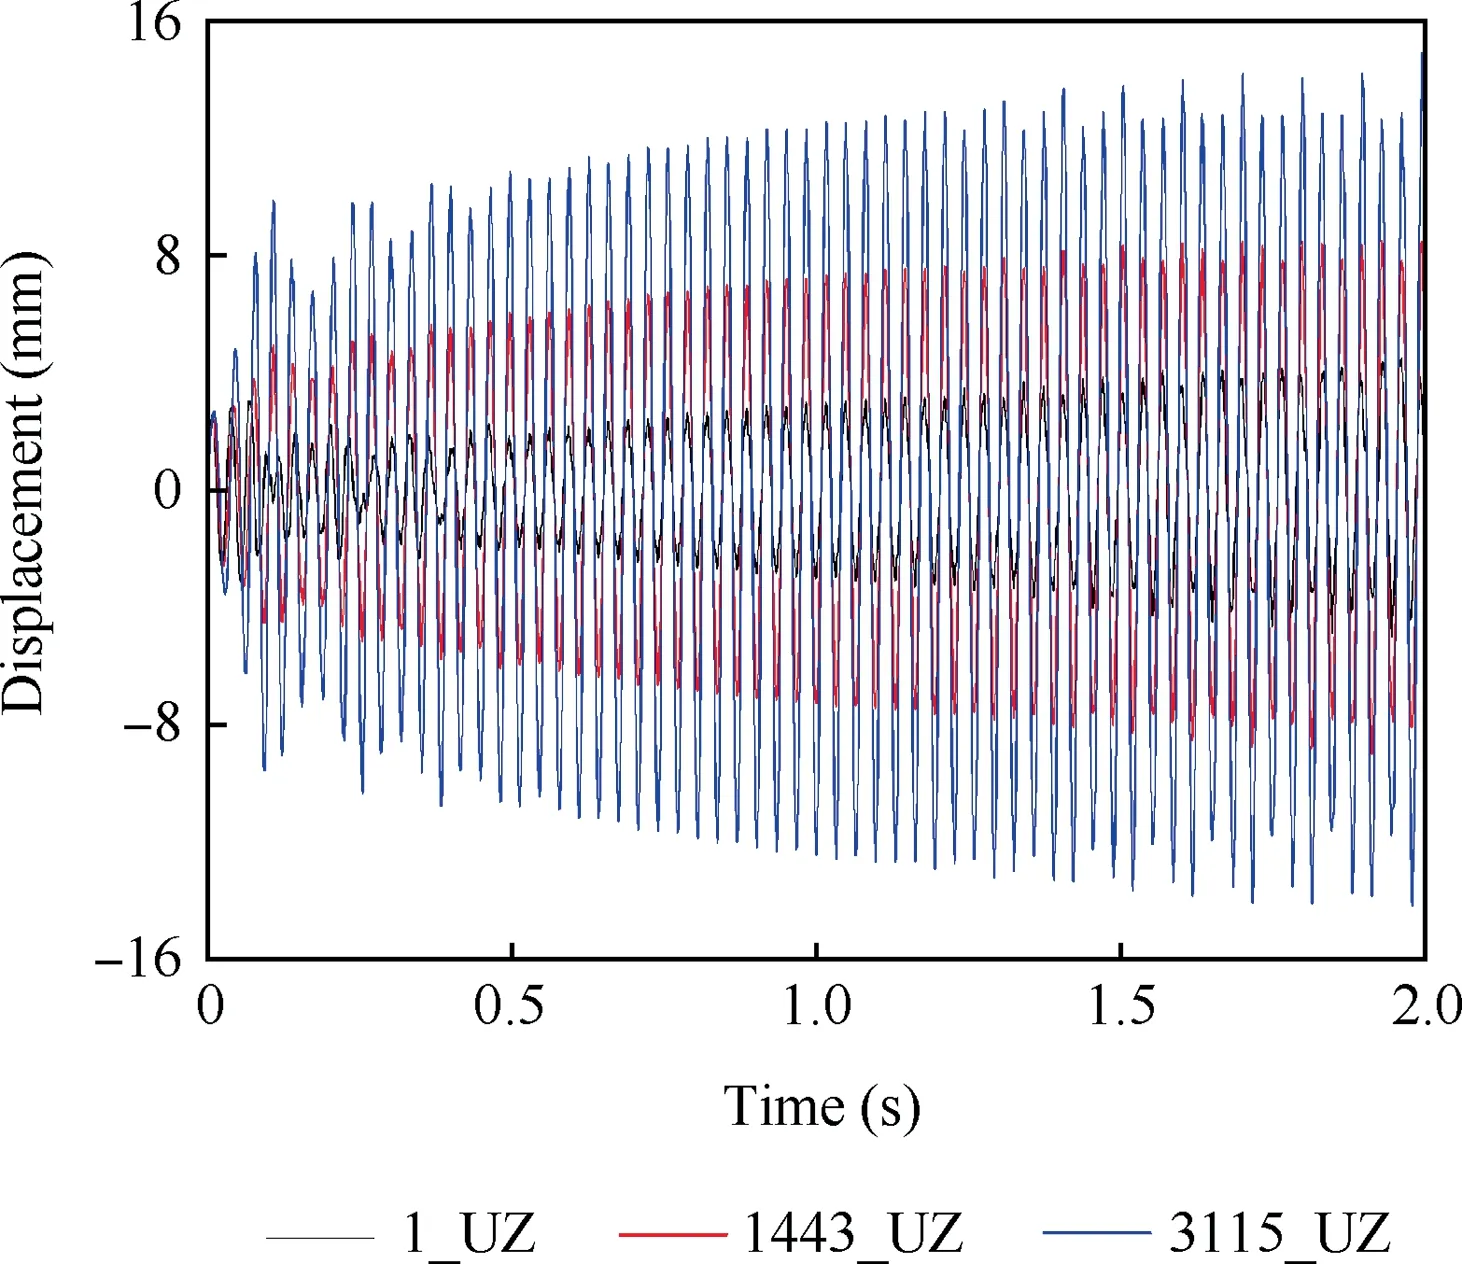
Fig.11 Displacement response of rudder with higher freestream dynamic pressure.
Wind-off vibration tests are conducted after each wind tunnel test for the validation of the model integrity.Table 2 shows the comparison between the first five experimental and numerical frequencies of the model. Since numerical shapes are almost identical to experimental shapes, only experimental ones are presented in the table.
4.3. Results and discussion
The whole experiment is divided into two phases,which are the continuous adjustment of freestream dynamic pressure and the stepwise adjustment of freestream dynamic pressure.Given the existence of the flutter suppression system, a typical phenomenon of LCO is observed and the flutter failure is avoided,which is shown in Fig. 13.
4.3.1. Continuous adjustment of freestream dynamic pressure
The range of the dynamic pressure is set from 20 kPa to 30 kPa, given that the calculated critical dynamic pressure of flutter is 29 kPa. This process of adjustment lasts 35 s, and the freestream dynamic pressure increases with a suitable slope.Fig.14 shows the history of vibration signals of the rudder model.These two vibration signals are bending and torsion signals from the strain gauges planted in the region,where the shaft connects to the rudder. Power spectra of these vibration signals under different freestream dynamic pressures at different time spans are shown from Figs. 15-17. Multiple frequencies are found in Figs.15 and 16.However,Fig.17 shows that the rudder is vibrating with only one frequency,indicating that the rudder has reached the state of LCO after 34 s. Finally, a preliminary flutter dynamic pressure of 29.5 kPa and the range of flutter dynamic pressure from 28 kPa to 30 kPa can be determined from these four figures.

Fig. 12 Model setup.
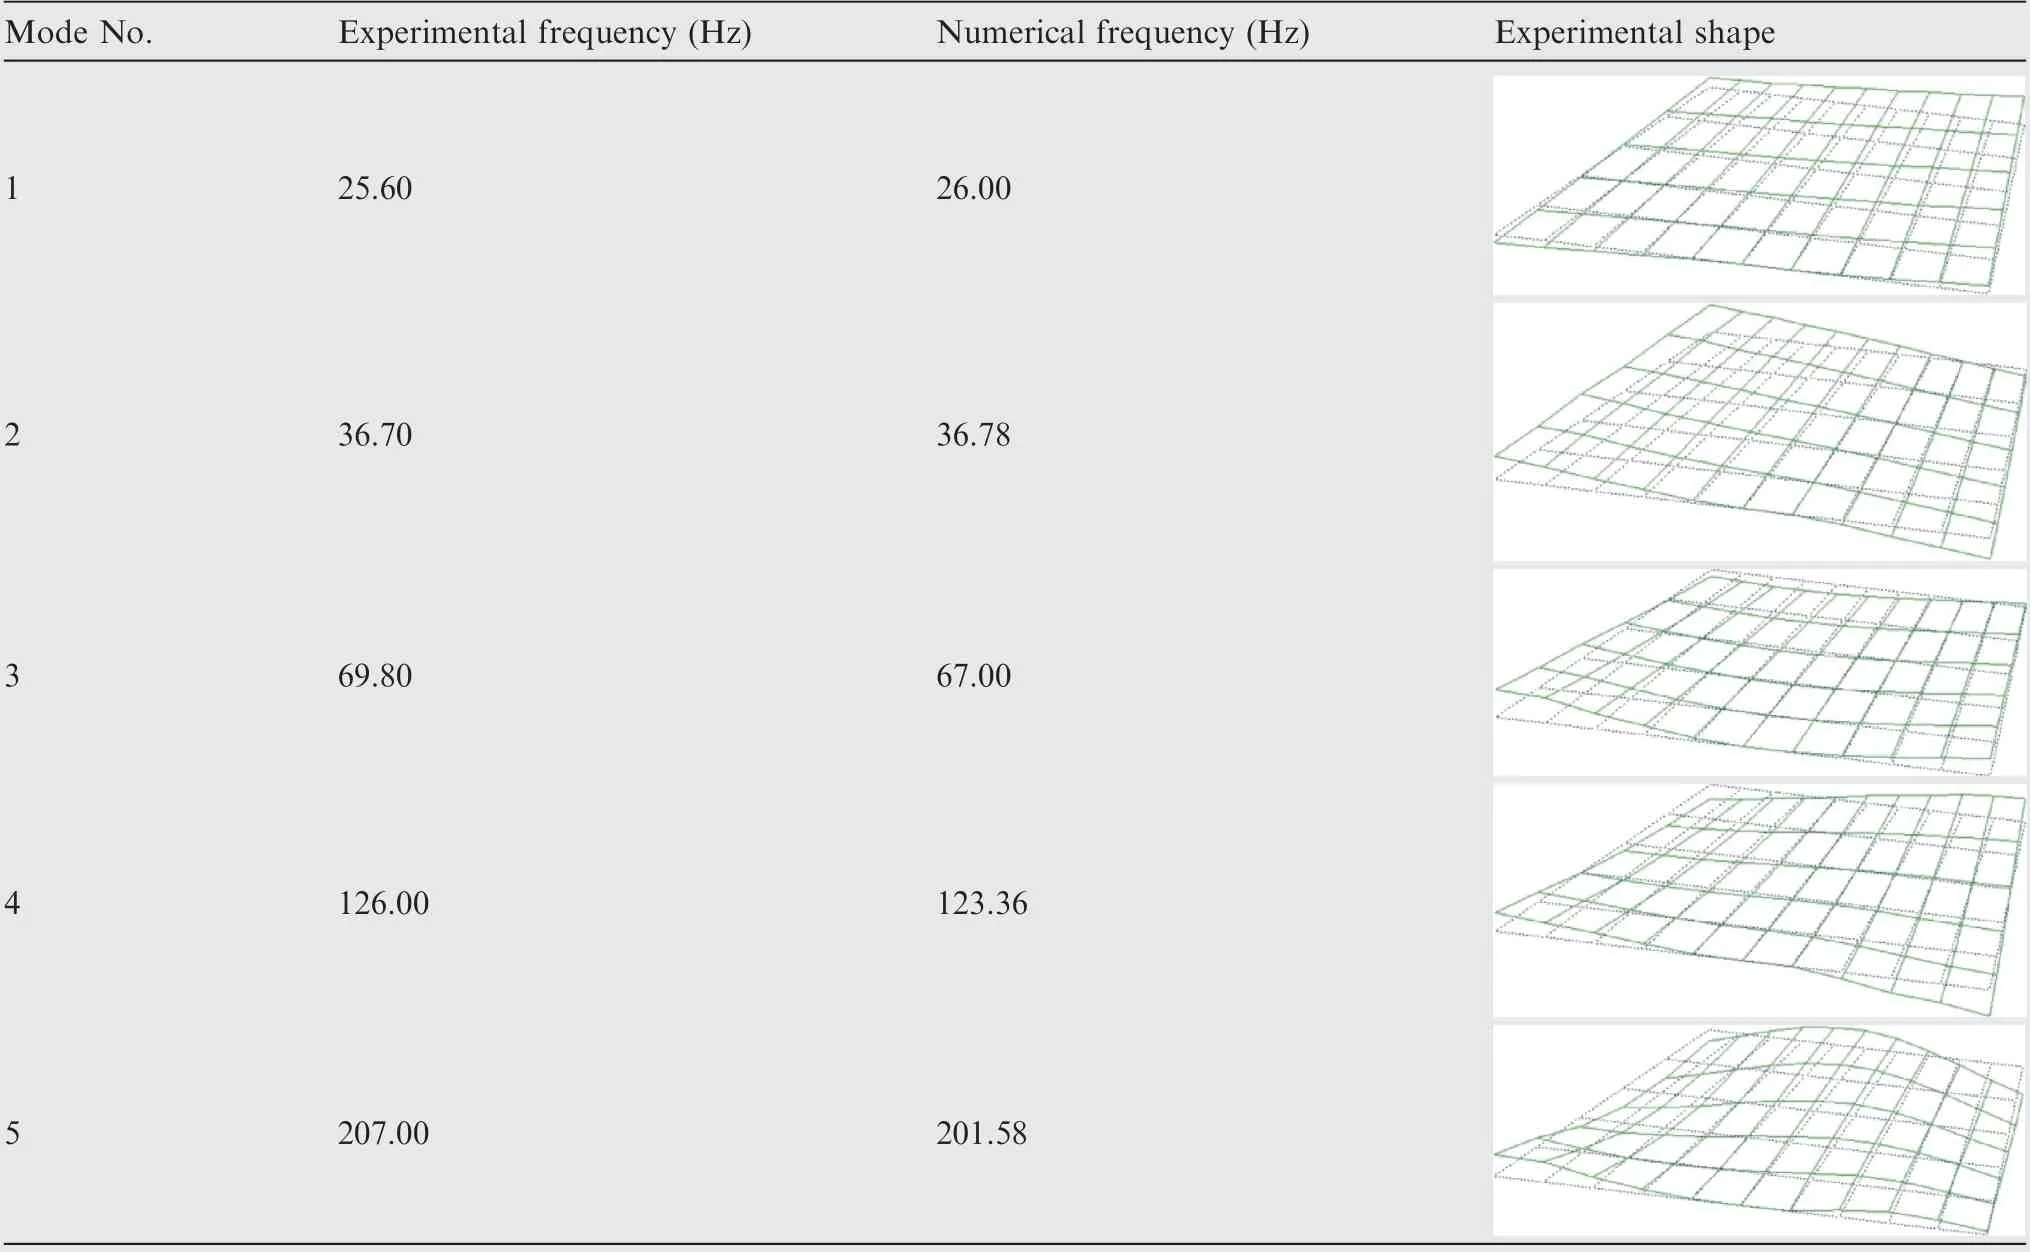
Table 2 The first five experimental and numerical frequencies.

Fig. 13 State of model in wind tunnel.
4.3.2. Stepwise adjustment of freestream dynamic pressure
As stated in the previous procedure, an approximate range of flutter dynamic pressure has been determined. However, an additional procedure of the stepwise adjustment of freestream dynamic pressure is necessary to finally determine the exact value of the flutter dynamic pressure. Fig. 18 depicts the history of the rudder's vibration signals of three freestream dynamic pressure stages of each test. It shows that the rudder vibrates violently at each stage, and the amplitude rises with the increase in freestream dynamic pressure.
Fig.19 shows the time-frequency(Short Time Fourier Transform)analysis of the model's bending strain.It can be seen from this figure that the single-frequency characteristic of the model becomes clear from sometime between 25 s and 30 s. More specifically,the power spectrum analysis of the bending and torsional response of the model is shown in Fig.20 and Fig.21 for time from 30 s to 34 s and time from 34 s to 38 s, respectively.Although it seems like a single-frequency characteristic of the bending strain in Fig. 20(a), it shows clearly in Fig. 20(b) that there are actually multiple frequencies in the torsion strain response.It can be seen from Fig.21 that the model shows the single-frequency characteristic from 34 s. Therefore, Figs. 19-21 show that the model flutters after 34 s with the flutter dynamic pressure of 29.1 kPa shown in Fig. 18 and the flutter frequency being 29.3 Hz.

Fig. 14 History of vibration signals during continuous adjustment of freestream pressure.

Fig. 15 Power spectrum from 22 s to 28 s.
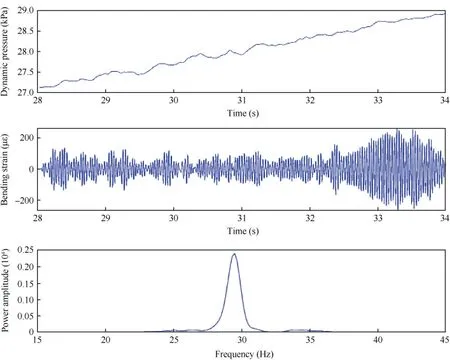
Fig. 16 Power spectrum from 28 s to 34 s.
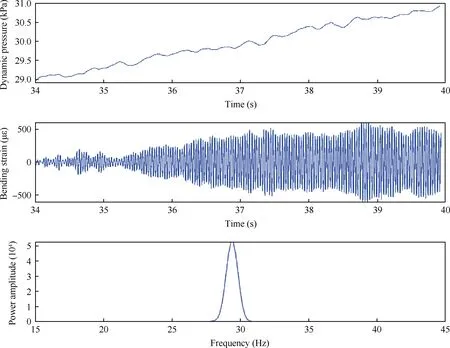
Fig. 17 Power spectrum from 34 s to 40 s.

Fig. 18 History of vibration signals during staged adjustment of freestream pressure.

Fig. 19 Short time Fourier transform spectrum.

Fig. 20 Power spectrum from 30 s to 34 s.
Theoretical and experimental results are listed in Table 3,and they are in good accordance with each other.Considering the air viscosity,the result of Navier-Stokes equations is more accurate than the results obtained by Euler equations.Furthermore, for this test model, the linear aerodynamic theory can already provide enough accuracy for engineering applications in terms of hypersonic flow in a wind tunnel.

Fig. 21 Power spectrum from 34 s to 38 s.

Table 3 Comparison of theoretical and experimental results.
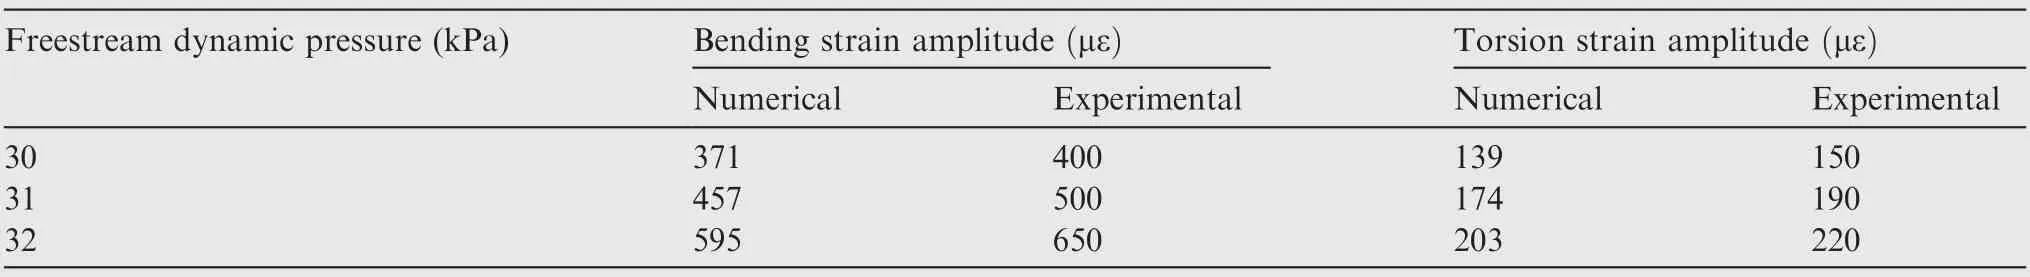
Table 4 Comparison of numerical and experimental strain amplitudes.
Fig. 22 shows the bending and torsion strain response of point 1720, which is depicted in Fig. 7 and matches the location of the strain gauge mentioned before. For brevity, only strain response histories corresponding to the freestream dynamic pressure of 31 kPa (gap size is 2 mm) are provided here, but numerical and experimental strain amplitudes under different freestream dynamic pressures are listed in Table 4.Due to the fluctuation of the freestream dynamic pressure in the wind tunnel, the strain amplitude changes over time. An average experimental bending strain amplitude of 500 με can be told from Table 4, which is slightly higher than the numerical result of 450 με presented in Fig. 22(a). Compared to numerical simulations, extra impact may be produced on the test model in the wind tunnel due to the nature of fluctuation of the freestream, as a result of which, errors between those two kinds of results are well explained.
5. Conclusions
A thin flat rudder model was designed and used as the wind tunnel model. Then, its aeroelastic behavior was numerically simulated and experimentally investigated in a hypersonic wind tunnel.The critical dynamic pressure of flutter was calculated for the test model by using three different aerodynamic theories, and all numerical results were found to be close to the experimental result. The linear aerodynamic theory can already provide enough accuracy for engineering applications under the condition of hypersonic flow in a wind tunnel.
To avoid flutter failure of the hypersonic wind tunnel model, a flutter suppression system was designed. For the design of the gap size, a novel system for the simulation of the whole nonlinear aeroelastic system including the flutter suppression system was developed.The correctness of the simulation system was proved by comparison with experimental results. When the freestream dynamic pressure reached the critical flutter dynamic pressure of the rudder, the whole nonlinear system performed LCO instead of achieving the structural failure, proving the effectiveness of the flutter suppression system proposed in this work. Moreover, the larger the gap between each rod and the blocks is, the more deformed the rudder becomes. Therefore, the size of the gap in the flutter suppression system is the key element to be designed to avoid excessively large vibration amplitudes or structural failure.It is believed that the flutter suppression system proposed in the work can provide a reference for the design of flutter tests in hypersonic wind tunnels.
Acknowledgements
This study was co-supported by the Priority Academic Program Development of Jiangsu Higher Education Institutions(PAPD) and the National Natural Science Foundation of China (No. 11472133).
杂志排行

CHINESE JOURNAL OF AERONAUTICS的其它文章
- Heading control strategy assessment for coaxial compound helicopters
- An adaptive integration surface for predicting transonic rotor noise in hovering and forward flights
- An algorithm to separate wind tunnel background noise from turbulent boundary layer excitation
- Simulation of mass and heat transfer in liquid hydrogen tanks during pressurizing
- Leakage performance of floating ring seal in cold/hot state for aero-engine
- Six sigma robust design optimization for thermal protection system of hypersonic vehicles based on successive response surface method