Simulation of mass and heat transfer in liquid hydrogen tanks during pressurizing
2019-10-26JiachaoLIGuozhuLIANG
Jiachao LI, Guozhu LIANG
School of Astronautics, Beihang University, Beijing 100083, China
KEYWORDS CFD;Condensation;Cryogenics;Evaporation;Phase change;Pressurization
Abstract In order to accurately predict the heat and mass transfer behaviors and analyze key factors affecting pressurization process in the hydrogen tank, a comprehensive 2D axial symmetry Volume-Of-Fluid (VOF) model is established by Computational Fluid Dynamics (CFD) method.The effects of phase change,turbulence and mass diffusion are included in the model and relationships between physical properties and temperature are also comprehensively considered.The phase change model is based on Hertz-Knudsen equation and the mass transfer time relaxation factor is determined by the NASA's experimental data. The mass diffusion model is included in gaseous helium pressurizing. The key factors including the inlet temperature, inlet mass flow rate, injector types and pressurizing gas kinds are quantitatively analyzed. Compared with the experiment, the simulation results show that the deviation of pressurizing gas mass consumption, condensing mass and ullage temperature are 3.0%, 7.5% and 4.0% respectively. The temperature stratification is existed along the axial direction in the surface liquid region and the ullage region,and the bulk liquid is in subcooled state during pressurizing.The location of phase change mainly appears near the vapor-liquid interface, and the mass transfer expressing as condensation or vaporization is mainly determined by the heat convection and molecular concentration near the vapor-liquid interface.The key factors show that increasing the inlet temperature and inlet mass flow rate could shorten the pressurizing time interval and save the pressurizing gas mass.The proportion of the total energy addition of the tank absorbed by the ullage region,the liquid region and the tank wall respectively is greatly influenced by the injector types and more heat transferred into the ullage would result in a faster pressure rising rate. Gaseous hydrogen pressurization has a higher efficiency than gaseous helium pressurization. The simulation results presented in this paper can be used as a reference for design optimization of the pressurization systems of cryogenic liquid launch vehicles so as to save the mass of pressurizing gases and shorten the pressurizing time interval.
1. Introduction
Liquid Hydrogen (LH2) is a high energy and environmental friendly cryogenic propellant which is widely used in liquid launch vehicles, such as Delta-IV, Ariane-5 and CZ-3. Before the LH2 burning, the tank should be pressurized to the working pressure to make sure LH2 would not generate cavitation at the pump inlet. Because the saturation temperature of LH2 is very low, the total energy addition of the tank including the ullage, LH2 and the tank wall, composed by the heat leakage of tank wall from the environment and the heat carried in by the pressurizing gas would cause the heat and mass transfer in the tank. Thus, the ullage pressure would be greatly affected. If the ullage pressure is below the working pressure or changing dramatically,the rocket would be in an abnormal operation status. So it is necessary to predict the evolution of the mass and heat transfer within the LH2 tank and ensure enough pressurizing gas mass for pressurization.
The pressurization performance has important significance on the liquid launch vehicle and many experiments have been conducted focusing on the influencing factors on pressurization. Nein and Thompson1proved that the inlet temperature has the strongest influence on pressurizing gas mass consumption,and tank radius,distributor flow area,expulsion time and aerodynamic heating also have important effects on pressurization. Dewitt et al.2used a 29 cube foot vacuum jacketed tank with five injectors to study the LH2 discharge process,and the experimental results showed that injecting pressurizing gas in a concentrated stream towards the liquid surface can decrease pressurizing gas mass consumption during the expulsion. Olsen3measured the temperature near the placid interface in the pressurized tanks to make sure the influence of the mass and heat transfer. The results showed that the interfacial mass transfer had an appreciable effect on bulk gas and liquid conditions, while the heat transfer from the gas could probably be neglected in most cases. Lewis Research Center4-7used Gaseous Hydrogen (GH2) and Gaseous Helium(GHe) as pressurizing gases and the results showed that inlet gas temperatures, outflow rates, kinds of pressurizing gases,and injector geometries affected on pressurization behaviors and the pressurizing gas mass consumption decreases as the gas inlet temperature increases. Himeno et al.8observed dynamic motion of LH2 during pressurizing in micro-gravity conditions and the results showed that the injecting gaseous helium penetrated deeply into the LH2.Ludwig and Dreyer9,10used Liquid Nitrogen (LN2) as the modelling propellant pressurized with Gaseous Nitrogen(GN2)or GHe and found that condensation was the dominating mode of phase change for the GN2 pressurized experiments, while net evaporation appeared for the GHe pressurizing experiments. All the above experimental results provided important information for us to understand pressurization behaviors.
Besides experimental study,numerical simulation is playing a more and more important and effective role in predicting the tank pressurization behavior.To simplify matters,a thermodynamic equilibrium (0-D) model was established to study the pressurizing performance. Thompson and Nein11used ten dimensionless parameters to forecast the pressurizing gas mass consumption with an accuracy of 10 percent. Karimi et al.12gave derivation of formula to calculate the pressurizing cut-off time and pressure at the pump inlet. Steadman et al.13used Generalized Fluid System Simulation Program (GFSSP)building a transient model of gaseous helium pressurizing system. In their models, physical parameters had no relationship with spatial distribution, and the heat transfer between ullage,tank wall and liquid depended heavily on empirical formulas,while experimental results showed that the temperature stratification was produced along the axial direction4-7. To overcome shortcomings of 0-D method, One-Dimensional (1-D)method was built to study physical parameters distribution along the axial direction. Roudebush14suggested eight hypotheses to simplify the pressurizing process as a 1-D,non-steady, and non-viscous flow problem with heat addition into the ullage. The simulation results were in agreement with Lewis and Lockheed experiments. Masters15focused on the pressurizing gas mass consumption for the discharge of cryogenic liquid propellants, and the distribution of temperature and velocity along the axial direction also was studied. Kwon et al.16provided a more complex 1-D model which considered the effect of the internal hardware of the propellant tank and the pressurization system of Korea Sounding Rocket-III was calculated by this model. Though 1-D model was satisfied in predicting pressurizing gas mass consumption, the suitable heat transfer coefficient was difficult to make sure in different tanks. To reduce assumptions and empirical formulas in numerical simulation, two dimensional (2-D) was built by the commercial CFD software. Sasmal et al.17built a twofluid model by using Flow-3D software which considered the free surface as a solid boundary and evaporation-condensa tion was neglected. In this model, heat transfer rate between the liquid phase and wall was acquired from analyzing experimental results.To avoid those shortcomings,Adnani and Jennings18used a deformable mesh model to track the free surface and only modeled gas phase inside the tank, while the liquid phase temperature was assumed changeless. Wang et al.19,20established a 2-D axial symmetry VOF model by using Fluent software including the turbulence model and phase change model to calculate the LH2 discharge process. Chen and Liang21obtained the vaporization rate and pressure variation of a large-sized liquid hydrogen tank of a launch vehicle during atmospheric and self-pressurization parking basing on 2-D axisymmetric simulation. Above all, for the liquid hydrogen tank pressurizing, the current numerical simulations did not fully couple the heat and mass transfer, gaseous effects and turbulence effects,and also did not certify key factors affecting pressurization behaviors in detailed.
In this paper, in order to forecast the pressurizing process more accurately and comprehensively so as to give an important basis for controlling the pressurizing rate and decreasing the pressurizing gas mass consumption, a more realistic 2-D axial symmetry model combining phase change, species transport, and low-Reynolds number turbulence is established by using Fluent software. The VOF method is used to calculate the compressible phase and tank wall is also calculated together with fluids regions to consider heat transfer accurately.Furthermore,the influences of inlet mass flow rate,inlet temperature, types of injector and species of pressurizing gas on the pressurization in the LH2 tank are studied in detail and the decisive factors affecting pressurization will be determined.
2. Physical model
The cryogenic propellant tank is one of the core parts of a cryogenic liquid launch vehicle. Before rocket launching, the cryogenic propellant tank should be pressurized with the pressurizing gas. The purpose for tank pressurization is mainly to make sure that the liquid could flow into pump steadily and also has benefits to restrain liquid vaporization. This paper uses a NASA's liquid hydrogen spherical tank with three types of injectors,1.52 m diameter,and average 7.62 mm wall thickness.The LH2 tank of 1.76 m3volume is filled up to 95%with saturated liquid at 20.28 K and the rest is filled with ullage.4The straight pipe injects pressurizing gas in a concentrated jet toward the liquid surface,the radial injector injects pressurizing gas in the radial direction of ullage regions,and the hemisphere injector disperses pressurizing gas homogeneously in the radius direction of the hemisphere. When the pressurizing process starts, the pressurizing gas is injected into the tank by the injector. The ullage pressure increases quickly due to the mass and heat addition. The tank pressurization process ends until the ullage pressure rises from atmosphere to 0.349 MPa.The LH2 tank with a hemisphere injector is illustrated in Fig.1 and the schematics of those injectors are illustrated in Fig. 2.4
3. Mathematical model
3.1. Governing equation
The VOF model is often used to track the volume fraction of each of the fluids throughout the domain and appropriate for stratified or free-surface flows.22Li and Liang23,24used nitrogen as the working medium to study the vapor-liquid interface variation during self-pressurization. The experimental results prove that the vapor-liquid interface moves quickly into the quasi-stationary state after the self-pressurization begins. So the VOF model is selected to solve the pressurization process.The value of volume fraction lies between 0 and 1.In each control volumes, the volume fractions of all phases sum to unity

where α is the phase volume fraction and q represents the qth phase.In this paper,the number n is equal to 2.The subscripts‘‘l”and‘‘g”are also used to represent the liquid phase and the gas phase respectively.

Fig. 1 Schematic of LH2 tank with a hemisphere injector.
The continuity equation of the gas phase and the liquid phase is given as
where ρqand Smqare the density and mass of source of the qth phase respectively, ν is the velocity vector of the mixture.
The momentum equation of the mixture is given as

where p is the pressure, g is the gravity acceleration vector, ρ and μ are density and dynamic viscosity of the mixture respectively, and Fσis the surface tension.
The energy equation of mixture is given as

where λ is the thermal conductivity of the mixture, cpis the specific heat capacity of the mixture, T is the temperature of the mixture and Shis the energy source which is the energy transfer rate induced by mass transfer between liquid phase and gas phase.
The solid region of the LH2 tank is affected by external atmospheric environment and internal fluids.Due to the different physical properties of the gas and liquid in the tank, the convective heat transfer between the interior tank wall and the gas or liquid would be a great difference which would affect the heat conduction inside tank walls.The heat conduction inside the tank wall is given as

where ρs, cs, λsand Tsare the density, specific heat capacity,thermal conductivity and temperature of the solid region.
3.2. Turbulence model
A renormalization group theory providing an analyticallyderived differential formula for effective viscosity is used to account for low-Reynolds number effects. Consider the pressurizing process of the LH2 tank, the fluid in the tank is moving slowly, so the Renormalization Group(RNG) k - ε model is selected.25The solving equations of the turbulence model are given as

where k and ε represent the turbulence kinetic energy and dissipation rate respectively, Gkrepresents the generation of turbulence kinetic energy due to the mean velocity gradients,Gbis the generation of turbulence kinetic energy due to buoyancy,μeffis the effective turbulence dynamic viscosity.C3εis a function of velocity,represents buoyancy effects on ε,and its solution method is given in Ref.26. The model constants C1εand C2εare the empirical constants, the quantities αkand αεare the inverse effective Prandtl numbers for k and ε respectively,and they are set to 1.42, 1.68, 1.393 and 1.393 respectively.25The relationship between k and ε at low-Reynolds number is given as25
Fig. 2 Schematics of injectors.4

3.3. Phase change model
Evaporation-condensation is caused by molecular transition at the vapor-liquid interface from the view of kinetic gas theory. The number of escaping molecular and absorbing molecular is assumed near dynamic equilibrium. Evaporation is defined when the number of escaping molecular exceeds the number of absorbing molecular and condensation is defined when the number of escaping molecular is less than the number of absorbing molecular. A well-known equation for the net mass flux over the vapor-liquid interface is given by Knudsen27
where σ is evaporation or condensation coefficient, the value lies between 0 and 1, M is the molar mass, kg/mol, R is the gas constant and its value is equal to 8.314 J/(mol·K), and psat(Tl) is the saturation pressure at temperature Tl. Based on the Clausius-Clapeyron equation,28the relationship between pressure and temperature under saturation state is given as
where ΔH is the latent heat per unit mass, J/kg. If the liquid and gas near the interface are close to saturation state,Eq. (10) can be modified as

where Tsatis the saturation temperature. Substitution of Eq. (11) in Eq. (9) results in:

where

where the subscript‘‘v”represents propellant vapor,and Yvis the mass fraction of propellant vapor. In this paper, for GH2 pressurization,the propellant vapor is the same as the pressurizing gas, but for GHe pressurization, the propellant vapor is the gaseous hydrogen. To simplify Eq. (14), the mass transfer time relaxation factor β is provided by Lee.29In Lee's model,phase change is assumed to occur at quasi thermo-equilibrium state and the mass transfer is mainly dependent on the saturation temperature. So Lee's model is given as

where subscript ‘‘lg” represents the mass transfer from liquid phase to gas phase and subscript ‘‘gl” represents the mass transfer from gas phase to liquid phase.βgand βlare the mass transfer time relaxation factors of condensation and evaporation respectively. Numerical experiments from literatures have proved that excessively small β values would lead to significant deviation on the interfacial temperature and the saturation temperature, but too large β values would cause numerical convergence problems in solution.30-32As the works finished by Refs.29,33are according to water boiling and condensing experiments, the mass transfer time relaxation factors of condensation and evaporation are both fixed with number 0.1.This value has been widely used and acquires appropriate results. In present paper, the value of β based on NASA's experimental results would be given in Section 5.1.
Based on the VOF method, the energy equation is calculated for mixture. The energy source is given as

By adding mass source Jlgand Jglinto Eq. (2) and energy source Shinto Eq. (4), the heat and mass transfer caused by phase change is solved.
3.4. Mass diffusion model
When the pressurizing gas like GHe injects into the LH2 tank,the ullage would be a mixed gas of the propellant vapor and the pressurizing gas. The species distribution in the mixed gas would affect the mass and heat transfer near the vapor-liquid interface.Therefore,the species transfer between the mixed gases is considered. Considering that no chemical reactions happened within the LH2 tank, the species transfer is mainly caused by molecular diffusion between the propellant vapor and the pressurizing gas. The mixture of gas in the tank is regarded as consisting only of the propellant vapor and the pressurizing gas during pressurizing. Because the pressurizing gas is the mainly reason causing composition variation in the LH2 tank,the pressurizing gas component equation is selected to solve. The species transport equation is written as

where the subscript‘‘p”represents the pressurization gas,Ypis the mass fraction of pressurizing gas,Jpis the diffusion flux of pressurizing gas, Jpis given in turbulence flow as
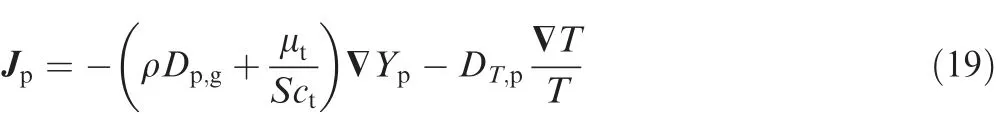
where Dp,gis the mass diffusion coefficient for pressurizing gas in the gaseous mixture, Sctis the turbulence Schmidt number,μtis the turbulent viscosity, and DT,pis the thermal diffusion coefficient which is given as34

where X is the molar volume fraction.If the mixture only consists of two species,the mass diffusion coefficient Dp,gbetween the pressurization gas and the gaseous mixture is equal to the mass diffusion coefficient Dp,vbetween the pressurization gas and the propellant vapor. Based on theory of Chapman-Enskog and potential function of Lennard-Jones,the mass diffusion can be written as35

where δ is the molecular diameter of the pressurizing gas or propellant vapor and δvpis the molecular collision diameter between the pressurizing gas and propellant vapor,δvp=(δv+δp)/2. The value of molecular diameter is 2.827 and 2.551 for GH2 and GHe respectively. ΩDis the collision integral, and the value is given as

Table 1 Value of constants in the collision integral.

Fig. 3 Schematics of relationships among physical models during solving procedure.

3.5. Relationships among models during solving procedure
Fig.3 gives the relationships among these physical models during solving procedure. The heat transfer between fluids refers to the gas phase and liquid phase and the solid boundary is handled as couple boundary conditions which are assumed that the heat flux and temperature at the boundary are equal.The temperature distribution of the tank wall can be solved through the heat conduction Eq. (5). The species transport Eq. (18) is solved for the gas phase including GHe and GH2 and the mass transfer model provides the value of Dp,vand DT,pto the species transport equation. The phase change model is solved near the vapor-liquid interface and the coupled solid walls, and the phase change model would provide the mass source Smqto Eq. (2) and the energy source Shto Eq. (4). The phase change model would be affected by the GH2 molar concentration and solving the species transport equation would give the value of Yp. The turbulence model would provide the value of Sctand μtto solve the diffusion flux Jpin the mass transfer model. Because the pressurizing gas temperature at the tank inlet is larger than the temperatures of the fluids in the tank and the tank walls, the physical properties variation with temperature is considered. Through coupling those models into the governing equations, the effects of turbulence flows, phase change, species transfers and heat transfer can be comprehensively solved.
4. Numerical simulation method
The commercial software Fluent 15.0 is selected to simulate the NASA's LH2 tank during pressurizing.Because the LH2 tank and the injector have an axisymmetric structure, a 2-D axial symmetry model is established to decrease the amount of calculation.Considering that orifices of the injector have complex structure and arrangement, all orifices are simplified into one orifice. Compared with the experimental injector,the injectors are simplified to shorten the radius for the hemisphere injector or the height for the radial injector and keep the equal open area, the same distance between the bottom of the injector and the liquid surface, and the same spray angle direction.The vapor-liquid interface,fluids near the tank wall and fluids near the injector need generate more small grids. Fig. 4 gives the computational mesh of the tank, where the whole mesh of the tank with a hemisphere injector is illustrated in Fig. 4(a) and the partial meshes near the different types of injectors are illustrated in Fig. 4(b)-(d).

Fig. 4 Computational mesh of NASA's LH2 tank.
Because the pressurizing gas has a higher temperature than fluids in the LH2 tank, the physical properties variation with temperature is considered during pressurizing. For the gas phase, the density is calculated by using the perfect gas law.For the liquid phase, the density is calculated by the method of Boussinesq approximation which considered the liquid density variation with temperature and the specific parameters for LH2 are given in Ref.36. The buoyancy variation due to the LH2 density variation is reflected by the body force in Eq. (3). The other properties of fluids are first order interpolated based on Ref.37. Considering that gas near the vapor-liquid interface is not dissolved and the interface keeps quasi static, the VOF method is selected to simulate the two phase problem. The RNG k - ε model is selected to low-Reynolds number flow and the ‘‘enhanced wall function” is selected to solve the viscous sublayer near walls. For GHe pressurizing,the species transport model is selected to calculate the mass diffusion between GH2 and GHe and the effect of turbulence on mass transfer is also considered. Because the operating process of the LH2 tank is a transient process with low speed motion, the pressure-based transient solver is selected and the Pressure Implicit with Splitting of Operators(PISO) algorithm is used to couple the pressure and velocity fields. For the view of spatial discretization, Green-Gauss Node Based scheme is used for the discretization of the gradient,Body Force Weighted scheme is used for the discretization of the pressure, and Geo-Reconstruct scheme is used for discretization of volume fraction, while other terms in control equations are dispersed with second order upwind schemes.The mass source Smqand the energy source Share added to Eq. (2) and Eq. (4) respectively via User-Defined-Function(UDF)and the thermal diffusion coefficient DT,palso is added to Eq. (19) via UDF. The under relaxation factors are set to 0.15 for all variables and the residuals for continuity equation and energy equation are set to 10-4and 10-8respectively,while other residuals for control equations are set to 10-4.During the iterations of the solution loop,the convergence will be met when all residuals are below the set value.
After the physical models and the solve methods for the pressurized process have been introduced, the initial and boundary conditions are acquired from the experimental data of Ref.4. The initial ullage temperature distribution is determined according to an iteration process before pressurization,that is,firstly it is given according to the initial GH2 mass from the experiment and the ullage temperature is assumed linear distribution along the axial direction, secondly the perfect gas law is used to solve the ullage mass until it is equal to the experimental value.The inlet mass flow rate of the pressurizing gas is set to the average value based on the total mass addition.17The initial and boundary conditions are illustrated in Table 2 and the simulation cases are illustrated in Table 3,where the subscript ‘‘0” and ‘‘w” represent initial conditions and tank wall respectively.
A sensitivity study on mesh spatial and time step resolution has been implemented to find the adequate mesh and time step.Three meshes with N=64645, 88513 and 201890 grids have been used to calculate the LH2 tank pressurization with a hemisphere injector respectively. The calculated pressure is illustrated in Fig. 5(a). Three time steps with Δt=0.001,0.002 and 0.004 s also have been used to calculate the pressurizing process respectively, and the calculated pressure is illustrated in Fig. 5(b). The calculated results show nearly identical results under the three meshes and time steps. From the view of accuracy and convergence, the ullage pressure (p)with 88513 grids and time step 0.002 s is adequate to make sure relatively high solving speed and accuracy.Thus,this group of mesh and time step is selected to calculate the LH2 tank pressurization.
5. Results and discussion
5.1. Determination of β and validation of CFD model
Because the theoretical value of the mass transfer time relaxation factor β is difficult to solve in the actual situation, the simplified method proposed by Lee29has been widely used to determine the value of β. The default value acquired from water boiling process is 0.1, which is used most widely in simulation the phase change.Considering that the phase change of LH2 occurs under the cryogenic condition, the value of βshould be reconfirmed. β was set to 0.2 in hydrogen selfpressurization38,39and 1.0 in the hydrogen discharging process.40The current research acquires an appropriate value of β according to simulation results based on the NASA's experimental data,4as shown in Fig. 6 and listed in Table 4. Fig. 6(a) shows that the ullage pressure increases as β decreases except the value of β is set to 0 which means without consideration of the phase change.Though the value of β is different in the phase change model,those simulations have the same variation law of ullage pressure. Fig. 6(b) shows that the phase change rate increases as β increases. If the value of β is small,such as below 0.1, the ullage pressure, average ullage temperature(TA,g)and liquid temperature(TA,l)are closed to without phase change simulation results. As Table 4 listed, without considering phase change, the deviation of the ullage pressure and mass (mg) compared with experimental results are 6.2%and 7.2% respectively. According to the phase change mass and ullage pressure, there is an appropriate value of β lying between 1.0 and 10.0. The mass of condensation (me) is 8.6 g and 7.5 g respectively as β is set to 6.0 and 5.0 which are both close to the experimental mass of condensation,but the ullage pressure as β set to 6.0 is more close to the experimental ullage pressure. Considering that the ullage pressure and condensing mass vary in a small range between 5.0 and 6.0 and the calculating process also keeps stable and convergent, β is set to 6.0 in the current simulations.Compared with the experiment,the simulation results prove that the deviations of the pressurizing gas mass consumption, condensing mass and ullage temperature are 3.0%, 7.5% and 4.0% respectively.

Table 2 Initial and boundary conditions for CFD simulations.

Table 3 Main comparative parameters for CFD simulating tests.

Fig. 5 Independence verification of grids and time steps for simulations.
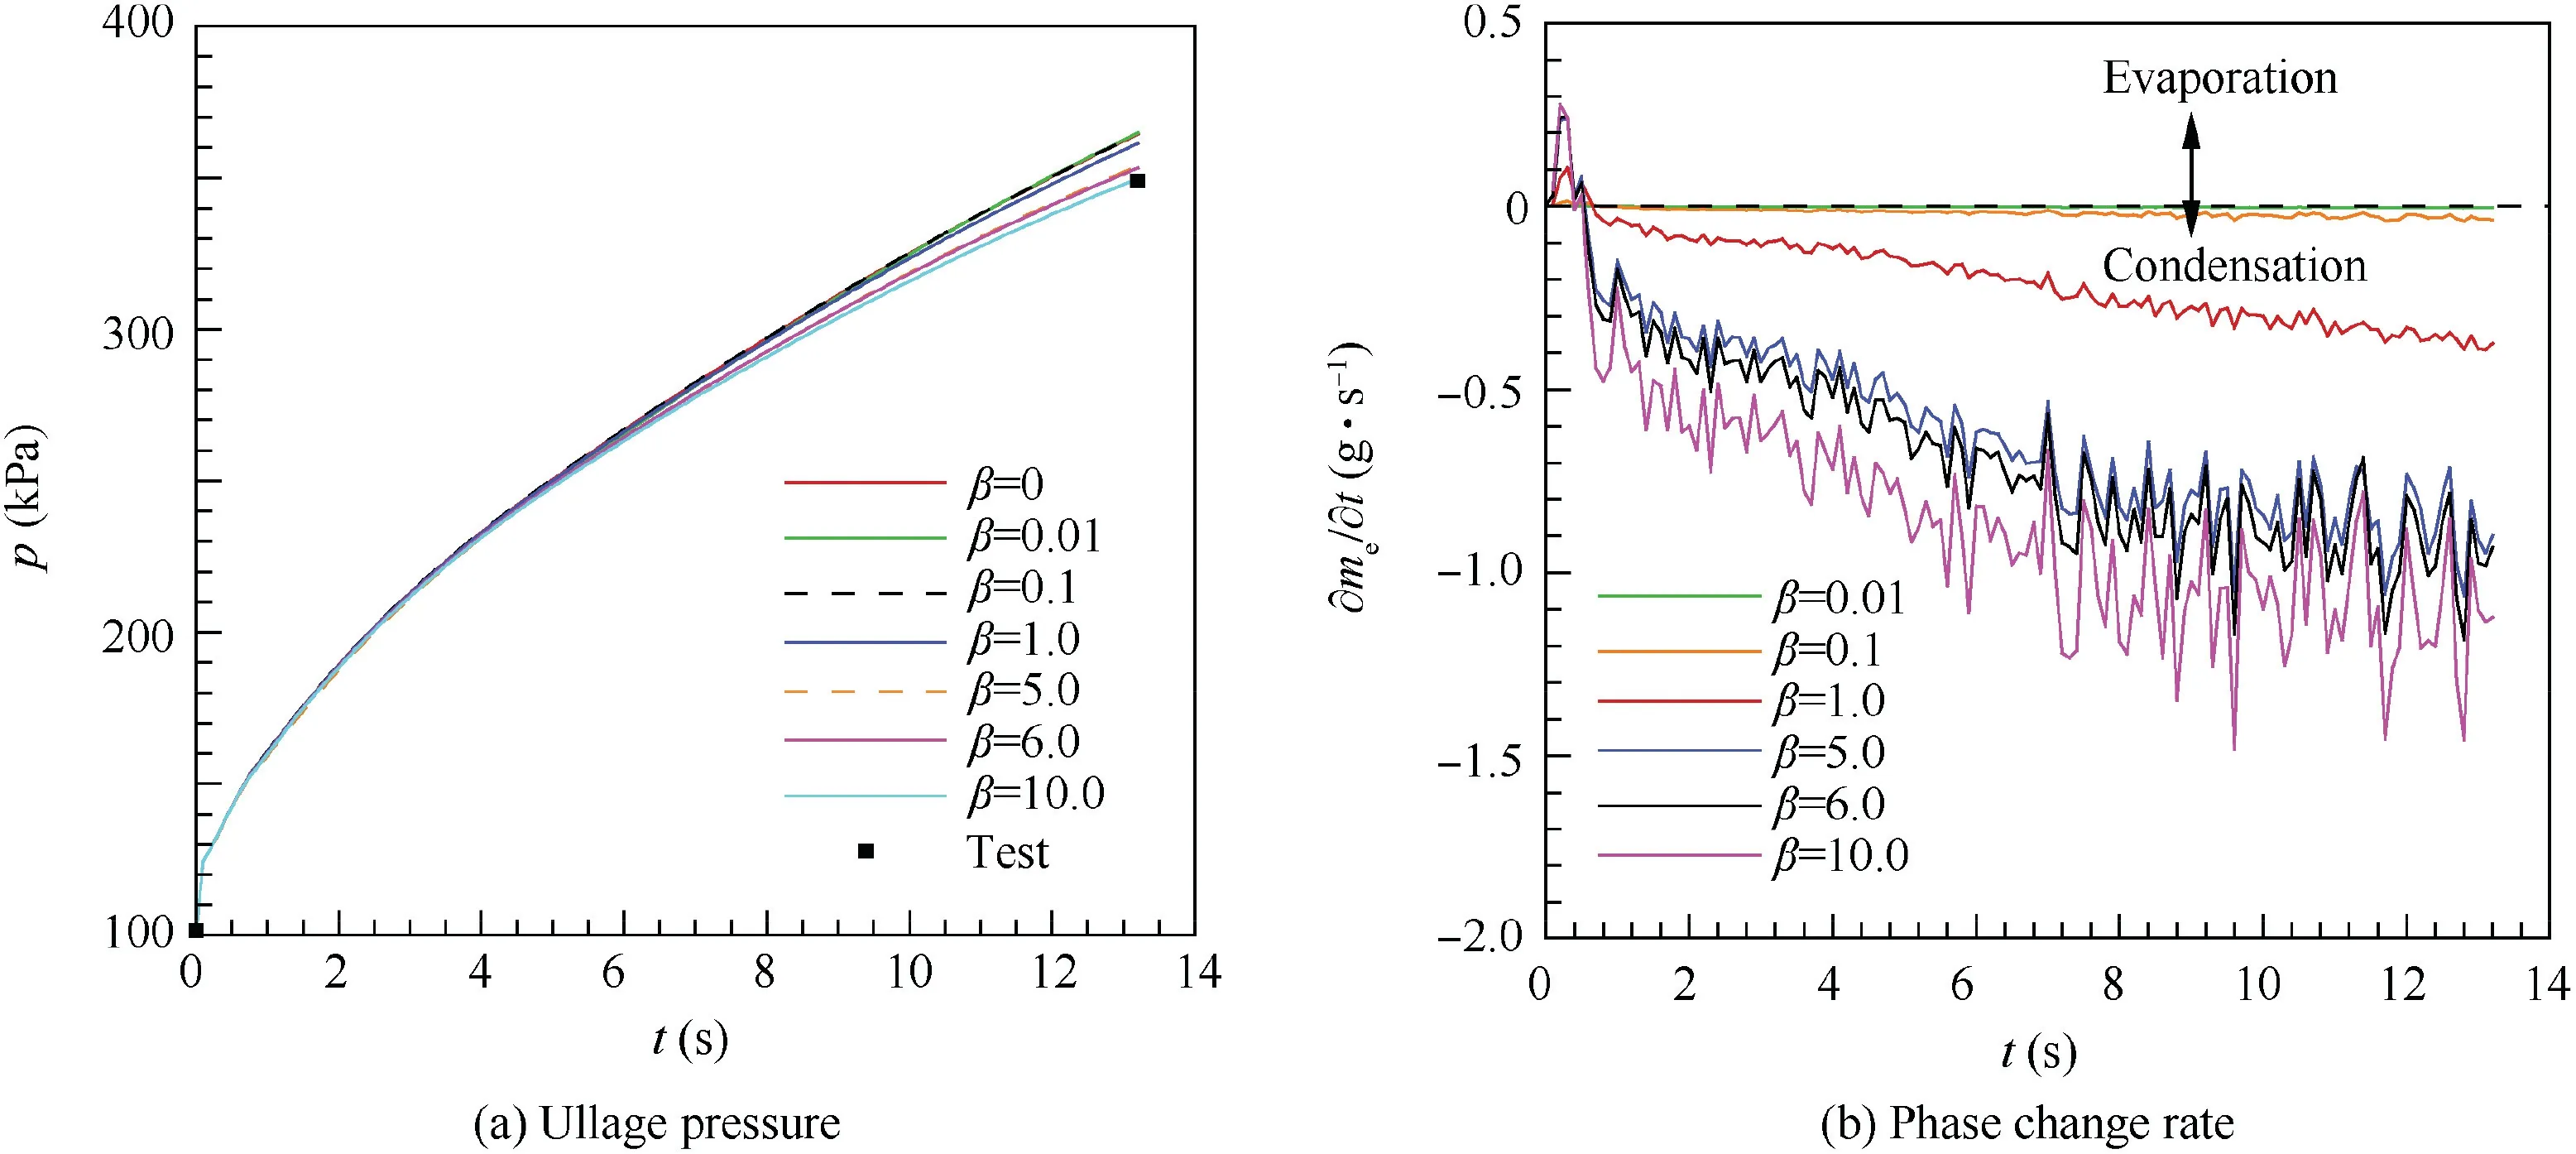
Fig. 6 Comparison of ullage pressure and phase change rate during pressurizing at different values of β.
The influence on the mass transfer is also listed in Table 4.As the value of β increases, the ullage condensing rate is increasing quickly. Based on 1-D model,14the average ullage temperature was obtained about 53 K but the experimental average ullage temperature is about 56 K.3,4Though the current simulated average ullage temperature 58.24 K is greater than the experimental ullage temperature,the CFD simulation is more accurate than the 1-D model.Fig.7(a)gives the ullage pressure variation with time. When the phase change is taken into account, the ullage pressure increases with time and the ullage pressure rising rate decreases with time until remaining stable about 10 kPa/s. The maximum ullage pressure rising rate is about 50 kPa/s at the beginning of pressurizing process.The deviation of the ullage pressure between the cases with and without phase change becomes greater after 4 s.Fig.7(b)gives the ullage mass and phase change rate variation with time.The ullage mass is increasing linearly with time while the phase change rate fluctuates with time. Before 0.5 s, LH2 is vaporizing as GH2,the maximum vaporizing rate is 0.244 g/s,and the vaporizing rate decreases with time. After 0.5 s, GH2 is condensing near the vapor-liquid interface and the condensing rate firstly shows increasing with time then remaining almost steady. The maximum condensing rate is 1.183 g/s during the pressurizing process. Fig. 7(c) gives the average fluids temperature,tank wall temperature (TA,s)and the saturation temperature variation with time. During the whole pressurizing process, the average ullage temperature rises faster than the average liquid and tank wall temperatures.The average ullage temperature is higher than the saturation temperature. While the average tank wall and liquid temperatures are lower than saturation temperature, the average liquid temperature remains approximately constant and the average tank wall temperature is increasing with time. Fig. 8 give the contours of temperature distribution, velocity and phase change location after pressurizing process ended at 12.8 s respectively.Fig. 8(a) shows that temperature stratification is produced in the ullage region and the surface liquid region along the axial direction, and the liquid bulk temperature is almost unchanged. The maximum temperature difference in the surface liquid region is 5.12 K until the pressurization process ends. The ullage temperature near the injector is higher than other regions.Fig.8(b)shows that the LH2 remains nearly stationary and the ullage moves slowly with the maximum speed about 0.7 m/s near the hemisphere injector.Fig.8(c)shows the phase change location within the LH2 tank at 12.8 s. The red region, blue region and green region represent for condensation, vaporization and without phase change respectively.The GH2 condensation near the vapor-liquid interface predominates in the phase change process and the hot pressurizing gas causes only small amount of LH2 to vaporize. Most of LH2 and GH2 are still in the original states without phase change.
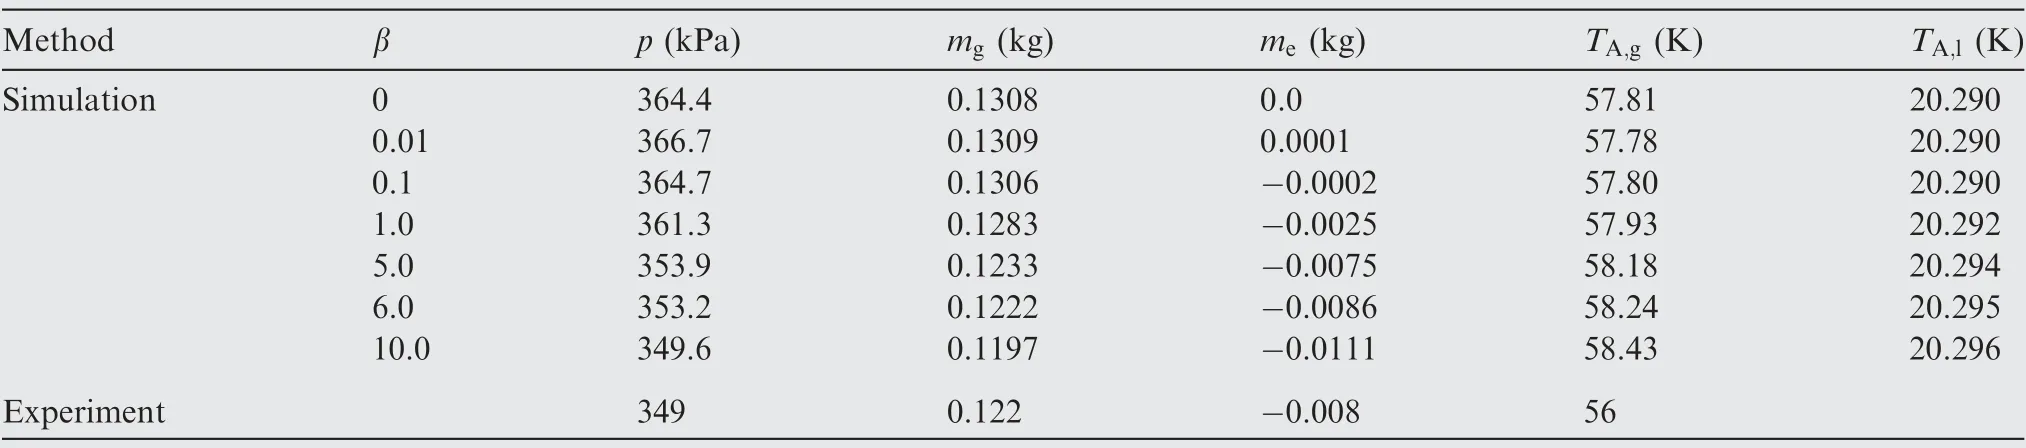
Table 4 Simulated and experimental results after pressurizing process ends at 13.2 s.
The reasons for the above phenomena can be explained as follows. LH2 is in the saturation state before the pressurizing process begins. When the hot pressurizing gas flows into the LH2 tank,the ullage and surface liquid are heated by the pressurizing gas. The heat absorbed by the surface liquid leads LH2 quickly vaporizing near the vapor-liquid interface. The initial energy and mass adding effects make the ullage pressure rising quickly at the beginning. As the pressurizing process proceeds, the saturation temperature of LH2 increases as the ullage pressure rises and more proportion of the heat absorbed by the surface liquid so as to raise the surface liquid temperature approaching its saturation state. Because the surface liquid gains the extra heat from pressurizing gas, the surface liquid temperature increases more quickly than the bulk liquid temperature. So the temperature stratification along the axial direction is formed, and the liquid convection along the axial direction is suppressed by the temperature stratification. Due to the convection suppressed, the difference temperature between surface liquid and bulk liquid would increase with time, and more heat would be absorbed by the bulk liquid from the surface liquid by the method of heat conduction.To make sure the temperature at liquid surface in the saturation state, the surface liquid would decreases the vaporizing rate and more GH2 near vapor-liquid interface would be used to increase the condensing rate. So the phase change velocity transforms from vaporization to condensation with pressurizing process proceeding.The inlet mass flow rate in the pressurizing process with the hemisphere injector is only 2.12 g/s, so the hemisphere injector is dispersing the pressurizing gas slowly, and only a small ullage region near the hemisphere injector is affected.Because the inlet mass flow rate of pressurizing gas is dominated in the ullage mass variation, so the ullage mass is increasing with time during the whole pressurization. The heating effect by the pressurizing gas leads to the ullage near the hemisphere injector moving along upward direction of axial. After the pressurizing process ends at 12.8 s, the simulations show that the ullage, the liquid and the tank wall absorb separately 60%, 17% and 23% of total energy addition of the tank. More energy absorbed by the ullage leads to a faster average ullage temperature rising rate than the liquid and tank wall. Pressurization would benefit from the proportion increasing of total energy addition absorbed by the ullage.
In the next sections,the rules of physical parameters variation with time are obtained and analyzed through simulating the pressurizing process with a hemisphere injector and comparing with the experiment. The variable-control approach,in which only one factor is different while the other conditions keep the same as listed in Table 3, is used to study the main factors affecting the pressurization behaviors.
5.2. Effect of inlet temperature of pressurizing gas
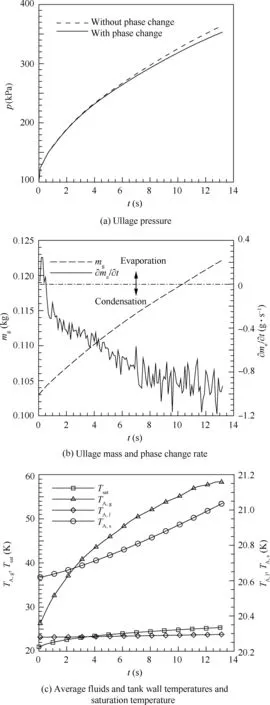
Fig. 7 Variation of parameters with time during pressurizing.

Fig.8 Contours of temperature distribution, velocity and phase change location when pressurization ends at 12.8 s.
In order to research the inlet temperature of pressurizing gas affecting pressurizing process, the inlet temperature Tin=258,278 and 298 K are used to calculate the pressurizing process. As illustrated in Fig. 9(a), the ullage pressure in the LH2 tank is the highest at the same time when the inlet temperature of pressurizing gas is 298 K. The pressurizing time requirement is 13.9, 12.8 and 11.8 s respectively when the ullage pressure reaches 349 kPa.By analyzing results gains that increasing the inlet temperature by 20 K would reduce about 8% pressurizing time interval under pressurizing with the hemisphere injector at 2.12 g/s. Fig. 9(b) shows that the phase change rate is the fastest and the ullage mass increases the lowest when the inlet temperature of the pressurizing gas is 298 K.The ullage mass is respectively 0.1247, 0.1217 and 0.1196 kg after the pressurizing process ends.Although the inlet temperatures are different, the net evaporation appears only at the beginning of the pressurization and the net condensation predominates after the beginning of the pressurization. Fig. 8(a),Figs.10 and 11 give contours of temperature distribution when the pressurization process ends.The saturation temperature of hydrogen is about 25.4 K under 349 kPa and the location of saturation temperature is located at the vapor-liquid interface.The temperature difference of the ullage between different inlet temperatures mainly appears near the injector and the ullage temperature near the injector increases as the inlet temperature increases. Meanwhile, compared with the other inlet temperatures,the thickness of surface liquid region is the largest when the inlet temperature is 298 K. But the inlet temperature variation has a less effect on the bulk liquid temperature.
The physical mechanism for the above phenomena can be explained as follows. The ullage pressure rising rate depends on the amount of the heat and mass addition.Considering that the simulations with different inlet temperatures have the same inlet mass flow rates, the ullage pressure rising rate is mainly determined by the heat absorbed rate. When the inlet temperature of the pressurizing gas is increasing,more heat would be brought into the LH2 tank by the pressurizing gas. Due to pressurizing with the hemisphere injector, the ullage absorbs most of the total heat addition of the tank. Meanwhile, the ullage has a faster speed and higher proportion of heat absorption with the higher inlet temperature of pressurizing gas, so the ullage temperature and pressure would rise more quickly with higher inlet temperature of pressurizing gas. This means that the surface liquid needs absorb more heat to keep in the saturation state, so ullage near the vapor-liquid interface would condense faster with higher inlet temperature of pressurizing gas. The reason of surface liquid region enlarging as the inlet temperature increasing is that the convection in LH2 is suppressed more seriously. Due to the slow injection velocity of the pressurizing gas,the obvious temperature difference in the ullage mainly appears near the injector.Conclusion can be acquired that increasing the inlet temperature of the pressurizing gas benefits to decreasing the pressurizing gases mass consumption and shortening the pressurizing time interval.
5.3. Effect of inlet mass flow rate of pressurizing gas
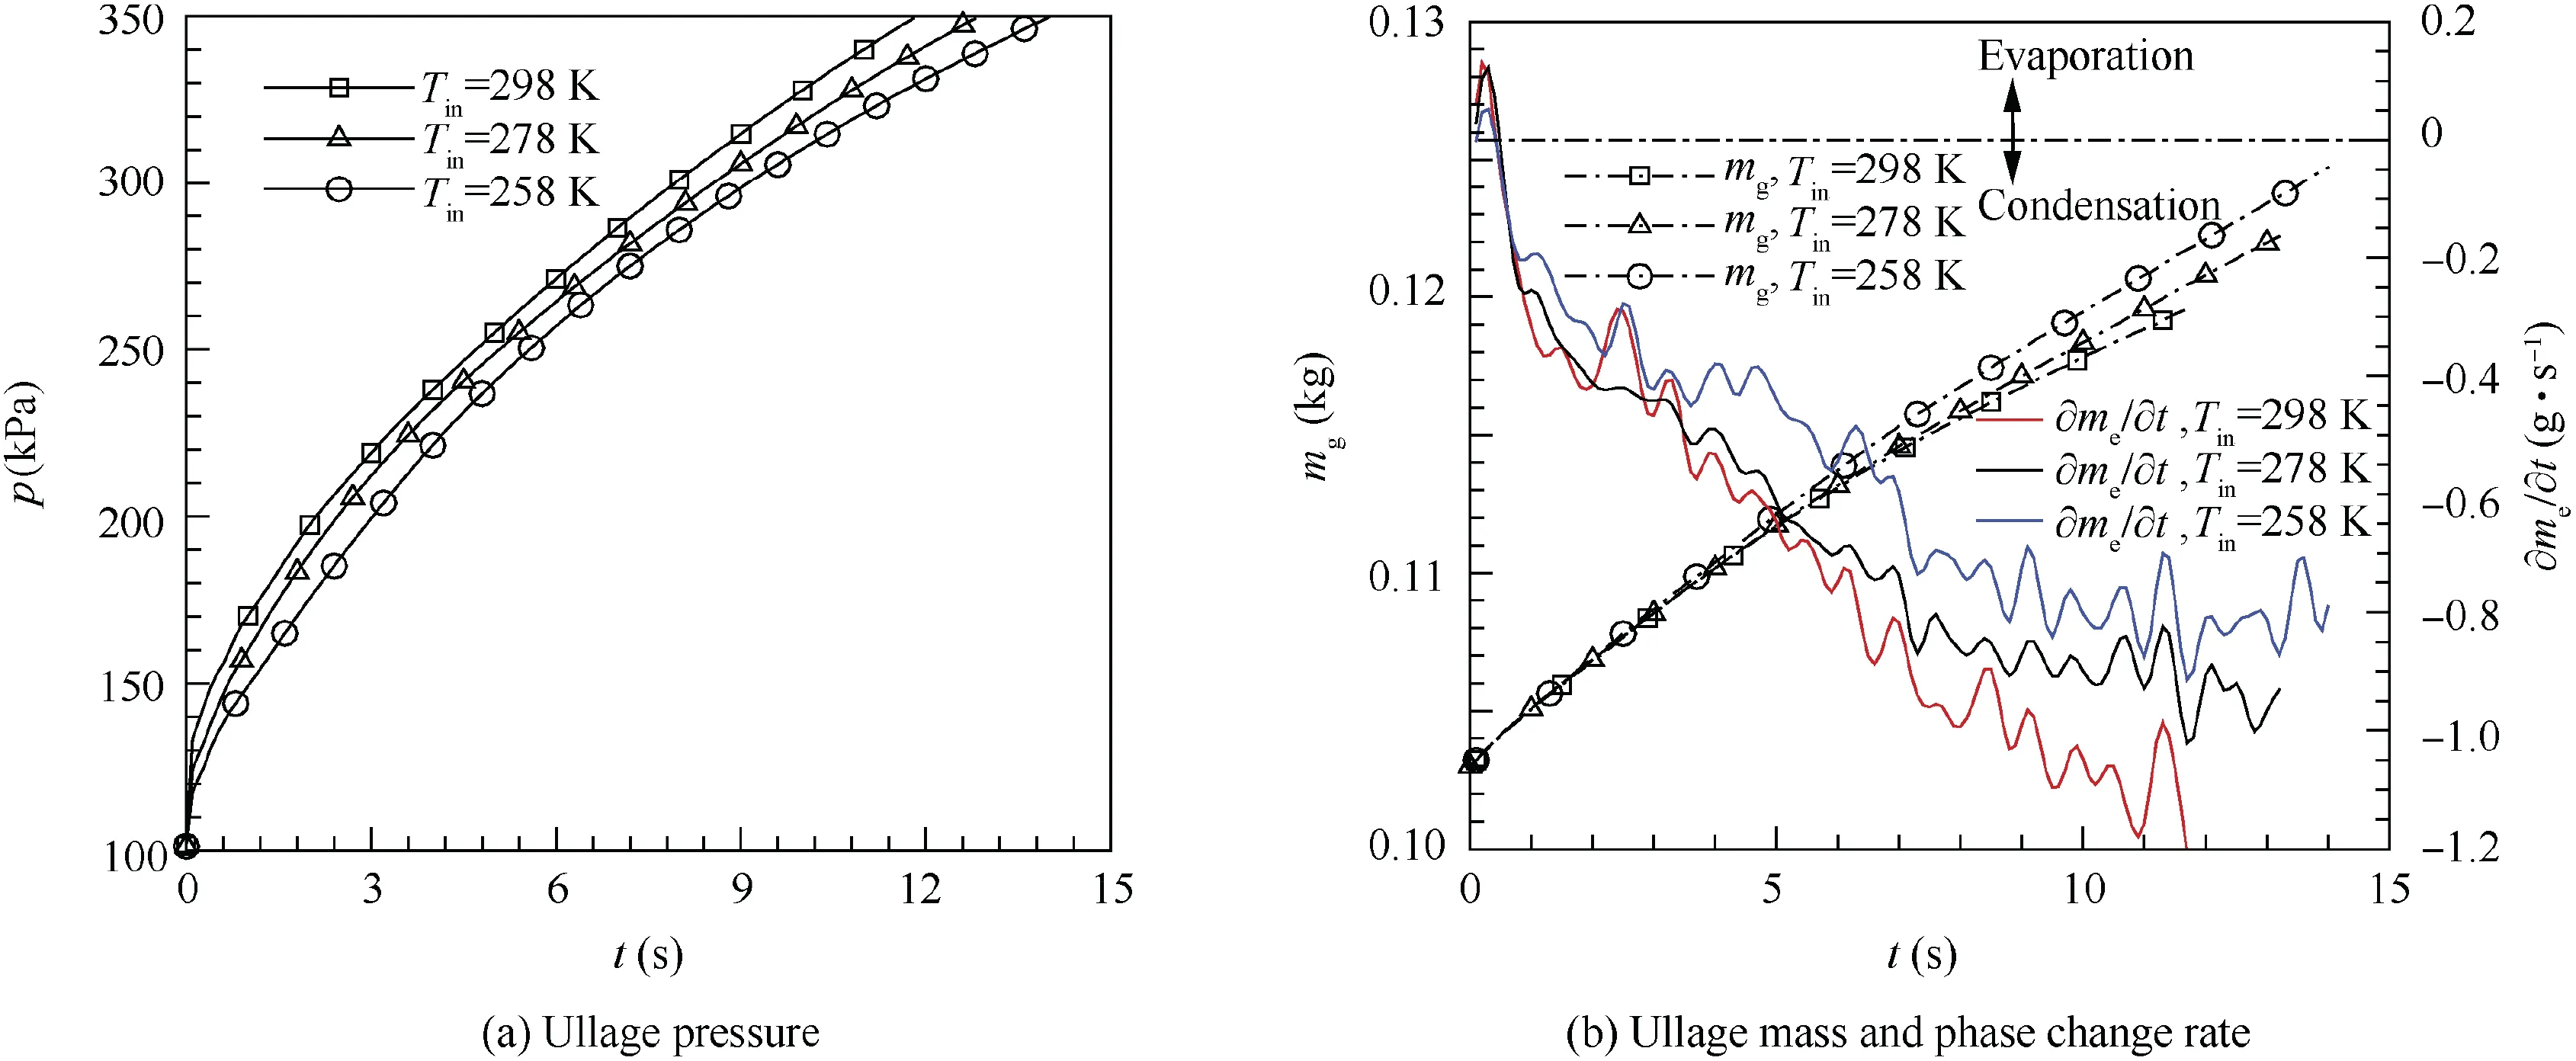
Fig. 9 Variation of parameters with time at different inlet temperatures.

Fig. 10 Contours of temperature distribution with 258 K inlet temperature when pressurization ends at 13.9 s.

Fig. 11 Contours of temperature distribution with 298 K inlet temperature when pressurization ends at 11.8 s.
To study effects of the inlet mass flow rate of pressurizing gas on pressurization, the inlet mass flow rate of GH2 pressurization ˙min=4.24, 2.12 and 1.06 g/s are used to calculate the pressurizing process separately.Fig.12(a)gives the ullage pressure variation with time. The ullage pressure rising rate is the highest when the inlet mass flow rate of the pressurizing gas is 4.24 g/s, and the ullage pressure is increasing with time when the inlet mass flow rate is 4.24 g/s and 2.12 g/s.While the inlet mass flow rate is 1.06 g/s, the ullage pressure rising rate is decreasing with time until the value is close to 0, then increasing slowly with time after 75 s. Fig. 12(b) shows that the pressurizing gas mass consumption is the least and the condensing rate is faster at the same time when the inlet mass flow rate is 4.24 g/s.While the inlet mass flow rate is 1.06 g/s,the condensing rate is close to the inlet mass flow rate after 65 s,and the ullage mass remains nearly constant about 0.138 kg. Figs. 12(c) and 12(d) give the average temperatures of fluids and tank wall variation with time. Compared with the other two inlet mass flow rates,the inlet mass flow rate with 4.24 g/s has the fastest rising rate of the average temperature of liquid, ullage and tank wall. The average liquid and tank wall temperatures are increasing during the whole pressurization for all three inlet mass flow rates, while the average ullage temperature shows different performances. When the inlet mass flow rate is 4.24 g/s and 2.12 g/s,the average ullage temperature is increasing with time.But pressurizing with 1.06 g/s,the average ullage temperature increases quickly before 20 s,then almost remains approximately constant among 20-50 s,finally decreases slowly after 50 s. Though the ratio of inlet mass flow rate of pressurizing gas is 1:2:4, the ratio of pressurizing time requirement is 24.96:2.67:1, which means that the ratio of total mass consumption on the pressurization is 6.24:1.34:1. So increasing the inlet mass flow rate has great benefits to save the mass of pressurizing gases.
Considering that other conditions of the simulations with different inlet mass flow rates are the same, the heat addition rate and the inlet velocity would be proportional to the inlet mass flow rate. Pressurizing with high inlet mass flow rate would increase the heat addition rate and the convective heat transfer, so the high inlet mass flow rate has more quickly rising rates of the ullage pressure and the average temperature.Without considering the difference of convective heat transfer,the pressurizing gas consumption should be equal in the three simulation tests.41In actual,the convective heat transfer is the key reason why the total mass of the pressurizing gas shows difference with different inlet mass flow rates.Based on the calculation results, the ullage region, liquid region and tank wall absorb 38%,30%,and 32%of the total energy addition of the tank separately when the inlet mass flow rate is 1.06 g/s. So pressurizing with lower inlet mass flow rate would make the total energy addition distribution more uniform in the tank,and the extended pressurizing time leads to more ullage mass condensing near the vapor-liquid interface. Conclusions can be drawn that increasing the inlet mass flow rate can improve the heat absorbing by the ullage and decrease the total mass condensing.And when the inlet mass flow rate could not maintain the heat balance in the ullage region,the pressurizing process would be extended and even become invalid.
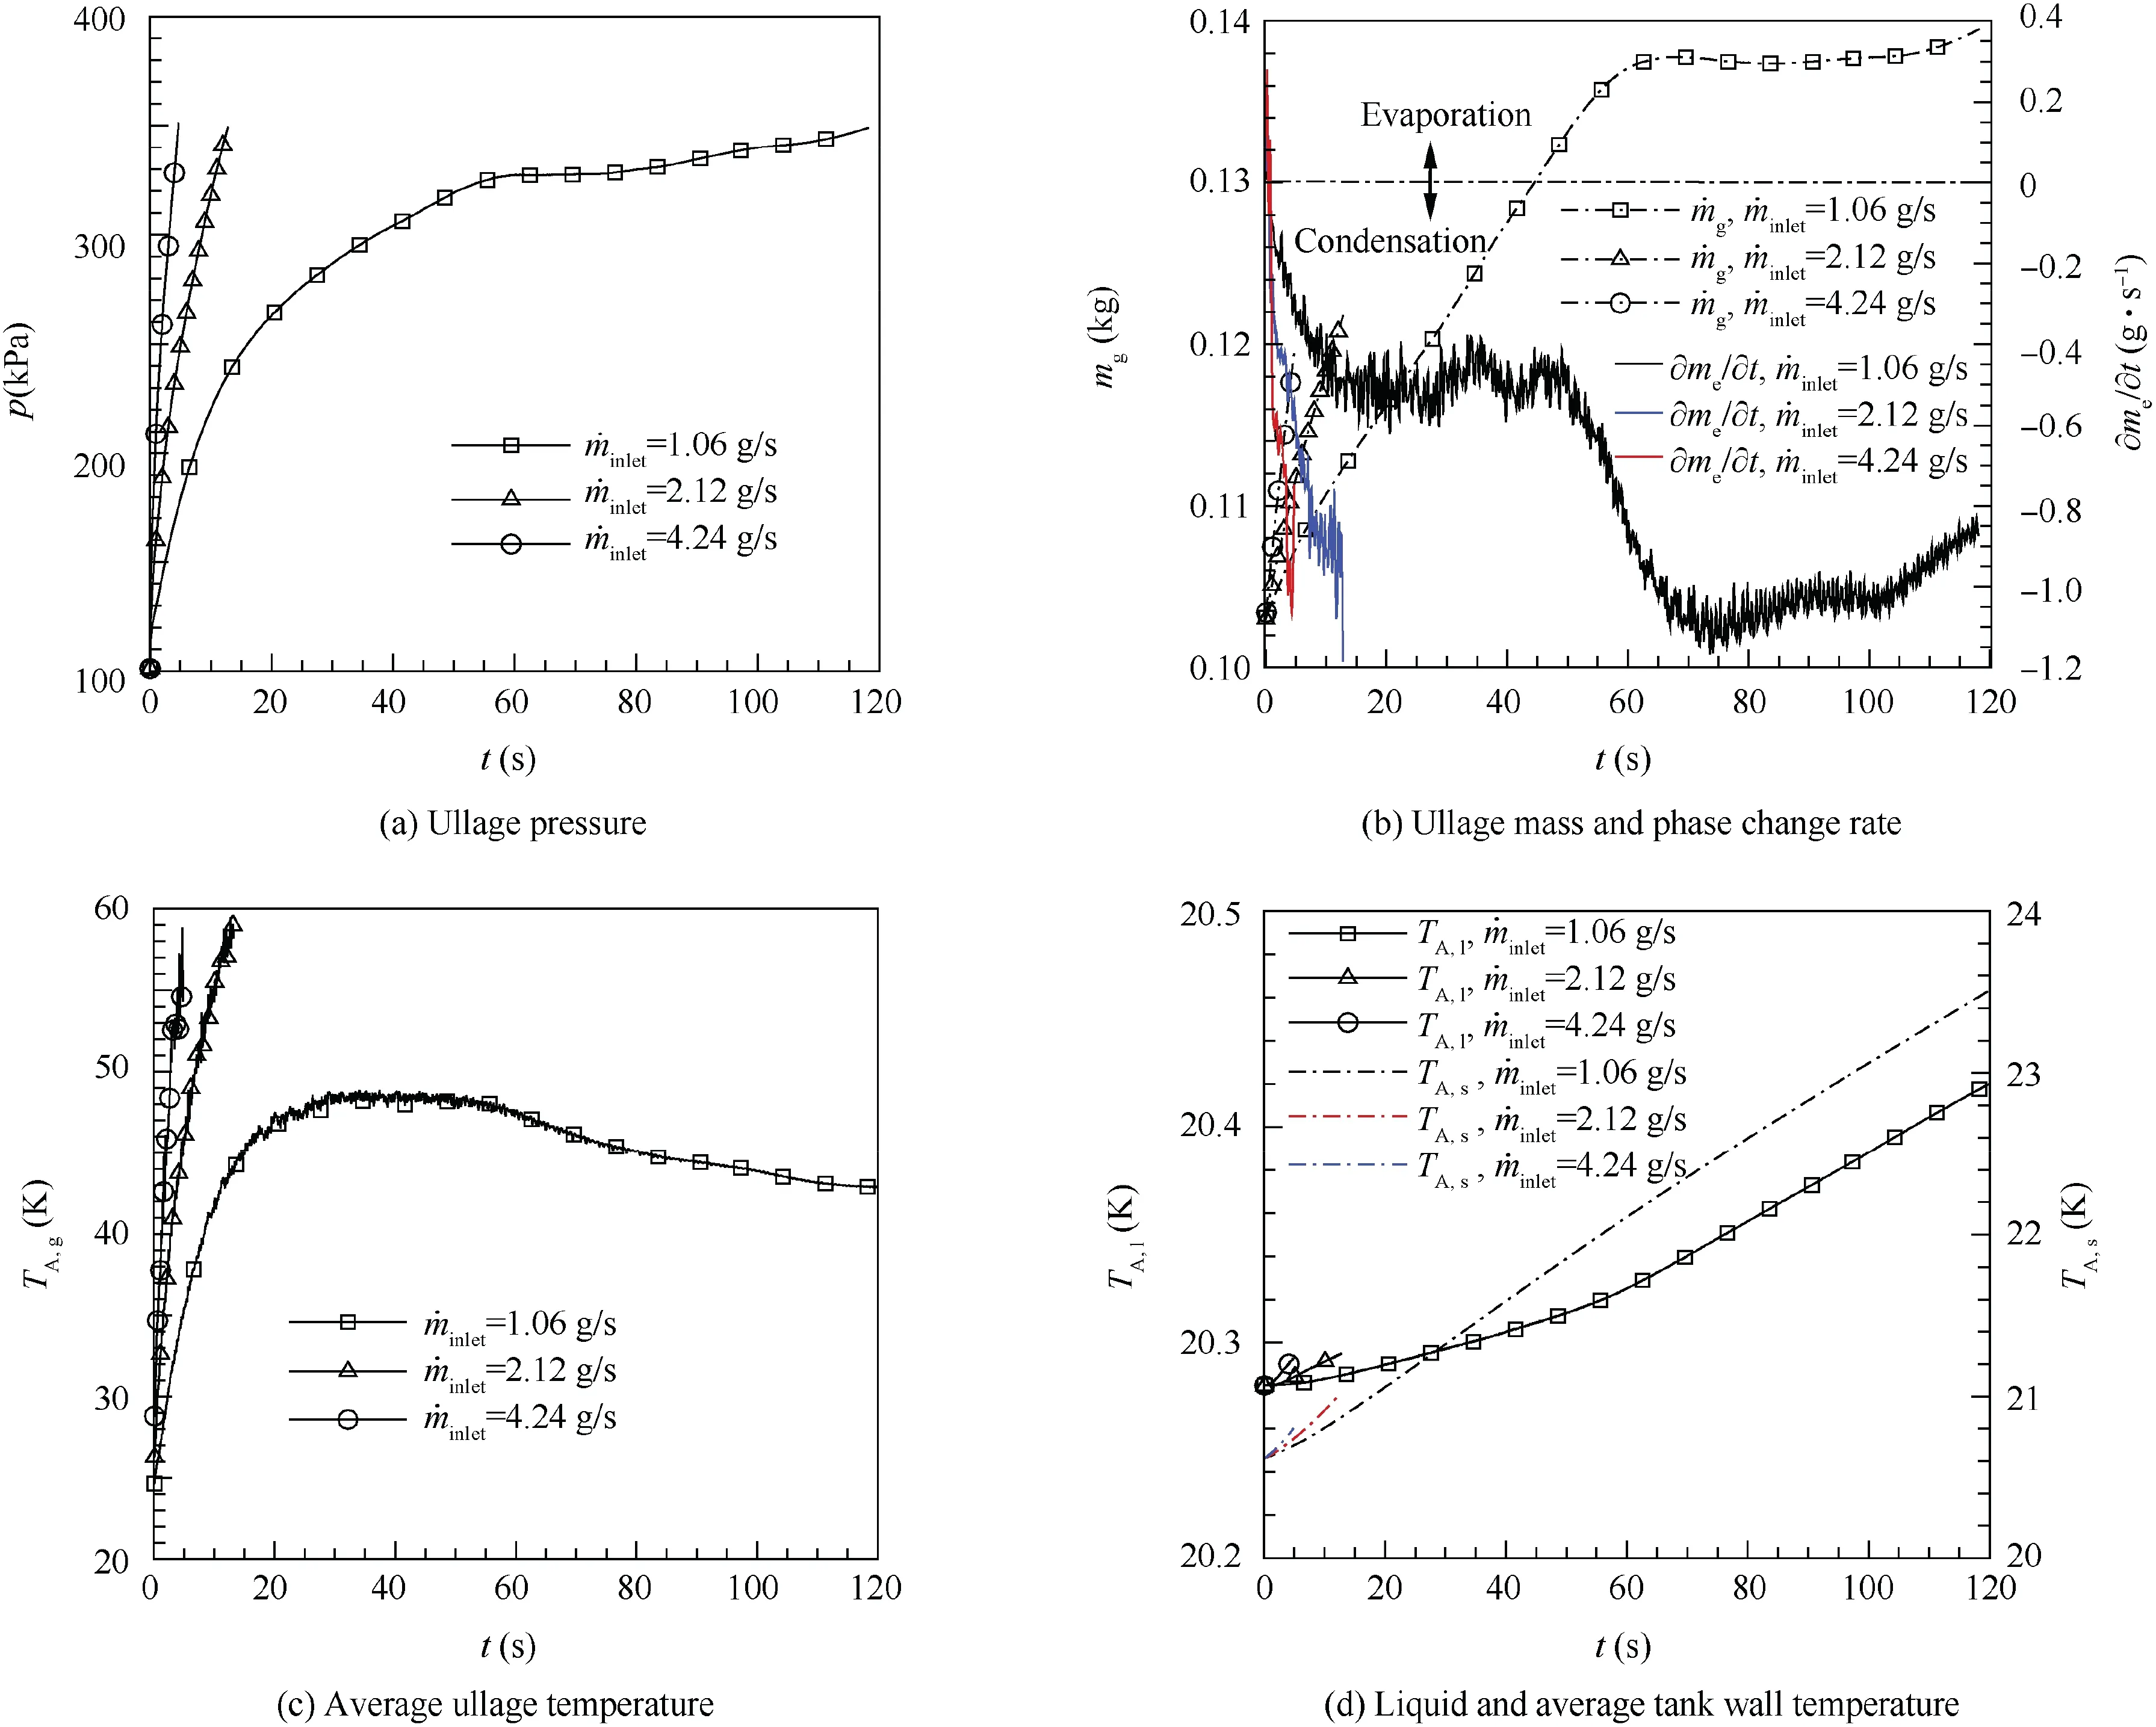
Fig. 12 Variation of parameters with time at different inlet mass flow rates.
5.4. Effect of injector types
The injector types often have three forms: radial (R), hemisphere (H) and straight pipe (S), and the pressurizing gas injects into the tank with difference directions by the injector.In order to study effects of injector types on the LH2 tank pressurization, three forms of injectors which are mentioned above are used to calculate the pressurizing process respectively. Fig. 13 gives results about the ullage pressure, ullage mass and phase change rate variation with time respectively.As is shown in Fig. 13(a), the pressurizing time requirement is 12.24, 12.8 and 17.73 s respectively for the radial injector,the hemisphere injector and the straight pipe injector, and the straight injector has a lowest ullage pressure rising rate than the others injectors.Fig.13(b)shows that the ullage mass rising rate is the highest and the liquid remains vaporizing during the whole pressurizing process with the straight pipe injector, while the LH2 tank is pressurized with the hemisphere injector and the straight pipe injector, the ullage remains condensing except at the beginning of pressurization. The condensing rate with the hemisphere injector is more quickly comparing with the radial injector. Fig. 8(a), Figs. 14 and 15 give the contours of temperature distribution when the pressurizing process is over. Compared to pressurizing with the straight pipe injector, the ullage temperature is higher and the axial thermal stratification is more intense within the ullage when pressurizing with the radial injector and the hemisphere injector. The temperature stratification in the surface liquid with the straight pipe injector shows that the temperature in the center is higher at the same liquid level, while the temperature in the center is lower with the radial injector and hemisphere injector. Fig. 16 displays sketches of velocity vectors with different injectors. Fig. 16(a) and 16(b) show that the pressurizing gas firstly flows into the ullage, then changes the motion direction to move towards tank walls due to buoyancy effect, and finally moves along the wall towards to the surface of liquid. Fig. 16(c) displays that the pressurizing gas injects into the ullage with concentrated flow, directly impinges the vapor-liquid interface, and then changes its motion direction to move towards the ullage due to the vapor-liquid interface obstructing.
The reasons for the above phenomena can be explained as follows. The mass and heat transfer within the LH2 tank is greatly affected by the motion direction of pressurizing gas.The radial injector injects pressurizing gas parallel to vaporliquid interface, the straight pipe injector injects all pressurizing gas towards vapor-liquid interface, and the hemisphere injector evenly injects pressurizing gas in the hemispherical direction. The phase change near the vapor-liquid interface is mainly determined from the difference of the heat absorbed by bulk liquid and the heat provided by the pressurizing gas.Compared with the hemisphere injector and the radial injector,the straight pipe injector has the minimum open area.Pressurizing gas flows quickly towards vapor-liquid interface,and the surface liquid absorbs more heat through convection. Because the heat absorbed by surface liquid is larger than the total heat which is used to improve surface liquid temperature and absorb by bulk liquid, so LH2 is vaporizing at the vapor-liquid interface. And the surface liquid temperature rising decreases the heat transfer with pressurizing gas and increases the heat transfer with bulk liquid, therefore, the vaporizing rate declines with time.While the radial injector and the hemisphere injector have opposite situations,most of the pressurizing gas firstly mixes with the ullage, then, the mixture gas moves towards the tank wall and finally moves along the wall towards the liquid surface. So the ullage absorbs more heat from the pressurizing gas to improve its own temperature and the convective heat transfer would decrease between pressurizing gas and surface liquid. Based on the energy conservation, the ullage region, liquid region and tank wall absorb 62%, 12%, and 26% of the total energy addition of the tank with the radial injector separately.While the ullage region,liquid region and tank wall absorb 52%, 39%, and 9% of the total energy addition of the tank with the straight pipe injector separately. The proportion of total energy absorbed by the ullage is approximately equal, so the pressurized process with the hemisphere injector or the radial injector basically remains the same.4Actually, in the liquid rocket design, the pressurizing gas should inject slowly into the tank,distribute uniformly in the ullage and avoid directly towards the vapor-liquid interface.42,43Therefore, we can conclude that the injector types have great influences on pressurizing process, and the injector which injects the pressurizing gas away from the vapor-liquid interface can pressurize faster and save the mass of pressurizing gases.
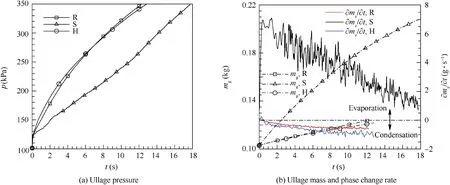
Fig. 13 Variation of parameters with time during pressurizing with different injectors.
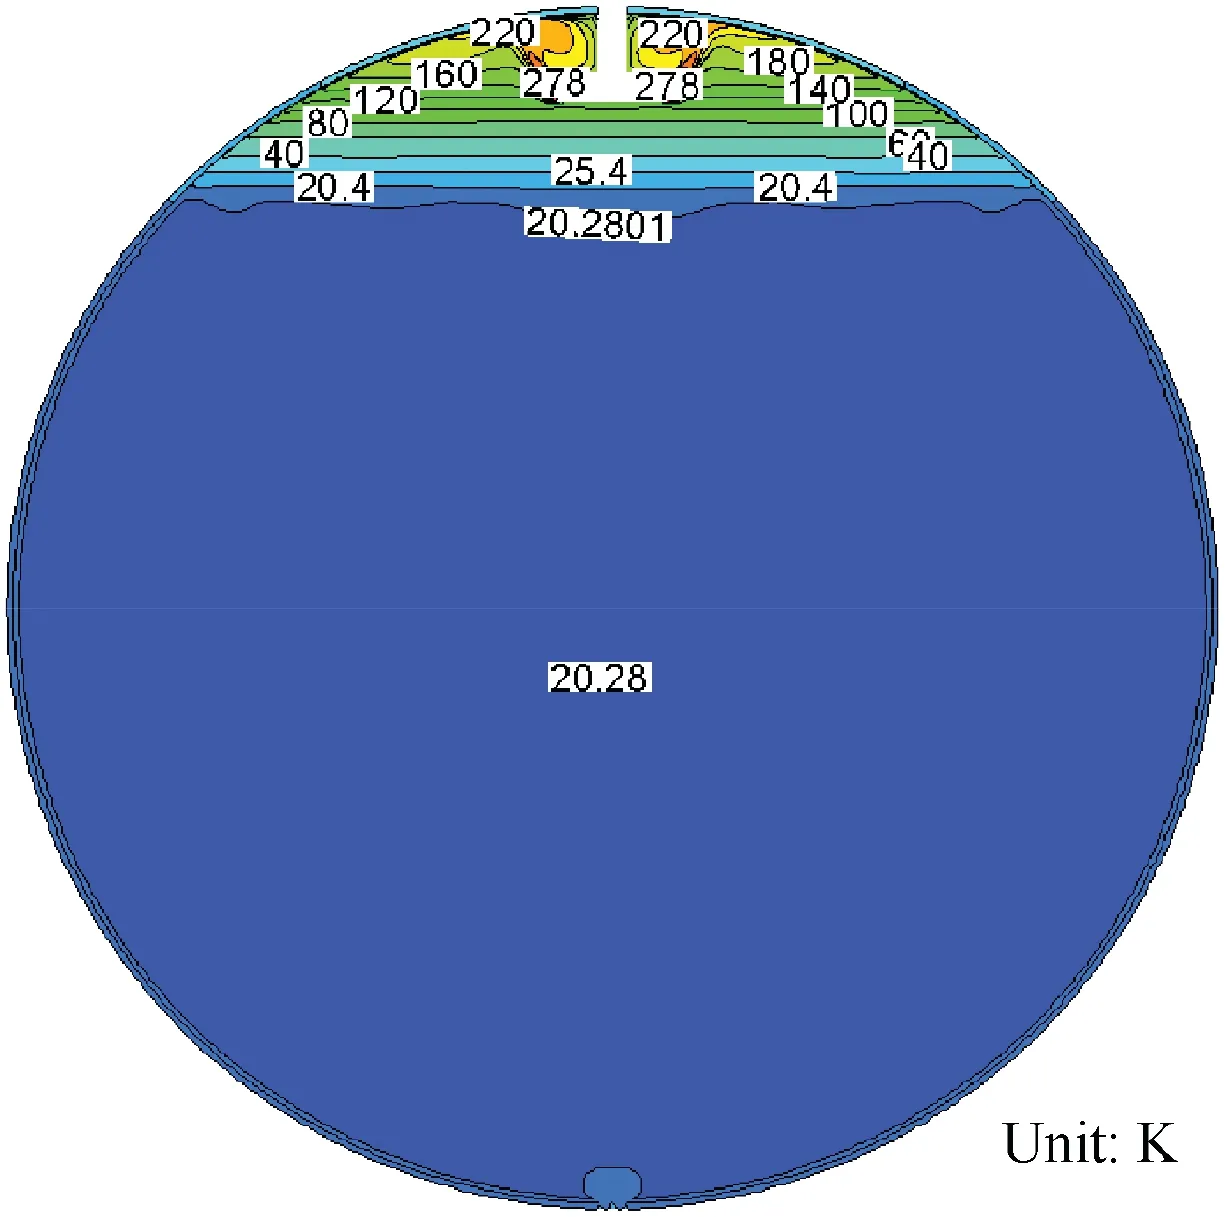
Fig. 14 Contours of temperature distribution with radial injector tank at 12.24 s.

Fig. 15 Contours of temperature distribution with straight pipe injector tank at 17.73 s.
5.5. Effect of pressurizing gas species
Due to the hydrogen's low saturation temperature and flammability, the LH2 tank is usually pressurized by GH2 or GHe. To study influences of pressurizing gas species on pressurization process,we maintain all parameters the same except the pressurizing gas species.Fig.17(a)gives the ullage pressure variation with time. When the LH2 tank is pressurized by GHe, the ullage pressure increases quickly with time before 12 s,then the ullage pressure rising rate remains approximately about 2.178 kPa/s after 12 s. During the whole pressurizing process,GHe pressurization will result in lower ullage pressure compared with GH2 pressurization. The pressurizing time requirement is 12.8 s and 70 s respectively for GH2 pressurization and GHe pressurization when the ullage pressure reaches to 349 kPa. Because the inlet mass flow rates of GHe and GH2 are equal,the GHe pressurizing mass consumption is 5.47 times the GH2 pressurizing mass consumption.Considering that the ullage pressure rising rate in the tank mainly depends on temperature rising and mass adding.Fig. 17(b) gives the ullage mass and phase change rate variation with time. Compared with GH2 pressurization, the condensing rate of LH2 during GHe pressurization is suppressed, even LH2 net vaporizing takes place after 38 s and the net evaporation phenomenon agrees as Refs.9,10illustrate. Therefore, the ullage mass of GHe pressurization increases more quickly than the ullage mass of GH2 pressurization. Fig. 17(c) shows that the average temperature rising pressure rising rate is mainly determined by mass addition and temperature rising before 12 s, then mass addition is the main factor for the ullage pressure rising rate,and the temperature rising has great effects on the ullage pressuring than mass addition during GHe pressurizing.Fig.18 gives the mass fraction of GHe distribution within the LH2 tank.Without regard for GHe dissolving in the LH2, GHe is mainly concentrated near the hemisphere injector region and tank wall, and the mass fraction of GHe near the vapor-liquid interface is less than 0.5.

Fig. 17 Variation of parameters with time with different pressurizing gases.
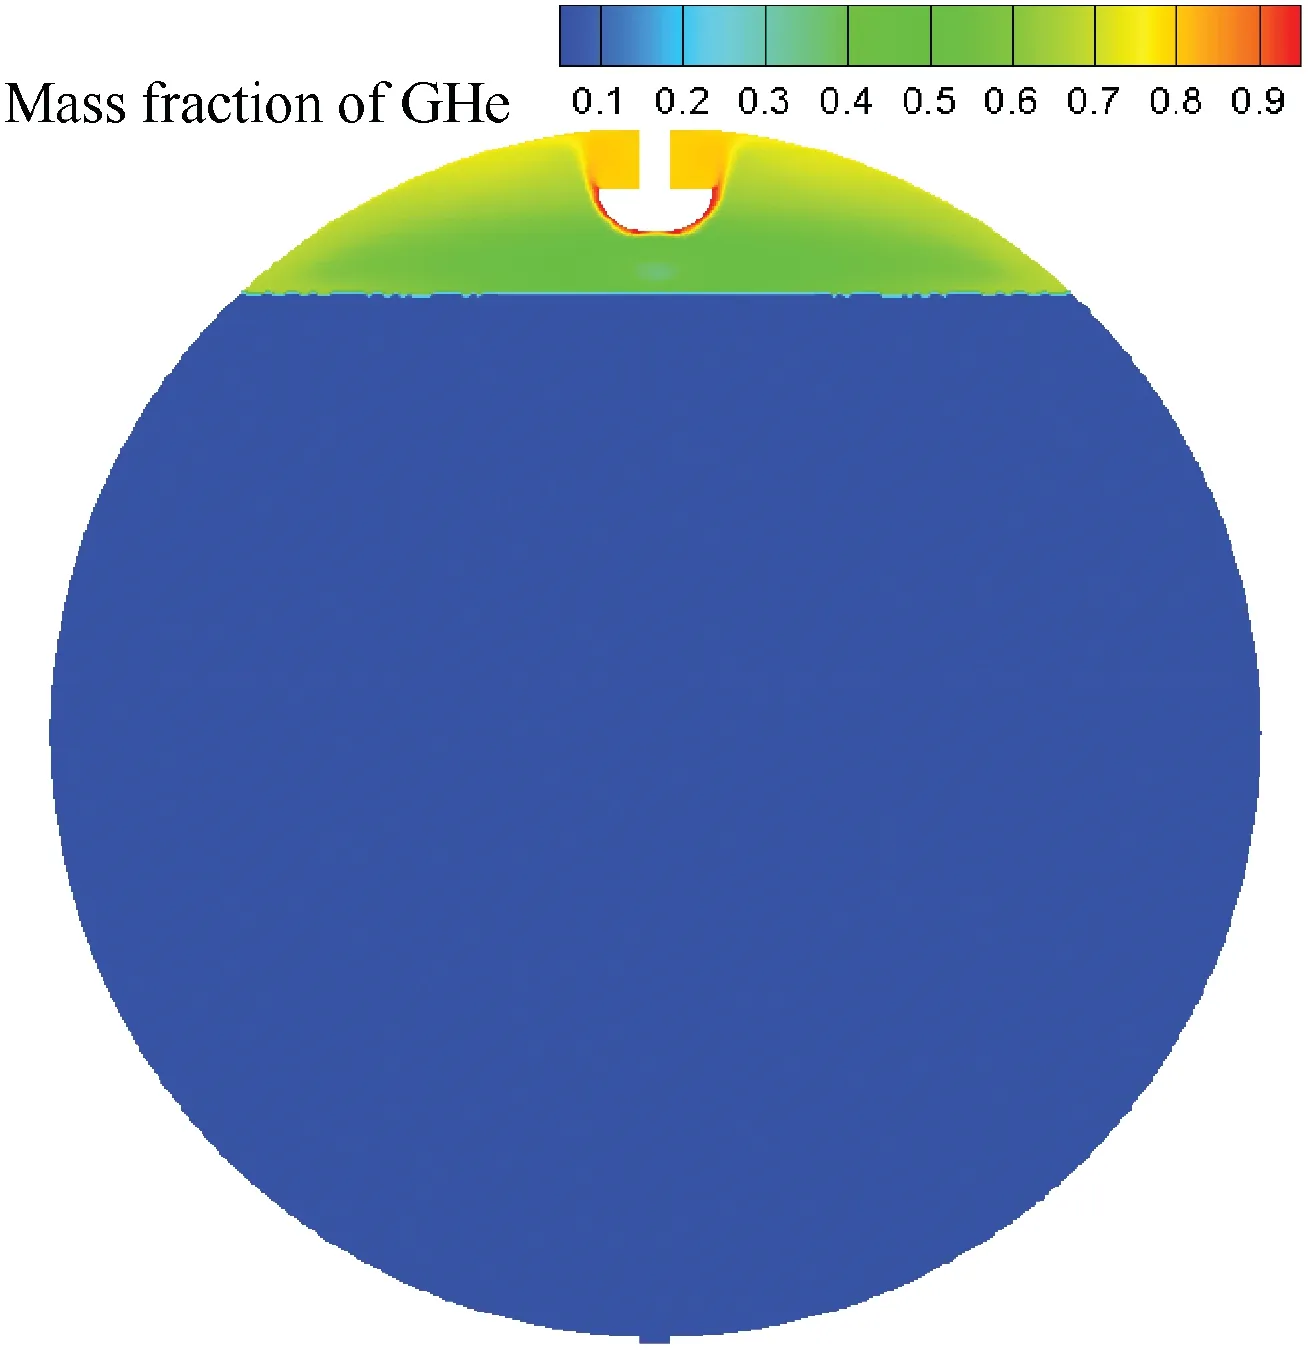
Fig. 18 Mass fraction of GHe distribution within LH2 tank when pressurization ends.
Based on analyzing the simulation results above, the GHe pressurization has significant differences from GH2 pressurization for the LH2 tank because of the different physical properties between hydrogen and helium. Because the molar weight of helium is two times the molar weight of hydrogen, the inlet mass flow rate of helium molecules is only half the inlet mass flow rate of helium molecules. Only considering the effect of molecular numbers, the pressurizing gas of helium pressurization needs two times than the pressurizing gas of hydrogen pressurization.44In actual,the mass diffusion and specific heat are also the key reasons why GHe pressurizing shows great difference with GH2 pressurizing. GH2 has a larger specific heat than helium and more heat can be carried into by GH2 to raise the ullage temperature.Furthermore,GHe pressurizing would decrease the GH2 partial pressure within the ullage, and to maintain the saturation state near vapor-liquid interface, the condensing rate would decrease and LH2 even should vaporize to improve the hydrogen molecular numbers. This means that the mass diffusion has positive effect on improving the ullage pressure rising rate. Above all, conclusions can be acquired that GH2 pressurization is more effective than GHe pressurization and GH2 pressurization could save the mass of pressurizing gas and shorten the pressurizing time interval.
6. Conclusions
rate of GHe pressurization is lower than GH2 pressurization.The average ullage temperature of GHe pressurization firstly increases with time, and then remains almost stably at 44 K after 12 s. The average ullage temperature is close to the adiabatic ullage temperature which is 46.3 K in 1-D model in Ref.6. Combining with analysis of Fig. 17(b) and 17(c), the ullage
A CFD model is established to calculate the mass and heat transfer performance of a NASA's LH2 tank during pressurizing and the key factors affecting the pressurizing process are analyzed. Several valuable conclusions are acquired for this tank as follows.
(1) Comparing with the NASA's pressurizing experiment,the CFD model proves that only 3.0%, 7.5% and 4.0% deviations exist in predicting the mass of pressurizing gases, the net mass of phase change and the average ullage temperature respectively when the ullage pressure increases from 101.325 kPa to 349 kPa.
(2) During pressurizing with the hemisphere injector, the average bulk liquid temperature is remaining approximately constant but the axial temperature stratification is produced in surface liquid region and ullage region.The main behavior of phase change is condensation and more than 60%of total energy addition of the tank is absorbed by the ullage.
(3) During pressurizing with different inlet temperatures,the pressurizing gas with high inlet temperature can reduce the pressurizing gases mass consumption and shorten the pressurizing time interval. About 8% pressurizing gas mass can be saved by increasing per 20 K of inlet temperature of the pressurizing gas.
(4) During pressurizing with different inlet mass flow rates,the decreased times of the pressurizing time interval is higher than the increased times of the inlet mass flow rate of pressurizing gas. When the inlet mass flow rate is below a certain value, the pressurizing time would be elongated remarkably and even lost the pressurizing effect.
(5) During pressurizing with the hemisphere injector, radial injector and straight pipe injector, 60%, 62% and 52%of the total energy addition of the tank are absorbed by the ullage region separately, 17%, 12% and 39% of the total energy addition are absorbed by the liquid region separately, and the rest of the total energy addition are absorbed by the tank wall. The proportion of the total energy addition absorbed by the ullage determines the ullage temperature rising rate, meanwhile, the ullage temperature rising has a stronger influence on the ullage pressure rising rate than the ullage mass addition. So the radial injector has the highest pressurizing efficiency and the straight pipe injector has the worst pressurizing efficiency.
(6) GH2 pressurization has a higher efficiency than GHe pressurization, that is, GH2 pressurization would have a faster ullage pressure rising rate than GHe pressurization and the ratio of total gas mass of GHe to GH2 is higher than the ratio of molecular mass of GHe to GH2.
杂志排行

CHINESE JOURNAL OF AERONAUTICS的其它文章
- Heading control strategy assessment for coaxial compound helicopters
- An adaptive integration surface for predicting transonic rotor noise in hovering and forward flights
- An algorithm to separate wind tunnel background noise from turbulent boundary layer excitation
- Leakage performance of floating ring seal in cold/hot state for aero-engine
- Six sigma robust design optimization for thermal protection system of hypersonic vehicles based on successive response surface method
- An active damping vibration control system for wind tunnel models