Experimental and Numerical Studies of Aerodynamic and Aeroacoustics Characteristics of Cooling Fan in Traction Motor*
2019-07-23XiaoyunQuJieTianTongWang
Xiao-yun QuJie TianTong Wang
(School of Mechanical Engineering,Shanghai Jiao Tong University,Shanghai,China,200240,Email:twang@sjtu.edu.cn)
Abstract:The coaxial cooling fan of the traction motor is the necessary component for the safe operation of highspeedtrain. Due to the alternately moving direction of the train, the traction motor is designed at both positive rotationand reverse rotation.With the requirement of similar performance of the centrifugal cooling fan, symmetrical case andstraight blade structure is designed for the product. Therefore, the aerodynamic characteristics of the cooling fan arerelatively not good, which results in relatively high aerodynamic noise as compared to the conventional fans. In order tostudy the aerodynamic characteristics and aerodynamic noise, the model of a special motor fan was established. 3Dnumerical simulation of the model was carried out at different rotating speeds. The acoustic analogy method is used toanalyze the noise of the centrifugal cooling fan, and the validity of the method is verified. In addition, the operatingnoise of the cooling fan in the traction motor was tested in the semi-anechoic room. The results show that: correspondingto the different rotating speeds, the flow characteristics at the motor outlet is similar; with the increment of the rotatingspeed, total sound pressure level is increasing linearly. The simulation results provide the velocity distribution in the fanand find the maximum noise sources strength. From the testing results, the noise problem can be understood better andthe structure of the centrifugal cooling fan can be improved to reduce the aerodynamic noise, especially at high rotatingspeed conditions.
Keywords:Centrifugal Cooling Fan,Traction Motor,Acoustic Analogy Method,Aerodynamic Noise Test,Velocity Measurement
Nomenclature
BPFBlade pass frequency/Hz
εDissipation of k(/m2/s3)
kTurbulent kinetic energy(/m2/s2)
INoise source strength(/kg/m/s2)
LpSound power levels/dB
△pStatic pressure rise/Pa
PaAtmospheric pressure/Pa
SPLSound pressure levels/dB
tTime/s
tijStress tensor
TijLighthill tensor
U2Circumferential velocity/(m/s)
VAbsolute velocity/(m/s)
vnNormal velocity of the surface/(m/s)
φDimensionless velocity coefficient
ρDensity fluctuation/(kg/m3)
ΨstStatic pressure coefficient
γRelative sources strength ratio
δDirac delta function
0 Introduction
High-speed trains are very popular in many countries,especially China,which has world's largest high-speed rail network[1].A lot of heat is generated in the traction motor of a high-speed train,so a centrifugal fan is used for the cooling of the traction motor.To ensure the safety and comfort of high-speed trains,more and more attention is paid to improve the performance of cooling fans[2].If the traction motor is not cooled effectively,the temperature of traction motor will seriously affect the traction motor performance or even can cause failure.Therefore,it is necessary to consider whether the aerodynamic performance of the cooling fan meets the requirements of the high-speed train[3].As the train is designed to move in both directions,the traction motor is also designed to rotate in both directions,so does the coaxial motor cooling fan.Symmetrical case and straight blade structure is designed to get the similar performance of the fan in both rotational directions.Therefore,the aerodynamic characteristics of the cooling fan are not as good as that of the general products,which might result in the relatively higher[5].It's also difficult to test fan performance because of the complexity of the system.With the rapid development of computer technology and computational fluid dynamics,the aerodynamic performance of the cooling fan can be simulated by CFD method,and the flow characteristics of the impeller can be analyzed to identify the source of aerodynamic noise[6].
With the fierce competition in the market,the technical content of the product is getting higher and higher.With the development of new high-speed trains,a large number of advanced technologies and electrical equipment are being used[7-8].Therefore,more precise requirements for ventilation,cooling and comfort are put forward.But,a little research is done on the cooling fan at the present.
In order to analyze the cooling fan aerodynamic performance and aerodynamic noise,CFD numerical simulation was performed on full three-dimensional fan model with impeller-case clearance.The acoustic analogy method was also used to analyze the noise of the centrifugal cooling fan and the aerodynamic noise test system was set up.In addition,the operating noise of the cooling fan in the traction motor was tested in the semi-anechoic room.This study provide the basis for the design of cooling fan of high-speed train.Therefore,it can be applied to optimize aerodynamic performance and reduce noise.
1 Research Object
A traction motor used in the high-speed train is illustrated in Figure 1.The traction motor is a four pole alternating current motor.It consists of two parts,motor and cooling fan,in which the air inlet is on the motor side,as shown in Figure 1.Air flows into the inlet and passes through motor inside the rotor and stator,takes away heat and generated by the centrifugal cooling fan.A centrifugal cooling fan installs in the motor shaft near the outlet and rotates the same speed as the shaft,which impels the heated airflow out of the motor.The blade is a typical straight blade in order to take into account the operation requirements of the positive and reverse rotation.
Aeroacoustics noises of the traction motor comes primarily from the cooling fan(the centrifugal fan and case).So we focus on the cooling fan instead of the entire traction motor to reduce computational cost.A 3D model of the interested fluid domain(enclosure of the impeller)is prepared for CFD simulation of the fan,as shown in Figure2.
Fig.2 provides an overview of the traditional model and full 3D model which consists of 5 parts:inlet region,fan impeller,front cavity,back cavity and case.The key geometric parameters of the impeller are listed in Tab.1.
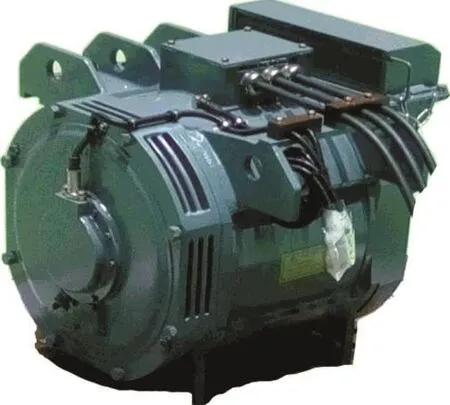
Fig.1 Ahigh-speed train traction motor

Fig.2 The computational domain of cooling fan model
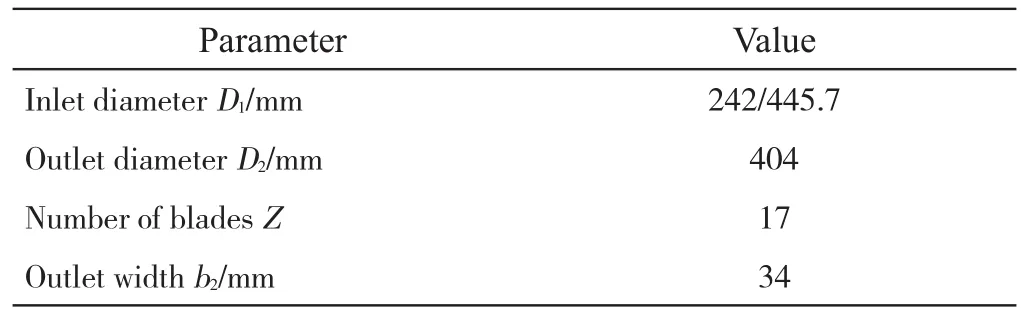
Tab.1 Parameters of the impeller
2 Research Methodology
2.1 Numerical Simulation Methods
With the rapid development of computer technology and computational fluid dynamics,the three dimensional compressible viscous flow calculations are widely used in turbomachinery.And the energy index(efficiency,power)and visualization of flow field(pressure distribution,velocity distribution and streamline distribution inside each part)can be obtained.So it is easy to find out the irrationality of model design and provide an effective and reliable basis for the performance optimization of fluid machinery.It can reduce the workload of the experiment and the cost.So the design efficiency is improved.In this paper,the centrifugal cooling fan of traction motor has been numerically simulated.
The simulated flow field is the centrifugal cooling fan of high-speed train traction motor,including the inlet section,impeller,and casing,which were used in the traditional numerical calculation model(shown in Fig.2(a)).To get more accurately simulation results of cooling fan,full 3D model with impeller-casing clearance(the front and back cavity)was considered in the computational model(shown in Fig.2(b)).Considering the full development of inlet flow,the length of inlet was extended five times of the impeller diameter in the traditional model and full 3D model.Full threedimensional model and grids were adopted(shown in Fig.3(a),(b)),which were created in ANSYS ICEM-CFD and consist of hexahedral and tetrahedral grids with a layer of 10 nodes close to the wall[9].ICEM-CFD was used to generate structured hexahedral grid for inlet.The structure of other flow components is very complex,so the adaptive tetrahedral unstructured mesh is adopted with boundary layer y+≤100.Then the mesh was assembled[10].The computational model of whole cooling fan mesh can be seen in Fig.3.Figure.3(c)is the test points of the outlet velocity of the casing.
A grid independent test of traditional fan mode's dimensionless performance was performed.It is found that when mesh numbers are around six million eight hundred and ten thousand,the variation of static pressure coefficient is within 0.3%indicated in Fig.4.The final grids number of inlet,impeller,casing and total number are 1213436,2806759,2789043 and 6809238 respectively.The dimensionless coefficient is defined as follows,
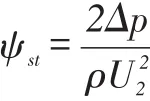
Where△p is static pressure rise of cooling fan,U2is circumferential velocity and ρ is the density of air.

Fig.3 The grid of cooling fan model
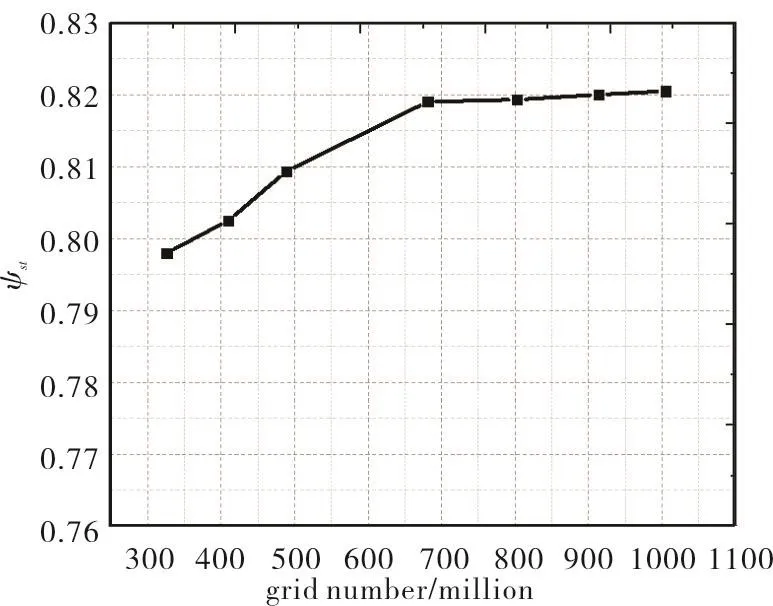
Fig.4 Grid-independent curve of traditional model
In order to save computing resources and time,the grid of full three-dimensional model is obtained,which is based on the grid generation of traditional fan model.The numbers of grids of the different computational domains are as follows:inlet,1213436;impeller,2806759;the front cavity,1578010;the back cavity,843101;and casing 2789043.Thus,the total number of grids is 9228349.
The simulations reported in this paper were performed with the commercial code ANSYS CFX v16.0 for turbulence modeling.It was carried out by a steady state,implicit,finitevolume based on compressible solver and k-ε model with standard wall functions was used to model turbulence.Considering the cooling fan was directly connected with the traction motor,the inlet duct structure was very complex,and the air temperature at the inlet would rise due to the heating of the traction motor.The inlet of cooling fan would have loss of wind pressure.Considering the inlet resistance loss of cooling fan is 695Pa at 1800rpm.Corresponding to the inlet resistance loss of cooling fan is 4780Pa at 4800rpm.Therefore,the total pressure and total temperature was set at the inlet,whereas static pressure was imposed at the casing outlet[11].The walls were adopted a rotating wall,which are in contact with the impeller.Other wall boundary conditions were set to no-slip wall.The convergence criterion was 10-5,the transmission medium was at 25℃air.The advection scheme was set to high resolution.
2.2 Acoustic Analogy Methods
Aerodynamic noise results from the propagation of disturbances through a compressible fluid(usually air),caused by the impeller or the fluid at some point in time and space[11].In the context of a CFD calculation,aerodynamically generated noise is of primary interest[9].Aerodynamic noise consists of discrete and broadband noise in the fan[17].Discrete noise is generated by periodic pressure fluctuation associated with fan rotating speed,including rotor-stator interaction between potential flow and wake,periodic vortex shedding,etc.[18].Broadband noise is induced by the turbulent flow[19].

Generally,at low Mach number(Ma<0.4),aerodynamic noise can be calculated from the flow field using FW-H Equation[21]:where Tijis the Lighthill tensor and ρ'is the density fluctuation with respect to the ambient condition.The Lighthill tensor has three components and is given by:

where the first term is the instantaneous Reynolds stress and τijis the stress tensor(normal,including pressure,and shear components).
A generalized version of the Lighthill equation that represents the three possible noise sources was first presented by Williams and Hawkins as follow:

where δ(f)is the Dirac delta function describing the moving surface geometry(fnon-zero in the fluid region and zero at the moving boundary),υnis the normal velocity of the surface,and τijis the fluid stress tensor given by:

The first term on the right-hand side of Equation(3)represents the monopole sources.The second term represents the dipole sources.The third term represents the quadrupole sources[9].
The noise analysis is based on CFX fan noise analysis.CFX uses Lowson Equation[22],which is developed from Lighthill Equation by taking into account the movement(velocity and acceleration)of noise source and interaction between fluid and moving surfaces.Based on CFD results,CFX is able to calculate the aerodynamic forces on the blades and obtain the noise sources.Then the propagation path is computed between the source and the observer for SPL at locations of interest[23].
2.3 Measurement Methods
The experiments were carried out at the pneumatic semi anechoic chamber of the civil aviation engine testing and verification center of Shanghai Jiao Tong University.The ground is made of cement floor.The net space of anechoic chamber is 21.13m×15.90m×9.65m(length×width×height),the cut-off frequency is 100Hz,and the background noise is less than 20dB.During operation,the traction motor product is placed on the ground iron support in the anechoic chamber.
The noise measurement is based on“GB/T2888-2008 method of noise measurement for fan and Roots blower”[24].According to the actual structure and exhaust situation of the motor,a new test outline is set up,such as the measuring points shown in Figure 5.
There are eight measuring points around the cooling fan.The measuring points include six measuring points on the fan outlet side of the P1to P6.And motor inlet side of the axial two measuring points(P7to P8).The height of measuring points is 1m from the ground.8 measuring positions are placed in four different directions,with a pair of points in each direction:namely P7and P8,P2and P5,P1and P4and P3and P6.Two positions of each pair are placed at 1 m and 2 m away from the traction motor.The microphone at the measuring point is fixed by the tripod,the height and direction of the microphone can be adjusted.

Fig.5 Noise measuring positons
3 Results and Discussions
3.1 Flow field analysis
Figure 6 presents velocity distribution of case outlet at 1800rpm.It is found that the CFD results are higher than the experimental test.The velocity distribution of casing outlet is higher than the experimental data.From the Figure 6(a),(b),(c),it can be seen that the velocity distribution of the three channels of each passage is not uniform,the velocity of the middle side and near shroud side is greater than that of the side of the hub.The hot wire was applied in the laboratory to obtain the velocity.But it can't to obtain the direction of velocity.So as shown in black dashed circle of the Figure 6(a),(b),(c),there is a big error in the backflow region.
Compared with the traditional cooling fan model,the numerical results of the full 3D model are closer to the experimental results.It is necessary to consider the effects of impeller-casing leakage and the vacuum inlet condition in the simulated model to get its more accurate velocity distribution in flow field.
Fig.7(a),(b),(c)are a numerical result of a rotating speed of 4 800rpm.Comparing and analyzing the results rotating speed of 1800rpm,the dimensionless method is used to analyze the coefficient of velocity at the exit of three channels,

Where V is outlet velocity of channel,U2is circumferential velocity and φ is dimensionless velocity coefficient.
Compared the coefficient of velocity at low speed 1800rpm,it is found that the velocity coefficients of the exit of passage B and passage C are very consistent(shown in Fig.7(b)and(c)).But the velocity coefficient of the passage A is higher than the velocity coefficient of 1 800rpm at high rotating speed 4 800rpm(shown in Fig.7(a)),which shows that the passage A flow in the cooling fan is more turbulent.As shown in Figure 7,it can be seen that there is a backflow zone at the exit of casing in the rotating direction.And the effective flow region is about 60%.The velocity distribution of the three channels of each duct is not uniform.
3.2 Acoustic analysis
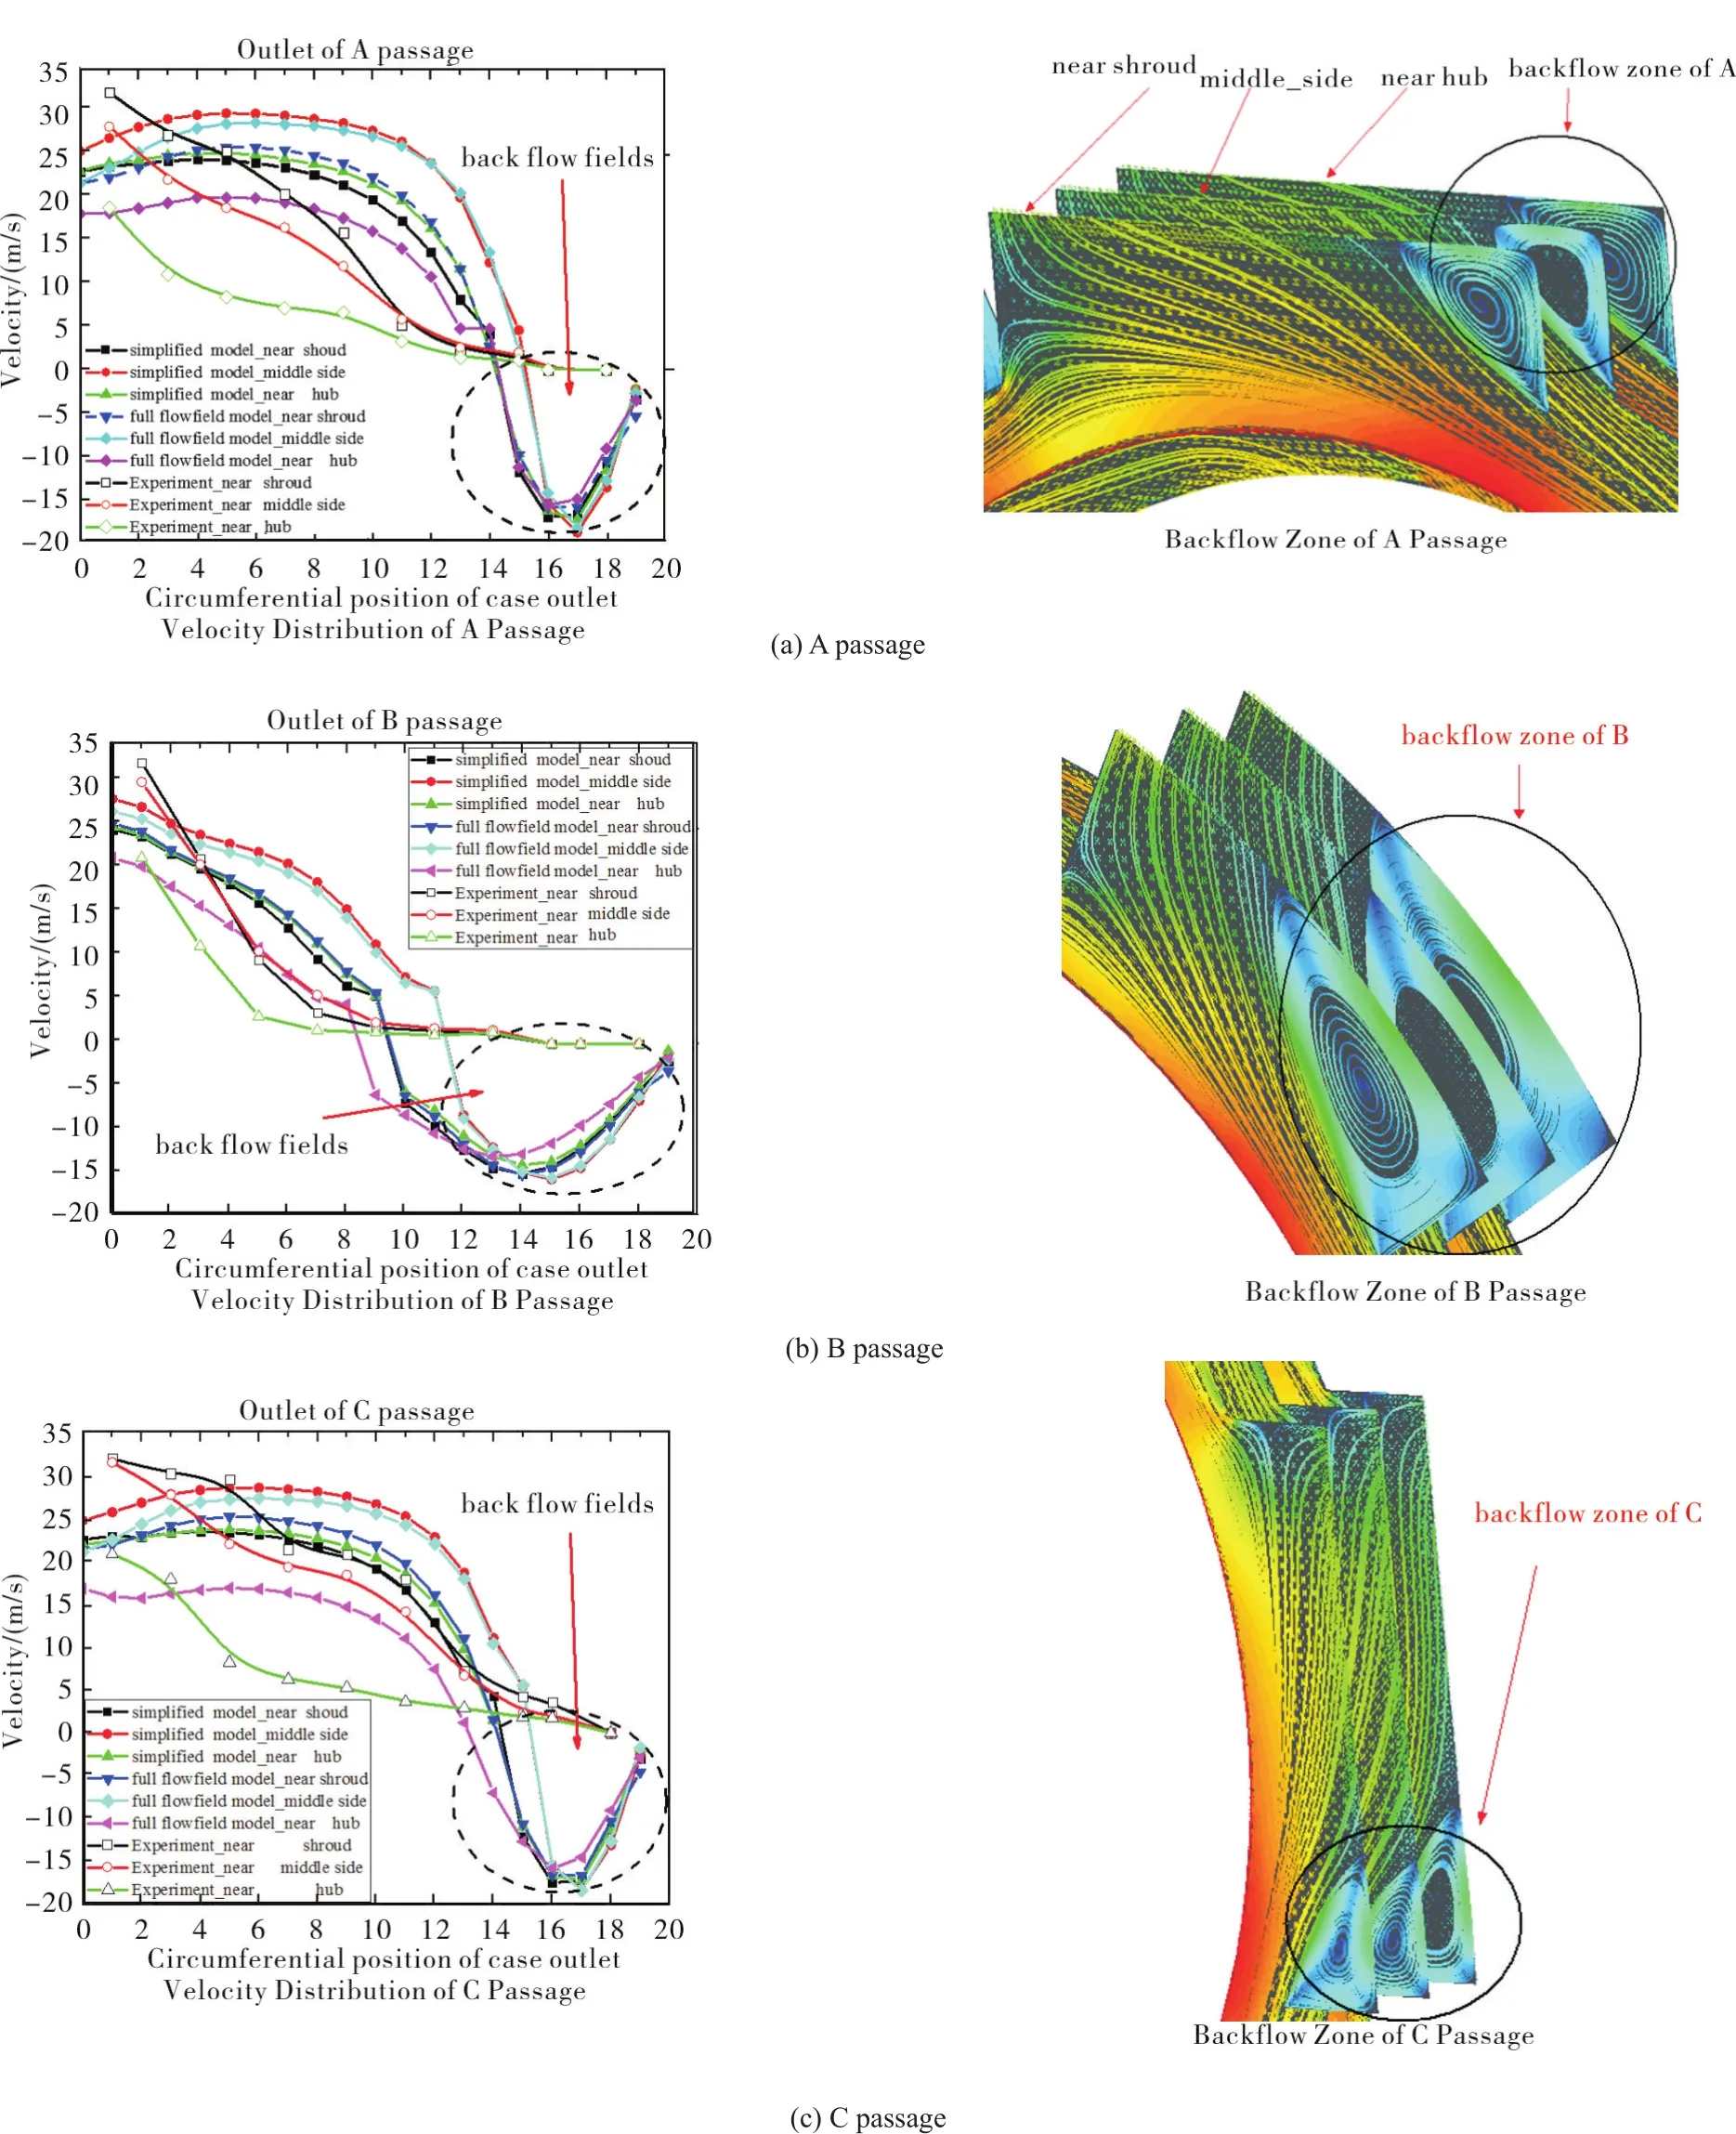
Fig.6 Velocity distribution of casing outlet at 1 800rpm
The cooling fan noise is measured using a B﹠K 4189 microphone at location 1m and 2m apart from the inlet and outlet of traction motor.The data of sound pressure level and spectrum are acquired at different rotating speeds(1200rpm,1500rpm,1800rpm,2100rpm,2400rpm,2700rpm,3000rpm,3300rpm,3600rpm,3900rpm,4200rpm,4500rpm,4 800rpm).
Figure 8 shows A-weighted sound pressure level at 13 rotating speeds from 1200rpm to 4800rpm at location 1 m and 2 m.It is observed that the sound pressure level is different in the different directions from the Fig.8.The sound pressure level at P5,P6and P4is higher than that at P7,while the sound pressure level at P4is slightly lower than that at P5and P6.The sound pressure level at the outlet of the cooling fan is higher than that at inlet.Same rule applies for the P1,P2,P3,and P8.
Along with the increase of rotating speed,different measuring points of A-weighted sound pressure level increased,and total sound pressure level is increasing linearly.For the same distance(at 1 meter or 2 meter),the total pressure has the same linear distribution law.
Comparison of the SPL at 1 m and 2 m in the same di-rection,as the distance increases in the same direction,the total sound pressure reduction.In addition,the trend of sound pressure change in each measuring point is close.It is also observed that the sound pressure level difference between two points of each pair is about 4~6 dB in general.
The P1position noise spectrum(Lp)at the speed of 1 800rpm,3 600rpm and 4 800rpm are shown in Figure 9.At 4 800rpm,the Lp is very high,which limited the increase of the vehicle speed.Therefore,in addition to the mechanical noise,the aeroacoustic noise needs to be analyzed further.

Fig.7 Dimensionless velocity coefficients at 1 800rpmand 4 800rpm

Fig.8 Relation between a-weight total sound pressure and the rotating speed
The noise spectrum consists of discrete frequency noise and wideband noise.Discrete frequency noise exhibits a series of sharp projections in the spectrum,also known as discrete tone noise,and discrete tone noise is generally associated with periodic excitation.The part outside the discrete frequency noise is wideband noise.The broadband noise covers a wide frequency range from low frequency to high frequency,and no obvious projection is observed on the spectrum in the frequency range.
At 4 800rpm,the 17-blades cooling fan in the traction motor has a Blade Passing Frequency(BPF)of 1 360Hz.The first 10 harmonics of the BPF is calculated,as shown in Fig.10.Sound Power Level Lp at base frequency is the highest among the 10 harmonics and Lp decreases with the growth of the harmonic order.Lp at the second order harmonics is over 10 dB lower than base frequency,which means that the second and higher order harmonics of BPF contribute little to the total discrete noise.At high rotating speed(4 800rpm),the discrete noise spectra is also obtained.Lp decreases with the growth of the harmonic order.Lp at the second order harmonics is over 10 dB lower than base frequency,which means that the second and higher order harmonics of BPF contribute little to the total discrete noise(as shown in Fig.10).

Fig.9 Spectrum Characteristic of Sound Pressure Level
Broadband noise is calculated and the sound intensity varies spatially inside the blower,as shown in Fig.11.Surface of 90%sound intensity indicates the locations with highest broadband noise.The highest broadband noise occurs around the area between front cavity and impeller near the shroud.

Fig.10 Discrete noise spectra
Comparing and analyzing the results the noise sources strength,the dimensionless method is used to analyze the relative strength ratio,

Where Pnoiseis noise source strength,Pais atmospheric pressure and γ is dimensionless relative sources strength ratio.
As is shown in Fig.12,the maximum monopole sources strength is 0.001 624 times the atmospheric pressure at 4 800rpm.Compared with the atmospheric pressure,the value is very small.Comparison of the relative noise strengths for dipole and monopole sources strength,the dipole source strength of the cooling fan is far greater than that of the monopole source strength.As from CFD noise source strength results,the dipole source strength of the cooling fan is far greater than that of the quadrupole source strength,and the monopole source strength is the smallest.Thus the main noise source is identified as dipole,indicating that the fluctuation of force on the surface is the main reason for the cooling fan noise.The spatial distribution of dipole is illustrated in Fig.12.The highest dipole strength is at the casing outlet along the rotating direction.
Monopole sources are related to the movement of the surface of the sources.Monopole sources strength is a function of the normal velocity of the surface.Thus the maximum monopole sources strength is direct correlation with rotation speed in the cooling fan.
The highest dipole source strength of the blade is on the pressure side of the blade near the tip of impeller,as is shown in Fig.13.It is observed that the maximum dipole source strength of the blade surface is 80%of the maximum dipole source strength of the cooling fan.
As is shown in Fig.14,it is found that the strength of the maximum dipole sound sources has a similar change rule at different rotating speeds with the change of inlet resistance and flow rate of the fan.With the increase of the inlet resistance of the fan,the intensity of the maximum dipole sound sources decreases linearly.However,with the flow rate increases of the fan,the maximum dipole source strength shows nearly linear increase.

Fig.11 Broadband noise isosurface at 90%sound intensity(in red)

Fig.12 Distribution of source strength

Fig.13 Distribution of dipole source strength ratio on blade
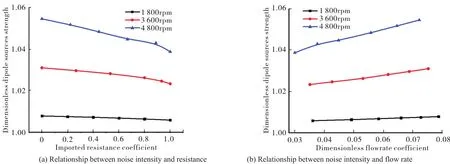
Fig.14 Distribution of the maximum dimensionless dipole source strength
4 Conclusions
In this paper,numerical and experimental results are presented for studying aerodynamic characters and aerodynamic noise of the cooling fan mounted in motor casing.The main conclusions are:
1)The flow characteristics of the cooling fan vary little at different rotating speeds.with the increase rotating speed,only a slight increase in the amount of value.The relationship between rotating speed and the outlet velocity are linear.There is a backflow zone at the outlet of case in the rotating direction.And the effective flow region is about 60%.The velocity distribution of the three channels of each duct is not uniform,and the velocity of the middle side and near shroud side is greater than that of the side of the hub.The non-uniformity of the velocity distribution leads to a local maximum velocity at the outlet of the cooling fan.
2)The sound pressure level at the outlet of the cooling fan is higher than that at inlet,which show that the maximum total sound pressure level at 45 degrees in the position close to the case outlet of cooling fan.The sound pressure level at different distance in the same direction is almost the same as the rotating speed change.As the distance increases in the same direction,the total sound pressure reduction.In addition,the trend of sound pressure change in each measuring point is close.As the distance is doubled,the sound pressure level decreases 4~6dB.
3)As the rotating speed increases,the outlet maximum velocity of cooling fan increased,there was a good linear relationship between the noise and the total sound pressure level.Considering the uneven velocity of the fan outlet,the improvement design should take place in terms of decreasing outlet velocity and increasing uniformity.
4)The dipole source strength of the cooling fan is far greater than that of the quadrupole source strength,and the monopole source strength is the smallest.Thus the main noise source is identified as dipole,with the flow rate increases of the fan,the maximum dipole source strength shows nearly linear increase.
Acknowledgements
The research work is supported by CRRC Zhuzhou Electric Co.,Ltd.

CALL FOR PAPER
The Fourth Chinese International Turbomachinery Conference(CITC 2020)
10~13 April,2020 Guangzhou,China
About CITC
CITC(Chinese International Turbomachinery Conference)is sponsored by the Chinese Journal of Turbomachinery which is a reference for Chinese and worldwide industry and research community.
CITC focuses on promoting both fundamental and engineering application and is of primary interest to researchers,engineers,students and users in the field of Turbomachinery.It is a key event for technology transfer through the presentation of the latest developments and best practices,with a specific focus concerning China.CITC is becoming a trendsetter conference outlining the roadmap to the future and will be known as one of the most cutting-edge meetings comprising all aspects of Turbomachinery.The conference has been established a platform for exchanging ideas and solutions,encouraging partnerships across academia and industry.
Scope
The scope of the conference is the theory,design,numerical simulations,experimental studies,experimental methods and applications in the field of turbomachinery.A large range of machines are covered such as compressors,blowers,fans,pumps,hydro turbines,steam and industrial gas turbines,expanders,refrigeration compressors and aeroengines.Papers are welcome relating to the following subject:
ⅠAerodynamics/Hydrodynamics
Numerical methods and advanced simulations
Experiments and measurements
Post-processing and analysis
Design and optimization
ⅡStructures and Systems Dynamics
Reliability analysis
Fatigue,vibration,fracture and life prediction
Rotor dynamics
Design and optimization
Bearings and seals(air bearing,magnetic bearing,dry gas seal……)
ⅢAeroelasticity and aeroacoustics
ⅣHeat transfer
ⅤManufacturing processes and new materials
ⅥFault diagnostics and maintenance
ⅦNew products and applicationsImportant Dates
Abstract submission deadline 20 September,2019
Notification of authors 10 October,2019
Full paper submission deadline 20 December,2019
Notification of authors 20 February,2020
Registration(Early Bird) By 20 March,2020
On-site registration 10April,2020
Conference date 11-13April,2020
Registration and Paper Submission
Registration and paper submission are directed to the website:http://conference.cftn.cn
Publication of Papers
Conference papers will be included in the Online Proceedings in the form of Open Access.Selected papers will be considered for Publication on a special issue of Proc.IME,Part A:Journal of Power and Energy(SCI index),to be edited by Peter Childs and Xavier OTTAVY.
Other selected papers will be published on the Chinese Journal of Turbomachinery.