Numerical study of MHD mixed convection under volumetric heat source in vertical square duct with wall effects
2019-07-08ZhiHongLiuMingJiuNiNinMeiZhngSchoolofEngineeringSciencesUniversityofChineseAcdemyofSciencesBeijingChin100190
Zhi-Hong Liu, Ming-Jiu Ni, Nin-Mei Zhng,* School of Engineering Sciences, University of Chinese Acdemy of Sciences, Beijing, Chin 100190
Keywords:Mixed convection Magnetohydrodynamic (MHD)Volumetric heat source
A B S T R A C TMagnetohydrodynamic (MHD) mixed convection under strong magnetic field and volumetric heat source for buoyancy-assisted flows are studied numerically in this paper. Blanket is one of key components for energy conversion in Tokamak fusion reactor. The physical model employed for simulations is refined from dual-coolant lead-lithium (DCLL) blanket. A magnetic-convection code based on a consistent and conservative scheme is developed with the help of finite volume method, and validated by some Benchmark analytical solutions. The flows inside duct with thermal insulating and electric conducting walls under exponential neutron volumetric heat source are simulated. Based on Boussinesq assumption, the influences of wall electrical conductivity and buoyancy on velocity fields, temperature distributions and Nusselt numbers are investigated. Results illustrates that the wall conductance ratio dominates the flow at low Grashof numbers and high wall conductance ratio, while buoyancy effect dominates the jet flow near side wall at a high Grashof number. In addition, the velocity along flow direction substantially impacts features of the Nusselt number and temperature distribution. Besides, the jet flow results in a higher Nusselt number and lower temperature.
The work is motivated by the design of liquid blanket in nuclear fusion reactors. Blanket is the one of the key components for energy conversion. Dual-coolant lead-lithium (DCLL) blanket is a helium-cooled ferritic structure with self-cooled LiPb breeder zone that uses SiCf/SiC insert as magnetohydrodynamic (MHD)and thermal insulator, and is one of the most competitive candidate blankets [1]. Flow channel insert (FCI) in blanket can reduce heat leakage from bulk flow into cold helium gas as well as MHD pressure drop [2]. Generally, the SiCf/SiC inserts have poor electrical conductivity. But the electrical conductivity of FCI would be increased when the FCI soaked in PbLi metal liquid for a long time. Wall effects of electrical conductivity of FCI is studied in this paper. The physical model employed in this paper (as shown in Fig. 1) is refined from the DCLL blanket model. The aim of this paper is to investigate the laminar fully developed mixed convection under strong magnetic field and volumetric heat source in a vertical duct with considering wall effects.
Buoyancy effects dominate the fluid flow in blanket because of the big neutron heat source generated in PbLi fluid, Grashof number can reach up to[3]. Lots of research about buoyancy effects have been conducted. Tagawa et al. [4] proposed an analytical solution for long vertical enclosure under magnetic field. Authié et al. [5] found that weak magnetic field can enhance heat transfer in a long enclosure when fluid flows transited from three-dimensional (3D) to quasi-two-dimensional(Q2D) flow. Chen et al. [6] analyzed the physical mechanism of transition of MHD flows from 3D to Q2D and gave more suitable relations among Nu, Ha, and Gr number, which extended much further than Authié et al. [5]. Jing et al. [7] analyzed the influences of different wall electrical conductivity and magnetic field direction on the natural convection in a cubic enclosure. According to the Richardson number, which expresses the importance of natural convection to the forced convection, the mixed convection is the main flow pattern in blanket. Abdou et al. [8]reviewed the key physical phenomena and recent developments in the DCLL blanket. They concluded that great progress has been made in the research of the forced convection in blanket,but study on mixed convection is still in its infancy. However, in recent decades, a good deal of fundamental research about mixed convection have been executed, such as, mixed convection in a channel studied by analytical and numerical methods[9, 10], a horizontal shallow cavity with heat source studied both analytically and numerically [11], buoyancy-driven convection in a horizontal cylinder analyzed analytically and experimentally [12, 13], benchmarks for MHD laminar, buoyancy convection, Q2D and 3D turbulence [14].
Compared to mixed convection caused by wall temperature difference and forced convection in DCLL blanket, the mixed convective flows caused by internal heat source has long been ignored. This situation has been changed in recent years. Vetcha et al. [15] derived Q2D approximate solutions for fully developed upward mixed convection related with transverse magnetic field and exponential volumetric internal heat source.Hudoba et al. [16] proposed a analytical solution of velocity in a vertical channel under uniform internal heat source and transverse magnetic field. An unsteady mixed convection flow behavior of a U-bend under volumetric heating and magnetic field on the tritium transports has been studied [17], the unsteady vortices are generated due to the influence of the buoyancy forces and the U-bend. Zhang and Zikanov [18] analyzed a horizontal duct under magnetic field, heated by a neutron volumetric heat source and cooled by constant temperature walls, their results suggested that turbulence and mixed convection effects make wall heat flux distribution more uniform. A downward vertical pipe with a half of heating wall and under a horizontal magnetic field was simulated [19], their simulations found and explained the anomalous high-amplitude temperature fluctuations which also observed in experiments [20, 21].
The model is a fluid region with a thin wall as shown in Fig. 1.The solid region is the thin thermal insulating and electric conducting square duct. The fluid region is surrounded by the solid duct, which size is,,along,,directions, respectively. In the present work, the geometry sizes are set to be,and, whereis wall thickness. Decay direction of the volumetric heat source is along Xaxis, and the external magnetic field is along Y-axis. The fluid flows upward along Z-axis with a uniform inlet velocityand uniform inlet temperature.
In DCLL blanket, PbLi fluid is heated by the volumetric heat source due to neutron reaction. An approximate expression of internal heating proposed by Smolentsev et al. [22] is shown in Eq. (1) and Fig. 2. Here,is the value of the maximum volumetric heat source,is the internal volumetric heat source.

The hot wall is used to represent the side wall near big heat source, and cold wall to represent the side wall near small heat source in this paper.
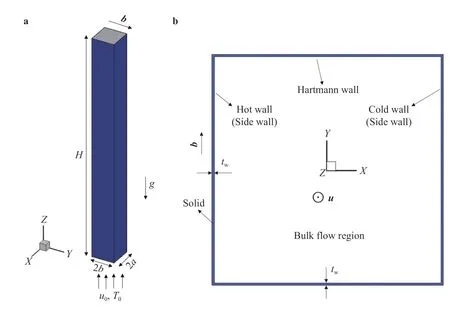
Fig. 1. Geometry of the square duct flows and thin wall: a 3D view, b vertical view
The working fluid in the duct is liquid metal PbLi. Even though the temperature difference of PbLi fluid is large in blanket, it is valid for the buoyancy's calculation in MHD simulations [4, 18, 19] according to the limitation of Boussinesq approximation [23]. Due to the magnetic Reynolds number is small enough, the induced magnetic field can be ignored in this research. Besides, the contribution of the Joule dissipation also is negligible in comparison with the internal heat source [16].
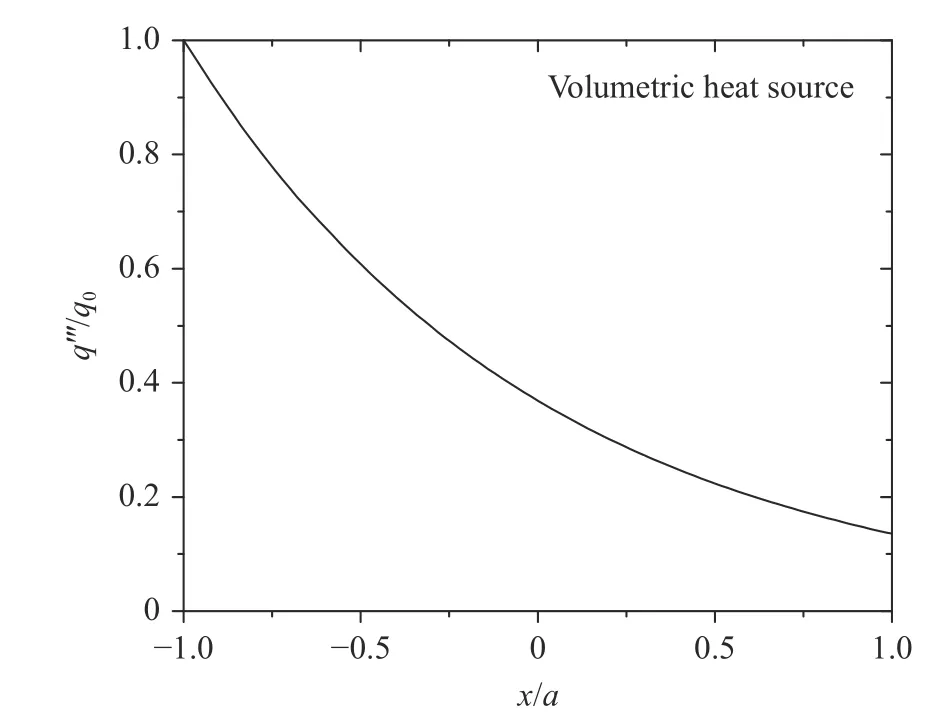
Fig. 2. Internal volumetric heat source of fluid region profile
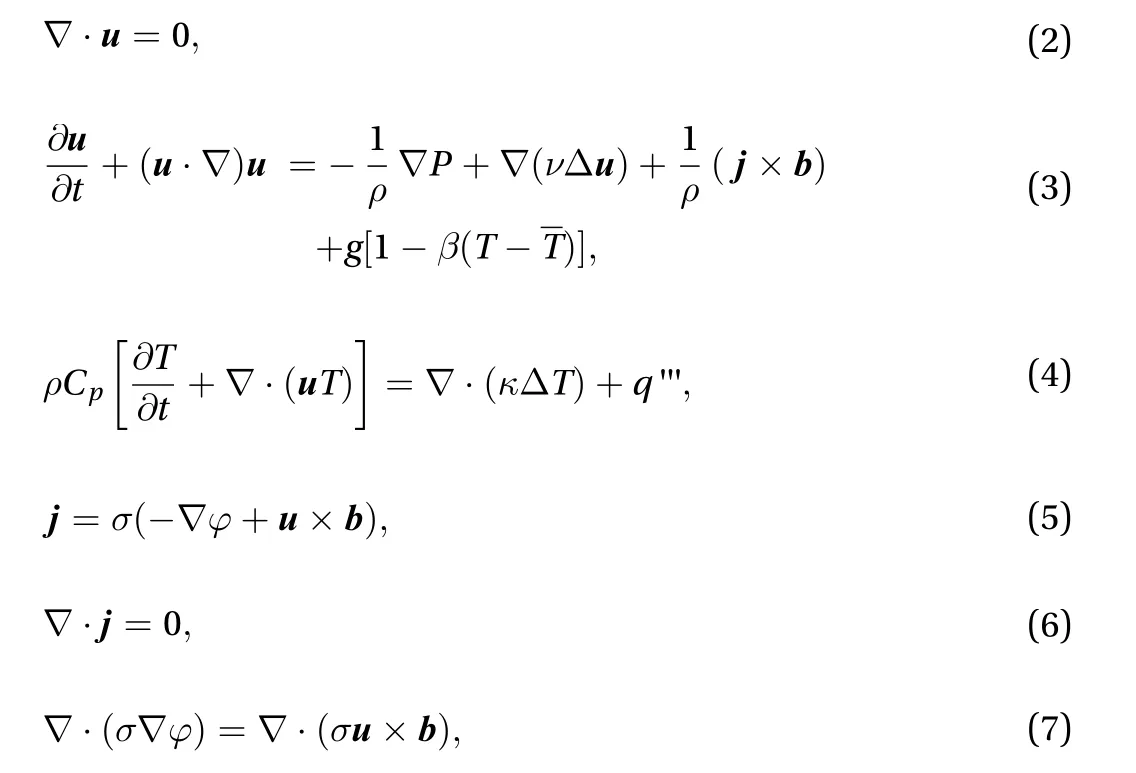
The governing equations used in this work, continuity equation, Navier-Stokes equation considering buoyancy and Lorentz force, energy equation, Ohm's law, electric current conservation equation, electric Poisson equation are shown below:wheredenotes the imposed magnetic field,the induced current density andthe electric potential. Besides,,,,,andare fluid density, kinematic viscosity, volumetric thermal expansion coefficient, specific heat capacity, inlet temperature and thermal conductivity, respectively.
The equations are non-dimensionalized using , , anlength, velocity, and temperature scales. The typical scales of time, pressure, and magnetic field ar, respectively. The non-dimensionalized equations are shown below:

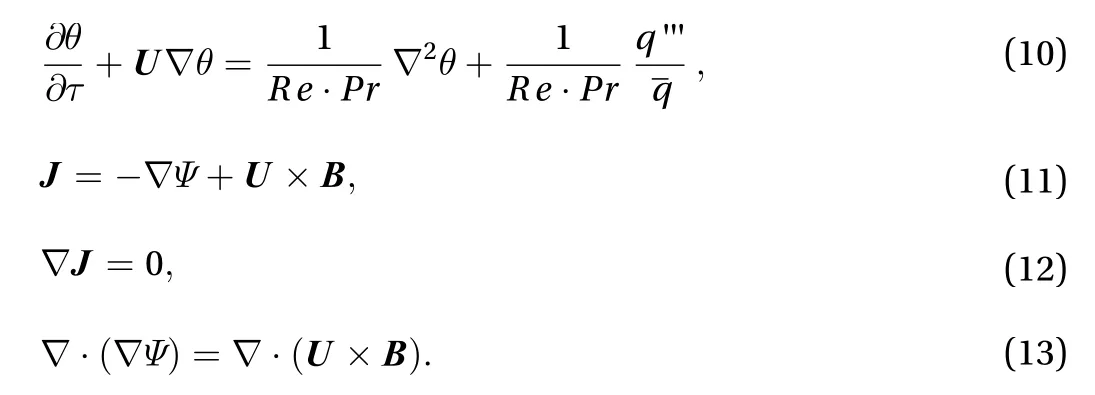
Here, are the non-dimensional fluid velocity vector, time, pressure, current density, magnetic field,temperature and electrical potential, respectively. The notations are defined as below:

The temperature T can be expressed by decomposing the temperature field into the meanand cross-axialcomponents:

The non-dimensional parameters are: the interaction parameterthe Reynold number the Hartmann number the Prandtl number , and the Grashof number
, where It should be noted that is increasing with number. is used in later simulation.
In the solid region, electric potential Poisson equation (Eq.(15)) is solved. As the wall is thermal insulation, energy equation is not considered.

The walls are assumed thermal insulated, electrical conductive and no-slip. At the inlet, uniform constant field are applied for velocity and temperature of metal fluid, that is,andBesides,andare applied. At the outlet,electric potential and pressure are fixed at zero. Besides,andare executed for fully developed flow.
On the interface between fluid and solid regions, for the thermal insulation, continuity of electric potential and current,the boundary conditions are given below:

The discretization of partial differential equations Eqs. (8) -(13) are second-order accuracy in both time and space. For the time terms, a Crank-Nicolson scheme is used. Central-difference formulas are applied for the diffusive terms in the Navier-Stokes equation (9) and energy equation (10). Several cases are simulated through the finite volume method and unstructured collocated meshes. The pressure-implicit with splitting of operators (PISO) method is employed to solve pressure Poisson equation. Lorentz force is calculated using the consistent and conservative scheme [24, 25] to guarantee satisfaction of the current conservation and momentum conservation. In order to describe the flow and heat transfer more precisely in boundary layers, at least 4 layers and 6 layers meshes are discretized in Hartmann layer and side layer, respectively.
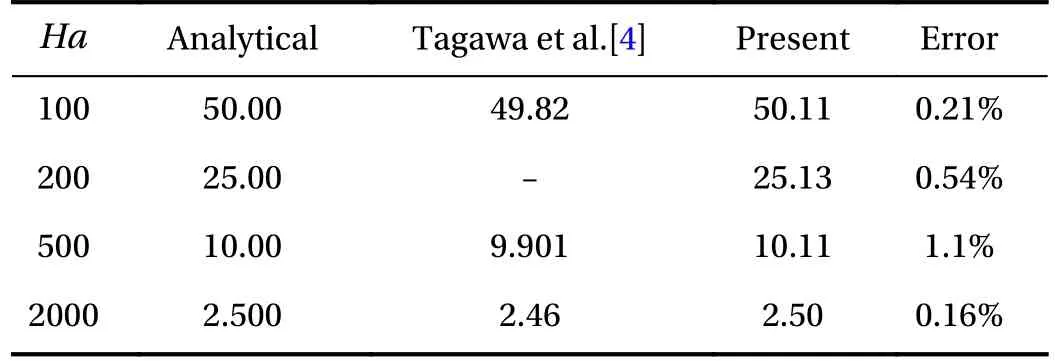
Table 1 Slope of perpendicular cases
MHD natural convection in a long vertical enclosure is simulated by use of the computational platform developed on the basis of finite-volume method (FVM). The numerical results are compared with the analytical solution [4]. Slope of non-dimensional velocityand temperature in enclosure core region is determined by and number, The analytical solution of perpendicular case is, while it isat parallel case. The comparison of analytical solutions with numerical results are listed in Tables 1 and 2. The relative errors show a good agreement between analytical solutions and present simulations.
Furthermore, a validation of exponentially volumetric heat source's effect is completed also. The numerical result is com-pared with the approximate solution derived by Vetcha [15].Grashof number is defined as .In the present simulation, Hartmann number and Reynold number are fixed at ,and different Grashof numbers , and are applied to investigate the mixed convective of MHD flows.
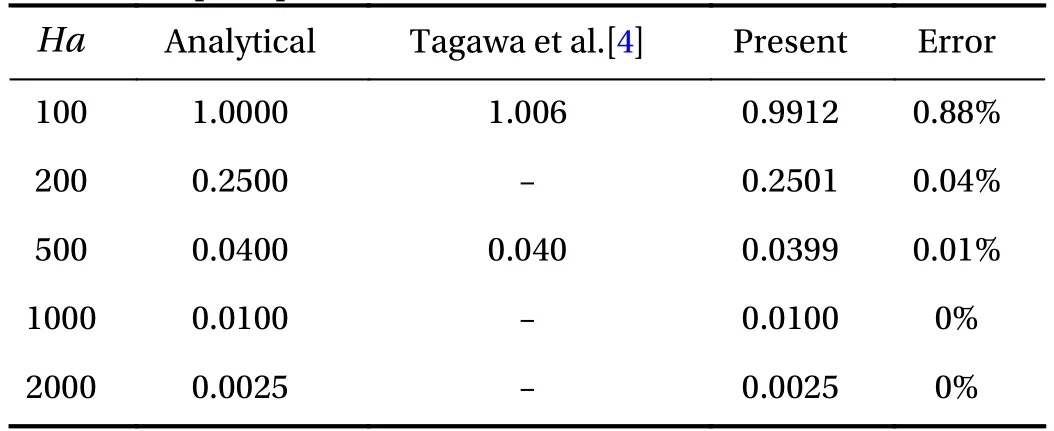
Table 2 Slope of parallel cases
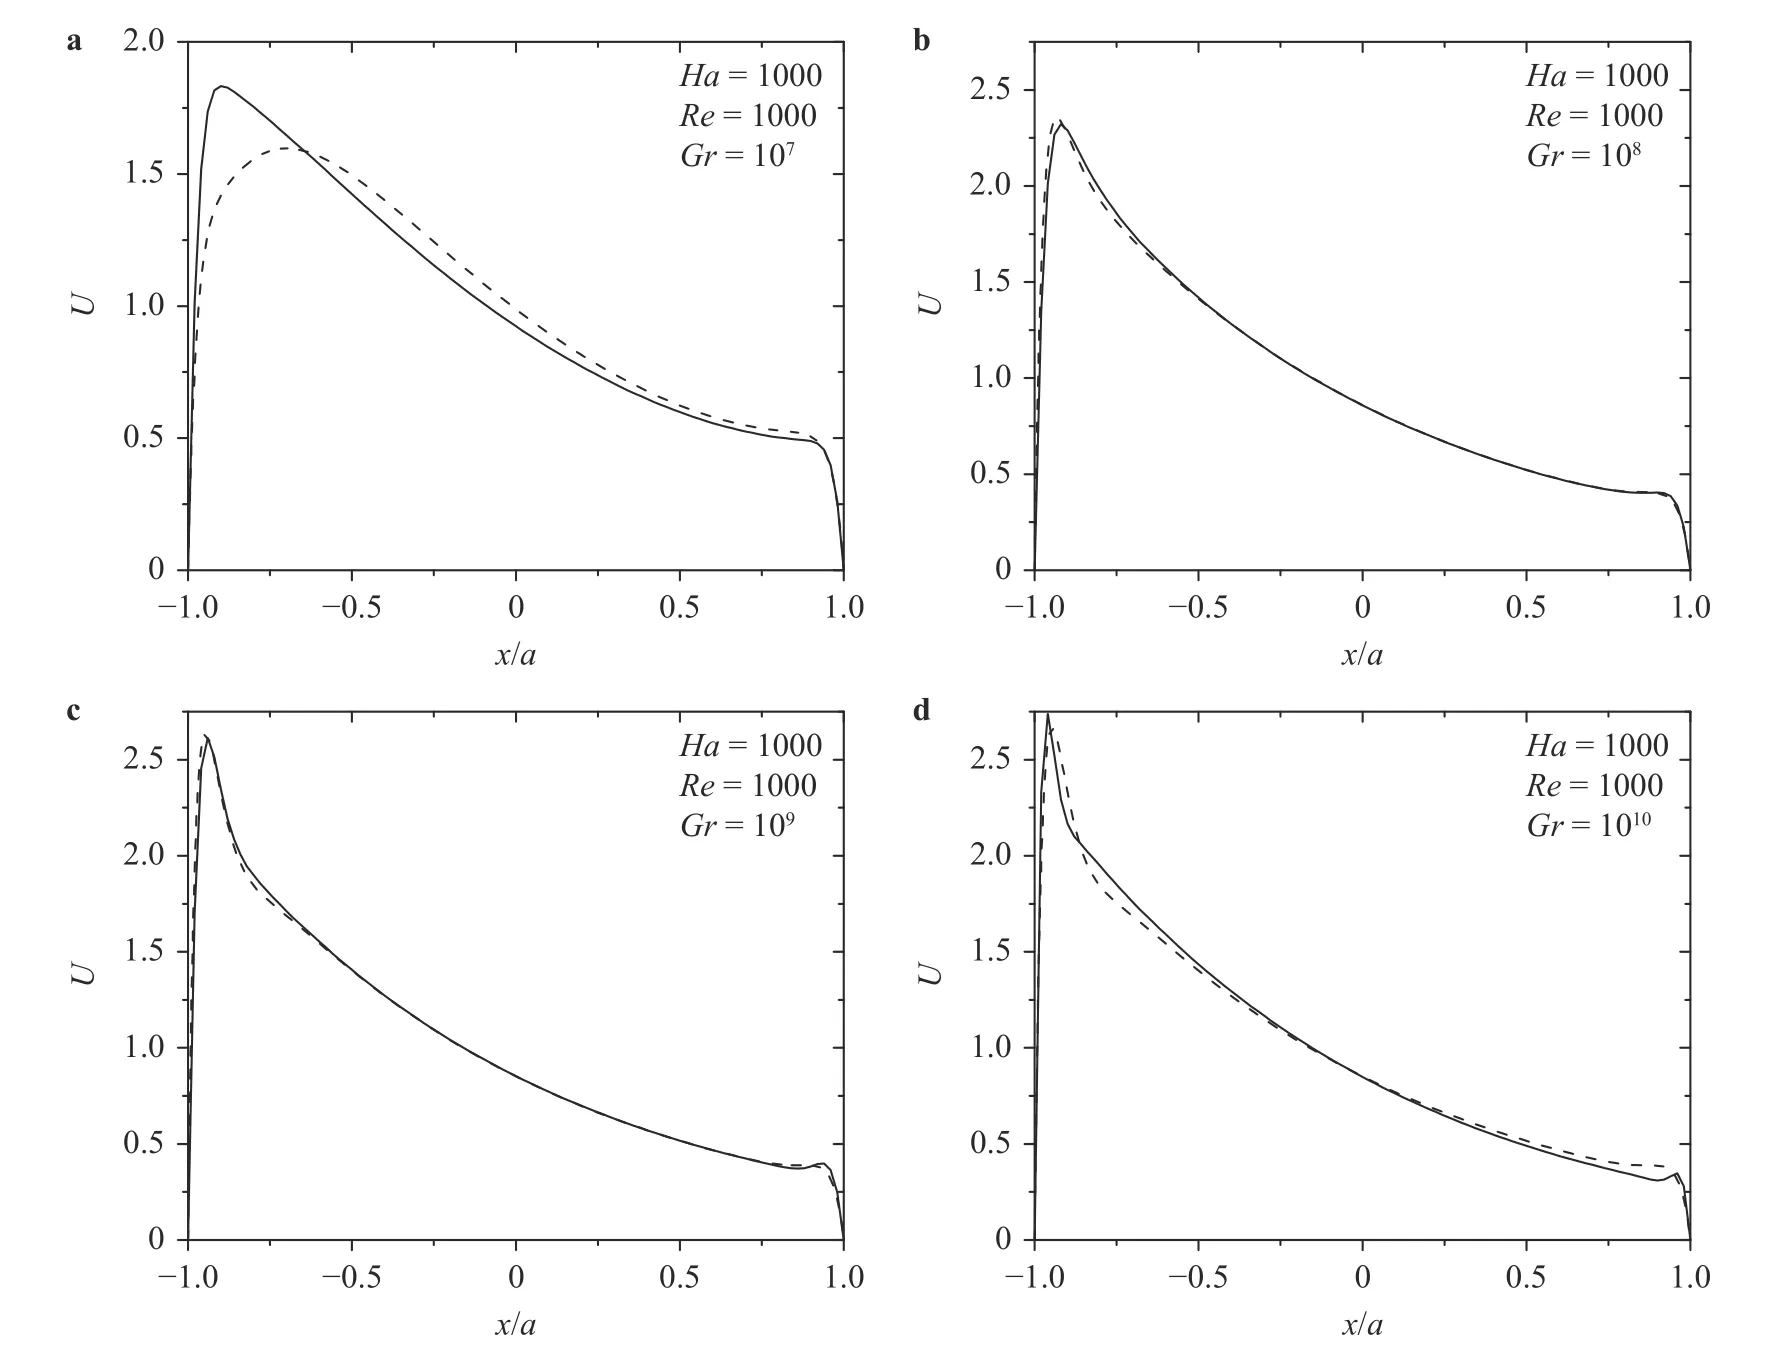
Fig. 3. A comparison between the present simulation (solid line) and 1D analytical full solutions (dashed line)
The Fig. 3 shows good agreement of the present simulations cases with the approximate full solution for different Gr numbers cases. The maximum relative errors of velocity for the four cases in core region are 7.1%, 0.1%, 0.1%, and 3.4%, respectively.Because the maximum relative error locate near boundary layer,and the approximate solution cannot accurately predict velocity in boundary layer, the error between present simulation and approximate solution is acceptable. Figure 4 clearly shows that velocity at outlet is a Q2D distribution due to magnetic field effect,while the cross-axial temperature at outlet is a three-dimensional distribution. Cross-axial temperature declines gently along Xaxis in the cases of and . However, it drops rapidly in the side layer near hot wall in cases of and (Fig. 5), which would lead to the accumulation of temperature near side layer.
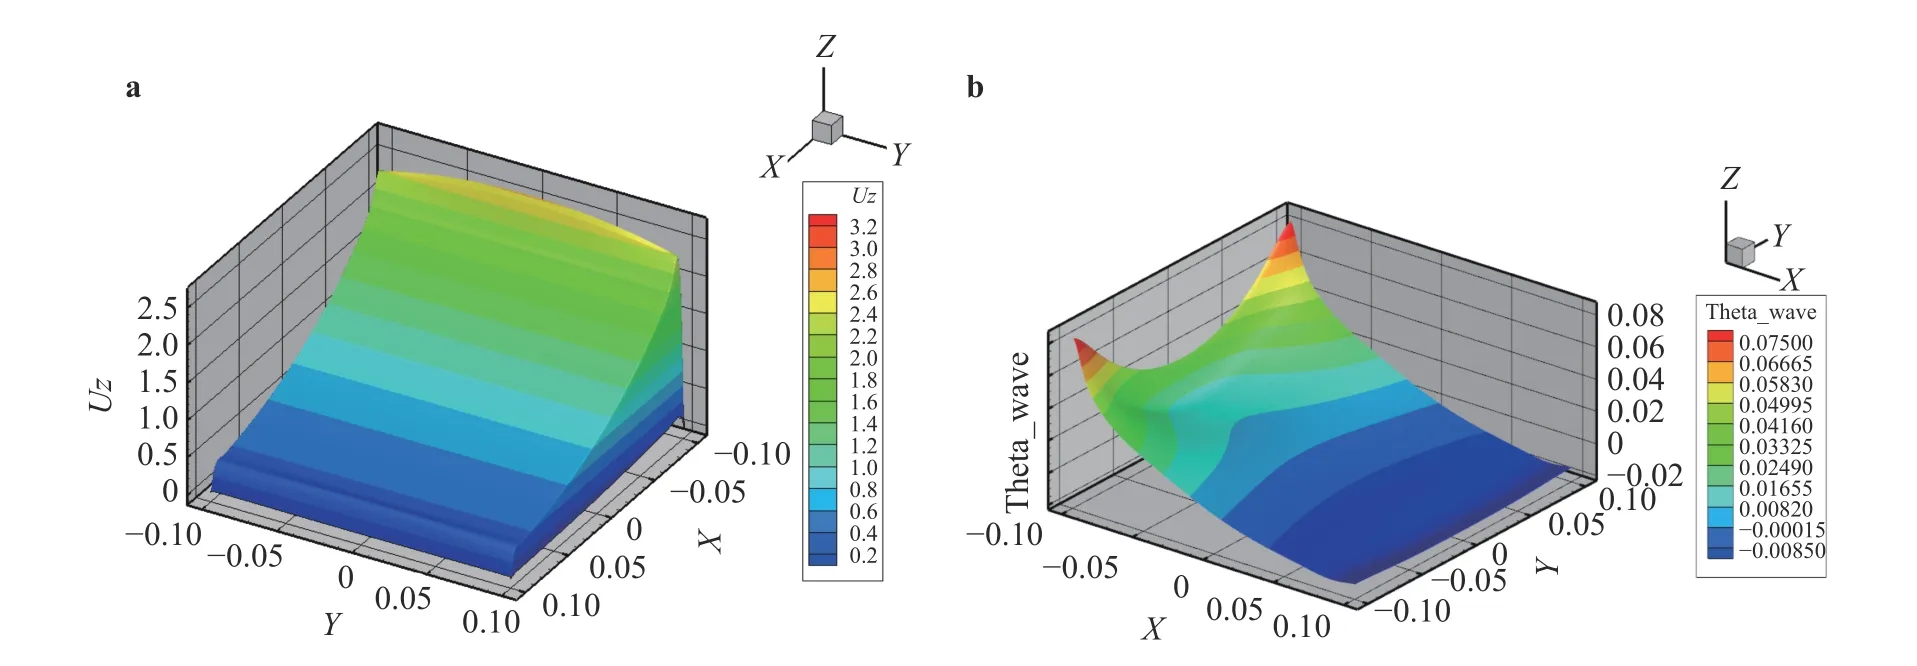
Fig. 4. Distributions at outlet,: a Q2D distribution of velocity, b distribution of non-dimensional cross-axial temperature
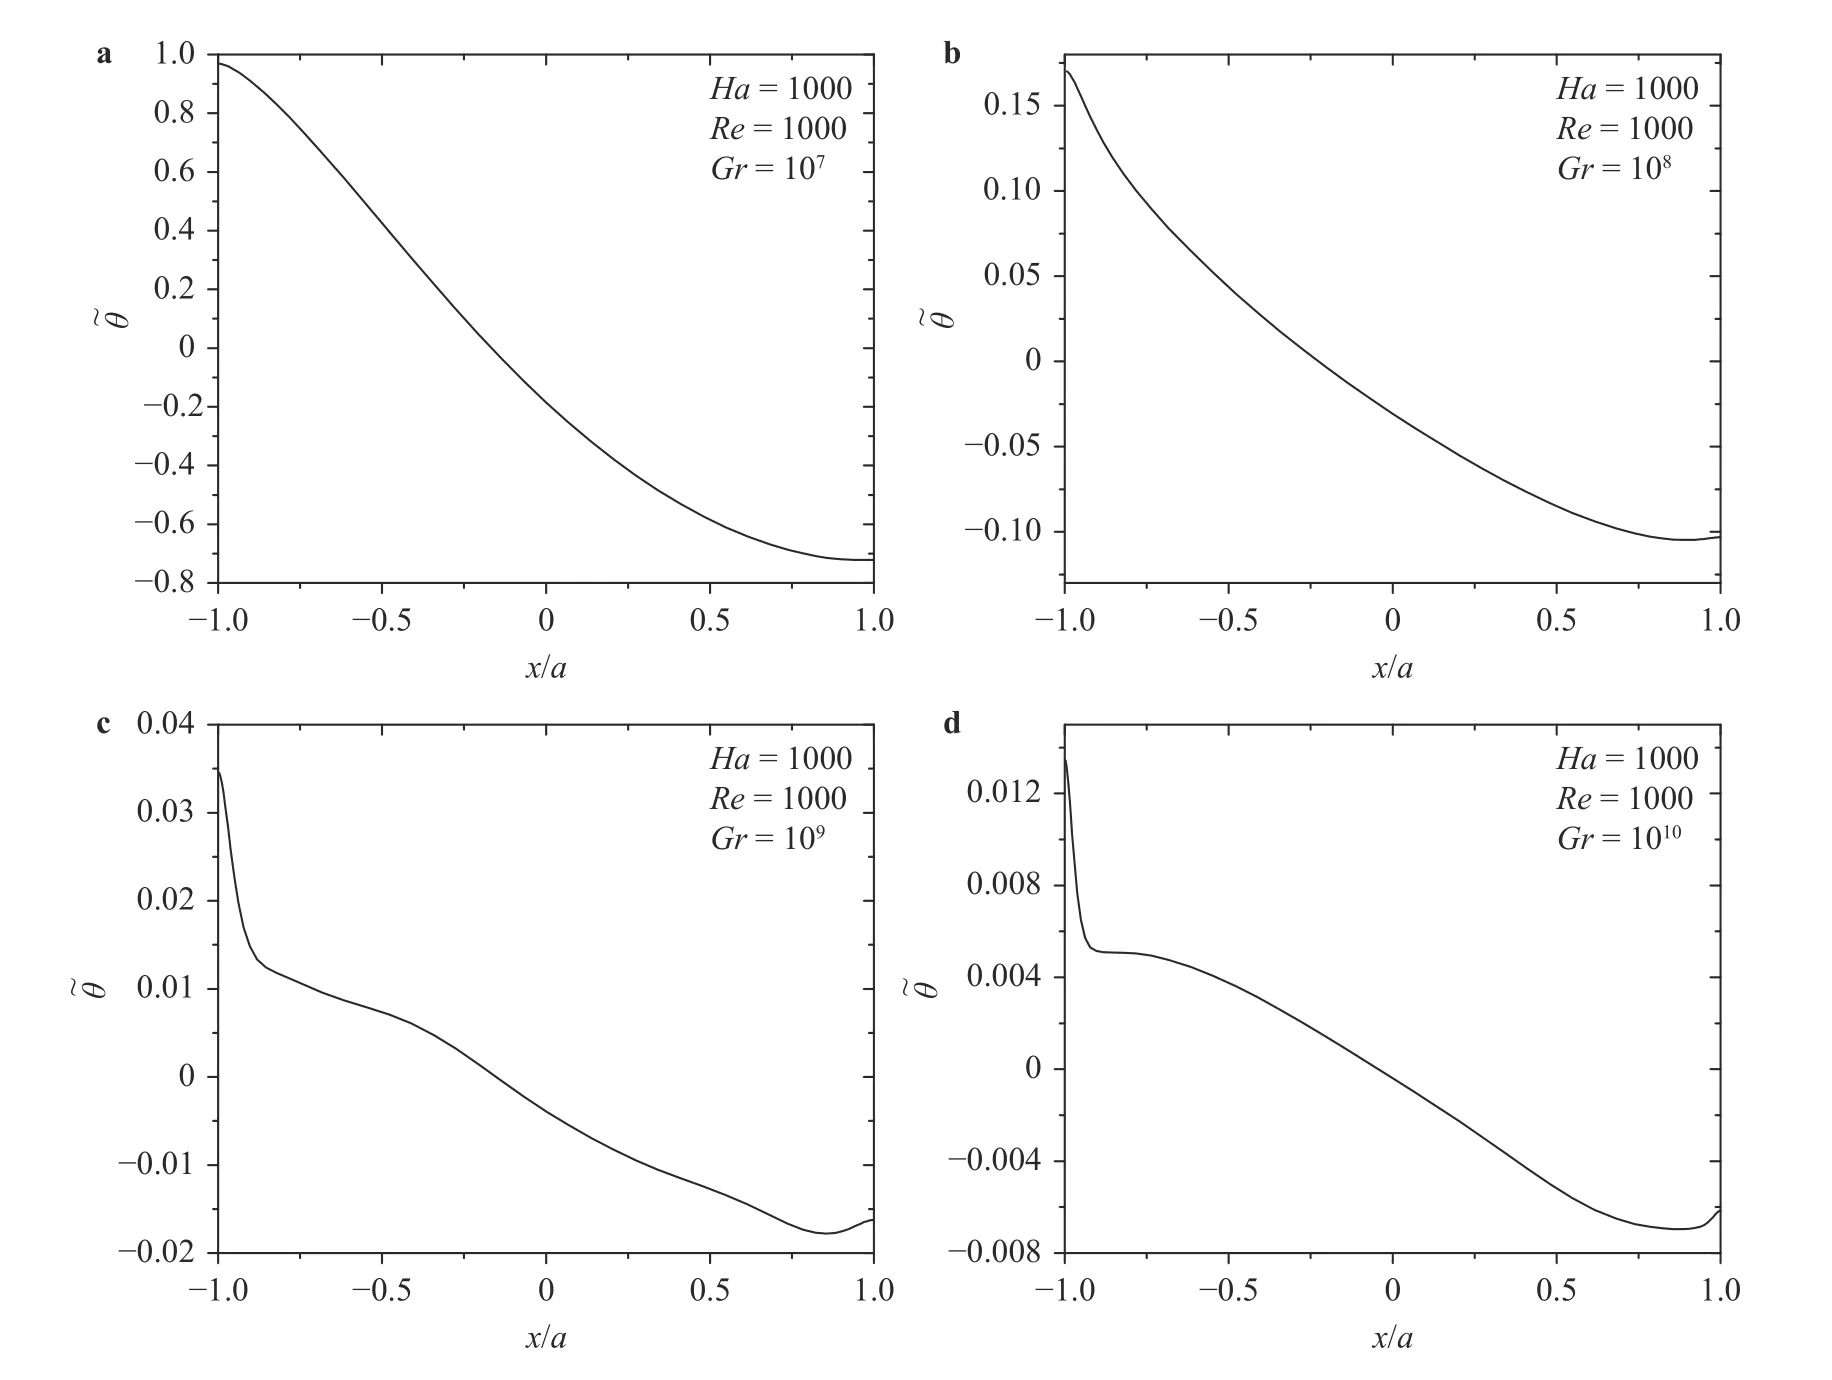
Fig. 5. Non-dimensional cross-axial temperature at outlet centerline
With considering the wall electrical conducting effects, MHD mixed convection is investigated with the help of the validated magnetic-convection code. Both Hartmann number and Reynold number are fixed at 1000 in all the simulations below. The conductance ratiois employed to evaluate the wall effects, which represents products of the dimensionless wall conductivity and dimensionless wall thickness. On the basis of the simulation of MHD mixed convection with different conductance ratio, the effects of wall conductance on metal fluid flow and heat transfer in duct are analyzed. The conductance ratio is set to vary between 0 and 0.1 in this work.
Figure 6 shows that two peak velocities occurr near both left and right side walls, and they increased with the growth of the wall conductance ratio. The coupling effects of the strong MHD effect, mixed convection and the exponentially volumetric heat source result in these peak velocities. Peak velocities increase monotonically with enhanced wall electrical conductance ratio.However, Fig. 7 indicates that peak velocities have non-monotonical variation with increasing Grashof number when. In the cases of, the peak velocity near hot wall increases first and then weaken along with the growth ofnumber. The velocity near cold wall negatively correlates withnumber. Furthermore, magnitudes of both hot wall and cold wall velocities have huge drops at high Gr number. As to, the velocity distribution atis very close to that at. That implies that buoyancy effect plays a dominant role on metal fluid flow at high Gr number case. So at, the velocity differences are small whenCwchange between 0 and . In addition, when and varies from 0 to 0.1, velocity near cold wall only changes a little (as shown in Fig. 6). But when change from and , velocity near the cold wall changes drastically as shown in Fig. 7. This trend demonstrates that the wall conductance ratio dominates flow at low Gr number and high wall conductance ratio. At high number, buoyancy efffect dominates the flow and wall conductance ratio has little effect on flow distribution. The coupling effect of the buoyancy and magnetic field leads to this non-monotonous variation. This conclusion is also supported by(the Eq. (14) in Ref. [15]).
With increasing wall electric conductance ratio, the current density in metal fluid is stronger and stronger. The stronger Lorentz force extruded fluid of core region to boundary layer, so a stronger jet flow and a stronger pressure drop are formed. Similar to the Hunt flow, with enhanced wall conductance ratio,peak velocities near hot and cold walls are accelerated, a stronger jet flow is formed. It is wall effects that makes the jet transforms from a Q2D distribution to 3D distributions (as shown in the Fig. 8).
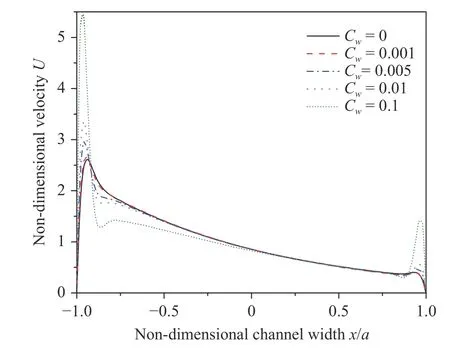
Fig. 6. Non-dimensional velocity distribution at outlet centerline() with different wall conductance ratios and,,
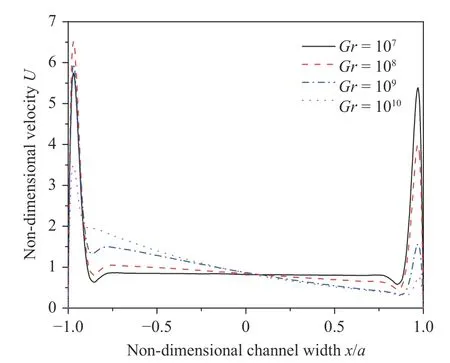
Fig. 7. Non-dimensional velocity distribution at outlet centerline() with different Grashof numbers at

This definition of Nusselt number represent ratio of convection to conduction heat transfer along the flow direction. Figure 9 shows that the peak Nusselt number near both walls increase progressively with enhanced the wall conductance ratio. The curves in Figs. 6 and 9 show that Nusselt number and velocity had similar varying trends. Due to buoyancy effects, convection is much stronger than conduction, and velocity plays decisive role on Nusselt number. And the peak velocity would result a peak Nusselt number at the same location.
Figure 10 displays the temperature variation with wall effects atwith varyingfrom 0 to 0.1. With increasing wall conductance ratio, the faster jet flows near both walls would transport out more energy (as shown in Fig. 9), which lead to the negative correlation between temperature of hot or cold wall and wall conductance ratio. Around, because the velocity is weaker than the peak velocity, plenty of energy is retained, a high temperature zone forms and Nusselt numbers significantly reduce.
Wall effects also have manifest influences on temperature.The peak velocity atis lower than the one at(as shown in Fig. 8). Lower velocity would lead to a peak temperature at the same location (as shown in Fig. 11). Although temperature of mid-point at hot wall negatively correlates with wall conductance ratio, temperature at hot wall corner is positive correlation. Results suggest that at high Gr number,high temperature at hot wall corner might cause more dangerous stress state of FCI.
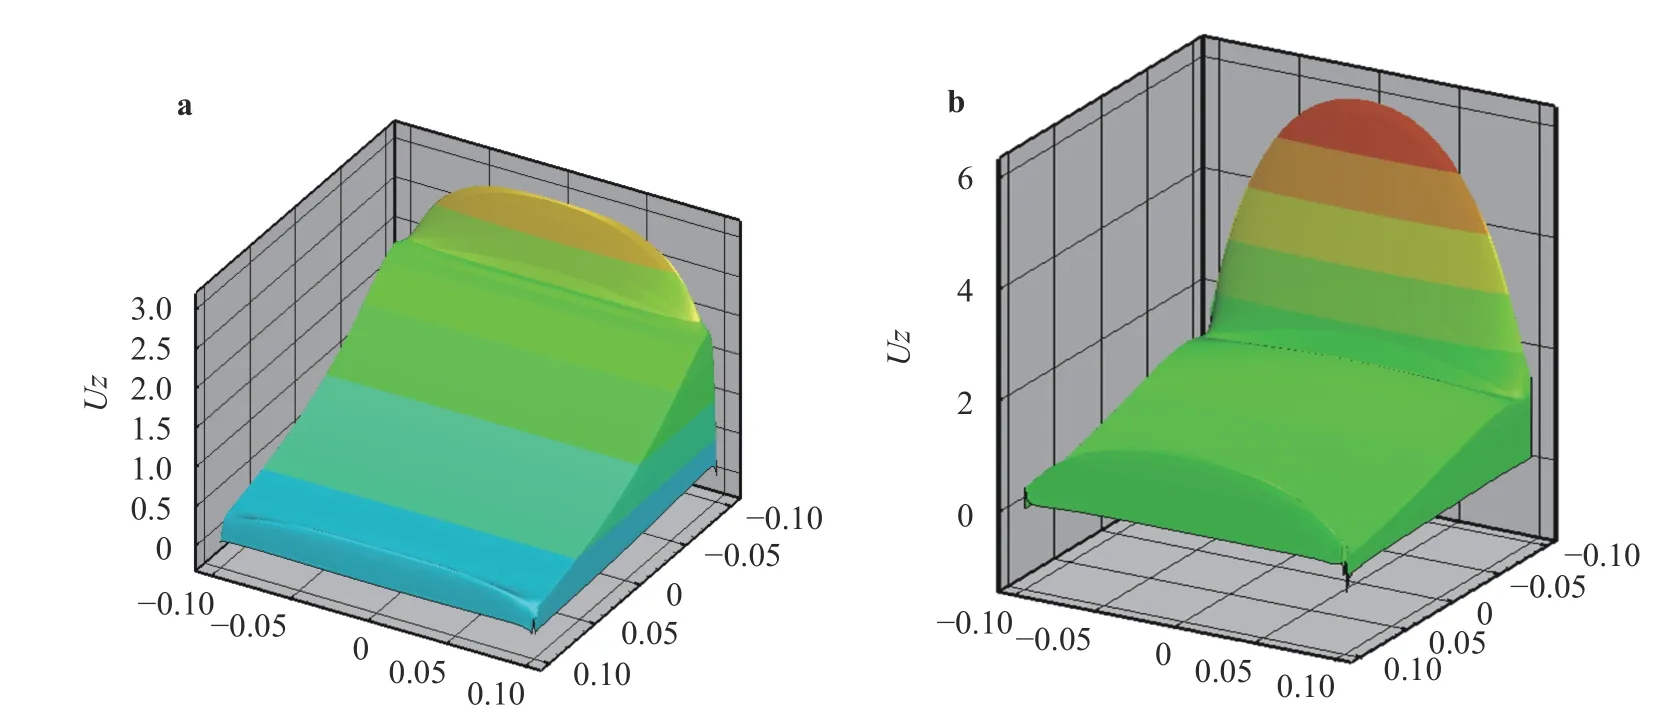
Fig. 8. A variation at outlet with different wall conductance ratios and,,: 3D distribution of velocity with aand b
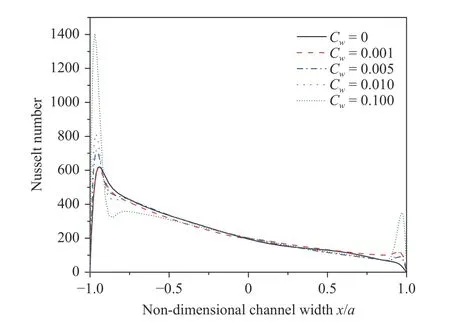
Fig. 9. Nusselt number profile at outlet centerline () with different wall conductance ratios and ,,
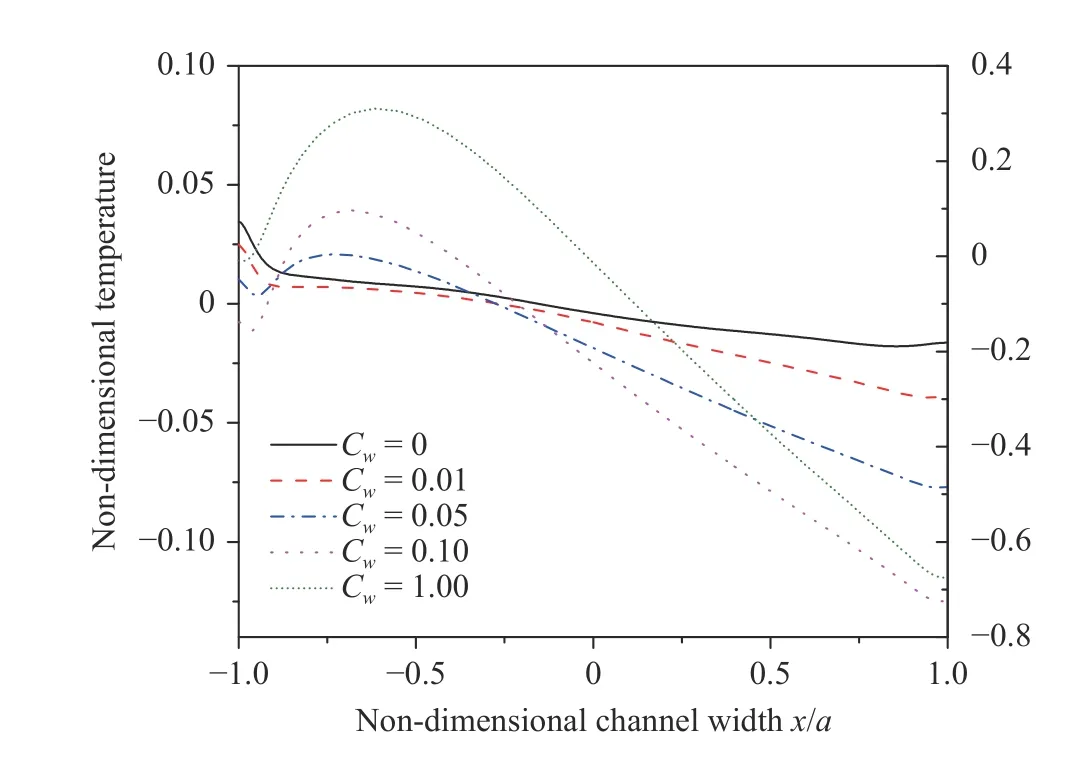
Fig. 10. Non-dimensional cross-axial temperature at outlet centerline () with different wall conductance ratios and ,,, temperature of is scaled by right Y-axis, the others is scaled by left Y-axis
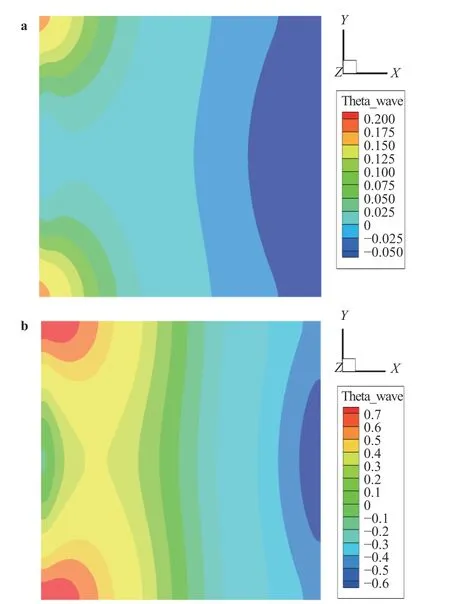
Fig. 11. Distribution of non-dimensional cross-axial temperature at outlet centerline () with different wall conductance ratios and,, : a and b
Figure 12 shows that the wall conductance ratio has a substantial influence on pressure drop. When , the pressure drop has a minimum value. As wall conductance ratio increases, the pressure drops increased rapidly. Usually, the flow channel insets (FCI) are made from materials with weak con-ductivity in order to deduce the MHD effects. But when FCI has been soaked in PbLi metal liquid for a long time, electrical conductivity of FCI is increased, which would result in a higher pressure drop.
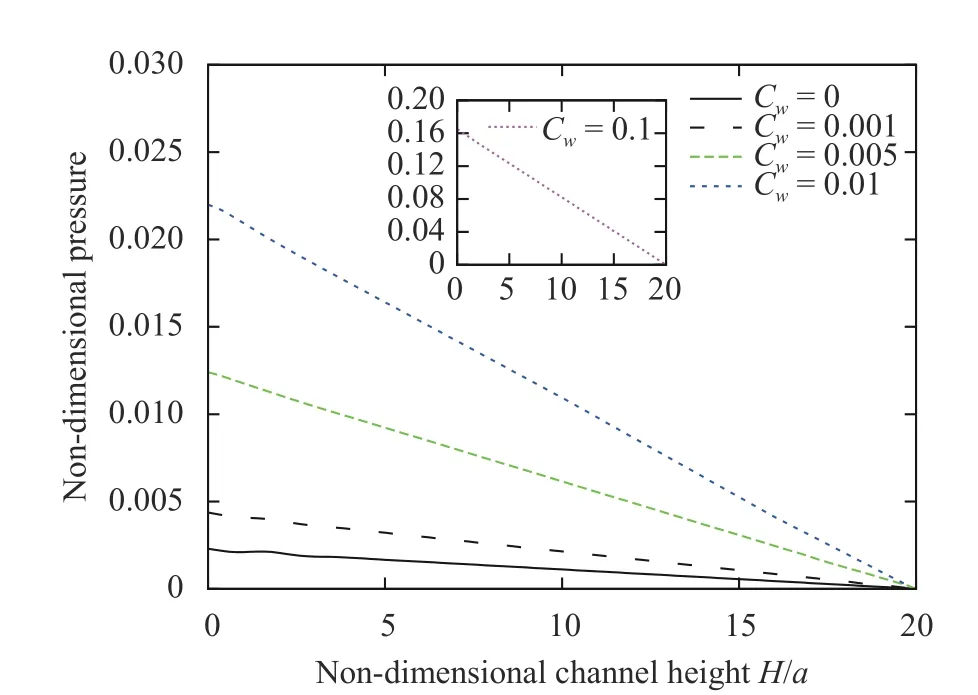
Fig. 12. The non-dimensional pressure drop along flow direction with different wall conductance ratios under, ,
Three-dimensional simulations of MHD mixed convection are conducted in this work. Coupling effects of wall conductance ratios and internal heat sources on the velocity field, temperature field and Nusselt Number distribution in duct are investigated. The results show that nonlinear coupling effects lead to complicated variations of flow features and heat transfer. The important points are concluded as follows:
(1) At high Grashof number, buoyancy effect dominates the jet flow near boundary layer.
(2) At low Grashof number and high wall conductance ratio,the wall conductance ratio dominates the jet flow. Wall conductance ratio has a stronger effect on cold wall than hot wall.
(3) Wall effects result in transition of Q2D distribution to three-dimensional distribution of velocity and temperature. The dangerous stress state of the structure would appear at corners of hot wall at high Gr number.
(4) The jet flow near hot wall transport a lot of energy. It is the convection rather than conduction that dominates the variation of Nusselt number.
(5) Low wall conductance ratio has slight effect on pressure drop, but big wall conductance ratio would substantially increase pressure drop. Results suggests that the FCI soaked in PbLi metal liquid for a long period time would greatly increase the pressure drop of metal fluid in blanket.
Acknowledgements
The authors gratefully acknowledge the support from the National Key Research and Development Program of China(2017YFE0301300), and the National Natural Science Foundation of China (51776194 and 51376175).
杂志排行
Theoretical & Applied Mechanics Letters的其它文章
- Mechanics of Tokamak fusion components
- Delamination strength of HTS tape under transverse tensile stress and its enhancement by using different Ag layer depositing temperatures
- Progress on design and related R&D activities for the water-cooled breeder blanket for CFETR
- Numerical methods for the magneto-mechanical coupling analysis of invessel components in Tokamak devices
- Progress on the ultrasonic testing and laser thermography techniques for NDT of tokamak plasma-facing components
- Considering for the blanket structure scheme of HCCB DEMO
