Impacts of Wettability on Immiscible Fluid Flow Pattern-Microfluidic Chip Experiment
2019-05-10ZhengXiangleiJangJaewon
Zheng Xianglei; Jang Jaewon
(1. Municipal Testing Laboratory, New York, USA;
2. Department of Civil and Environmental Engineering, Hanyang University, Korea)
Abstract: Immiscible fluid flow is frequently found in resource recovery or soil remediation. The flow pattern in the porous media is affected by the wettability of pore surface. In this study, quartz substrates and microfluidic chips are treated by silica nanoparticles (SNP) and triethoxy(octyl)silane (TES) to fabricate the water-wet and oil-wet surfaces. The wettability of the treated-surface is measured in term of contact angle for several combinations of surrounding fluid and a liquid droplet. The effect of the wettability on the fluid flow pattern is explored by injecting oil and water alternately into the surface-treated microfluidic chips. The results reveal that the SNP-coated quartz substrate shows strong water-wet property and the TES coating makes water-repellent/oil-wet surfaces. In addition, it is found that the maximum and minimum oil and water saturation during alternate injection of oil and water depends on the surface wettability of the microfluidic chips. The characteristics of the pore-scale fluid flow pattern are also described.
Key words: wettability; contact angle; nanoparticle coating; hydrophilic; hydrophobic; microfluidic chip
1 Introduction
The wettability of pore surface affects the fluid flow pattern in porous media, the displacement efficiency, the residual oil saturation and the irreducible water saturation in oil/gas recovery, which is an important characteristic in the reservoir engineering[1]. The wettability is determined by the mineral composition of the pore surface, the initial saturation, and the fluids in pore space.
Contact angle (CA) of a liquid droplet on a substrate surrounded by fluid is a result of the force equilibrium among all forces acting between liquid-fluid TLF, liquidsubstrate TLS, and fluid-substrate TFS(Figure 1a). For the combination of water and oil, the wetting condition can be classified as water-wet, oil-wet, mixed-wet (both strong oil-wet and water-wet), and intermediate wet (both weak oil-wet and water-wet). In petroleum engineering,three categories are available based on the contact angle of a water droplet on the pore surface surrounded by oil:water-wet (0<CA<75), mixed-wet or intermediate-wet(75<CA<105), and oil-wet (105<CA<180)[2].
Sand and rock surface are mostly initially water-wet due to the mineral composition. However, if oil remains in the pore space in a prolonged time, the organic materials and/or the polar compounds in oil are adsorbed on the solid surface, which alters the water-wet surface to the oil-wet surface[3]. This phenomenon makes it difficult to produce oil from carbon reservoir or displace contaminants from the sediment. The surface wettability can be changed by CO2[4], alkaline flooding[5], gas flooding[6], and surfactant application[7], or by surface coating via spraying[8], plasma irradiation[9], boiling-induced precipitation[10], and the oilaging method[1].
Nanoparticles can be used as coating material to fabricate hydrophilic or hydrophobic surface[11-12]and change the microscale surface forces[13-14]. Nanofluid (nanoparticles dispersed in fluid) is used to alter the pore surface wettability of the reservoir and eventually to increase the oil recovery[15]. The nanofluid flooding can lead to a significant increment of oil recovery because of the wettability change as well as the interfacial tension reduction[16]. In addition, nanoparticles mixed in fluid can change the viscosity[17]by generating foams[18].
The pattern of fluid flow at pore-scale has been studied by using transparent microfluidic chips[19-20].It is acknowledged that oil recovery is affected by the wettability of pore space[21]. However, the pore-scale mechanism of immiscible fluid displacement by the modification of surface wettability needs to be explored further. Therefore, the goal of this study is to investigate the effect of wettability on immiscible fluid (water and oil) flow. Nanofluid (silica nanoparticles in water) was used to modify the surface wettability. The effect of silica nanoparticle and polymer coating on wettability change was studied. The pore surface of microfluidic chips was treated under either the water-wet or the oil-wet condition. And, the oil and water flow pattern through the surface-treated microfluidic chips under the three wetting conditions was investigated.
2 Experimental
2.1 Materials

Figure 1 Contact angle θ in fluid-liquid-substrate system(a) Contact angle is a result of force equilibrium among interfacial tensions between fluid and liquid TLF, liquid and substrate TLS, and fluid-substrate TFS;and (b) Image of water and oil droplet surrounded by air and water on a substrate.
The coating materials included silica nanoparticle SNP (US Research Nanomaterials, Inc., particle diameter: 30 nm, 25% in water, stock #: US7040) and triethoxy(octyl)silane TES (Sigma-Aldrich, purity >97.5%). The SNP-water solution with two different weight concentrations (1% and 25%) and the TES solution were used to coat the surface of quartz substrates(McMaster-Carr, purity=99.995%, 19 mm in diameter and 1.6 mm in thickness) and the pore space of a microfluidic chip (the pore dimension of the microfluidic chip is described in the following section).
Deionized (DI) water and mineral oil (McMaster-Carr, part#: 3 190 K631) were used for contact angle measurement and fluid invasion test in the microfluidic chip. The viscosity of the mineral oil is 120 mPa·s measured by a viscometer (DV-III Rheometer, Brookfield) at room temperature (~22 C). In order to distinguish mineral oil and water from the oil-water mixture flowing through the microfluidic chip, the mineral oil was dyed as red by the Oil-Red-O (Sigma-Aldrich) and the DI water was dyed as blue by methyl blue (Sigma-Aldrich).
2.2 Surface coating procedure
The quartz substrates and the microfluidic chips were thoroughly cleaned by isopropyl alcohol and DI water prior to the coating. The quartz substrates were submerged in the coating solutions (1% and 25% SNP water solution and TES solution) for 20 hours. Then, the substrates were gently rinsed with DI water for 3 minutes and were dried in air. For the microfluidic chip coating, the coating solution was injected into the microfluidic chip. After 20 hours, the microfluidic chip was rinsed by injecting DI water, which was 100 times the pore volume. Three quartz substrates (coated by 1% and 25% SNP solution and TES solution, respectively) and two microfluidic chips (coated by 1% SNP solution and 1% TES solution, respectively)were prepared for the contact angle measurements and fluid invasion tests.
2.3 Contact angle measurement
A sessile droplet was generated by a syringe on the clean and surface-treated quartz substrate for contact angle measurement as shown in Figure 1b. In a surrounding fluid-liquid droplet-substrate system, the fluid was in contact with the substrate initially, and then the liquid droplet was generated for all performed tests. The volume of the generated sessile droplet was approximately 20-40 μL. The droplet image was taken by a high-resolution camera (Nikon D5 200 with AF-S DX Micro-NIKKOR 40 mm f/2.8 G lens) and then the shape of the droplet was analyzed with the axisymmetric drop shape analysis(ADSA) technology[22]to obtain the contact angle. The contact angles of a water droplet in air and oil, and an oil droplet in air and water on both clean and treated quartz substrates were measured.
2.4 Fluid invasion
The microfluidic chip (Micronit, the Netherlands) is made of two etched quartz plates (Figure 2a). The pore space dimension of the microfluidic chip is 21.3 mm×12.7 mm.The internal volume of the microfluidic chip is ~5 μL.
The experimental configuration is shown in Figure 2b.Oil and water were alternately injected into a microfluidic chip by two syringe pumps (New Era Pump System,NE-1 000) at a constant injection rate of 5 μL/min. The clean, SNP-treated, and TES-treated microfluidic chips were used.
The clean and SNP-coated microfluidic chips were initially saturated with water, and then oil started invading into the water-saturated microfluidic chip. The volume of fluid at each injection (either oil or water)was 150 μL, which was 30 times the pore volume of the microfluidic chip. The injection rate was 5 μL/min. One cycle of injection included 150 μL of oil and 150 μL of water injected. Ten cycles were run continuously.Pictures were taken at every 30 seconds during the entire test. The TES-treated microfluidic chip was initially saturated with oil, and then water was injected into the oil-saturated microfluidic chip. Ten cycles of alternate water and oil injection were performed. It should be noted that the fluid flow could affect the granular particle (sand or clay grains) of in-situ sediments[14], but in this study, the impact of fluid flow on pore structure was not considered.
2.5 Measurement of the saturation degree
The pictures of the microfluidic chip were then analyzed by using the MATLAB R2016b. The red and blue colors were distinguished by color thresholder. The saturation degree of water or oil was calculated by dividing the area of each phase by the total pore area.
3 Results and Discussion
3.1 Surface image-Nanoparticle coating
The images of the clean and SNP-treated quartz surface were obtained by scanning electron microscopy(XL30 ESEM-FEG, FEI). The images show that silica nanoparticles are still attached on the substrate surface even after rinsing the substrate in water. In addition, the quartz surface treated by the 25% SNP solution showed more silica nanoparticles on the surface, as compared to the clean surface and the surface treated with the 1% SNP solution.
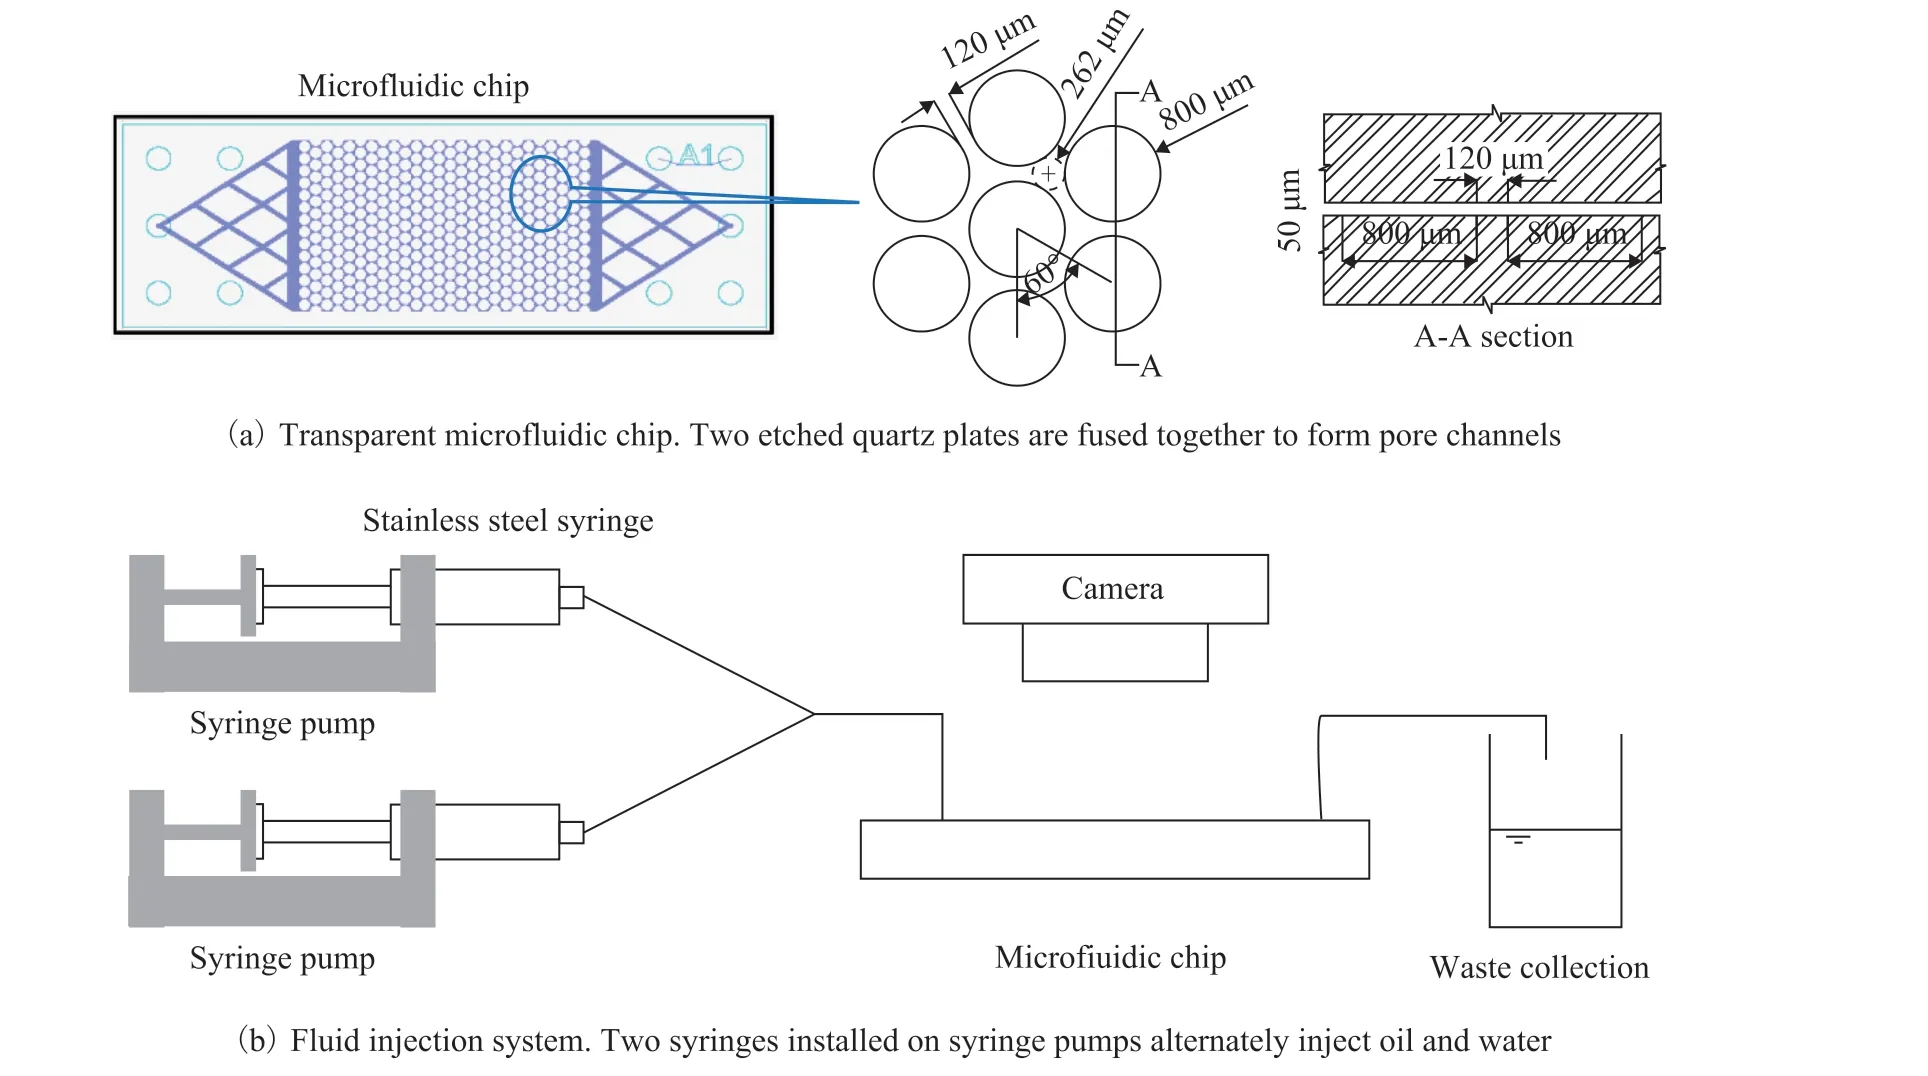
Figure 2 Experimental configuration
3.2 Contact angle measurement
The contact angles measured for various surrounding fluid-liquid droplet combination such as air-water, airoil, oil-water, and water-oil are summarized in Table 1. A total of 16 substrates were used for the CA measurement.The contact angle of a water droplet in air was measured on 16 clean substrates to check the dependence of CA on individual substrate prior to surface coating. The mean value of the measured contact angles was μ[θ]=44 with a standard deviation σ[θ]=3.8. In an air-water dropletsubstrate system, water was the wetting phase on all four types of surfaces (viz: clean, 1% SNP-coated, 25% SNPcoated, and TES-coated substrates). The SNP coating modified the substrate to the more water-wet condition:The CA of the SNP-coated substrates were 36.1 and 39.9. However, the TES-coated substrate showed an intermediate wet condition (CA=74.1). In an air-oil droplet-substrate system, the contact angles of the oil on all substrates were even lower than the CAs of water on the corresponding substrates. The substrate coated by 1% SNP solution showed the lowest CA. In an oilwater droplet-substrate system, the clean and SNP-coated quartz substrates showed water-wet condition, however,the TES-coated substrate showed oil-wet condition. In addition, only the 1% SNP solution coating could reduce the CA of a water droplet from 55.6 for clean quartz to 35.9 for coated substrate. There was no considerable effect of the 25% SNP solution coating on the CA reduction. In the water-oil droplet-substrate system, the contact angles of an oil droplet were over 146 (water-wet)on the clean and both SNP-treated substrates, and were around 102 on the TES-treated substrate.
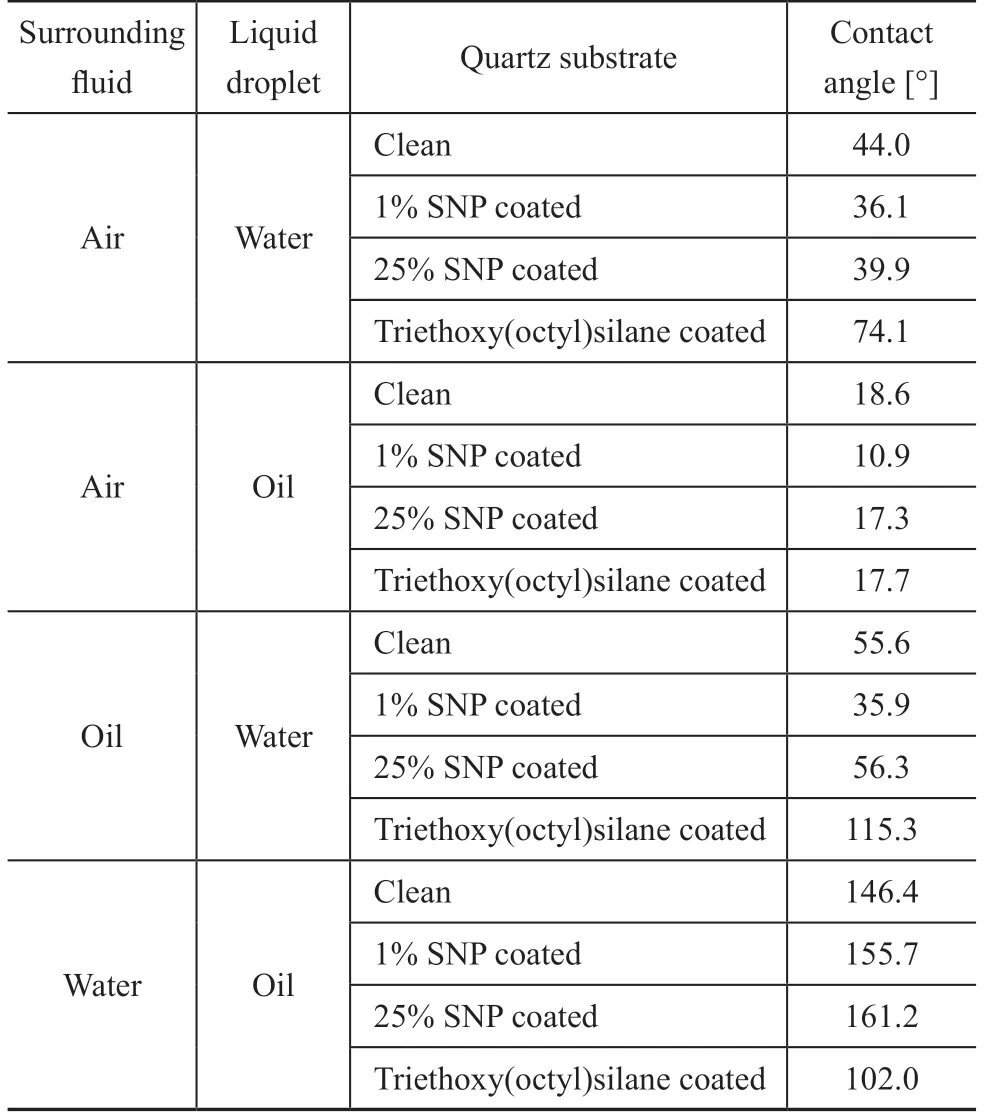
Table 1 Contact angles of droplets on clean and treated quartz substrates

Figure 3 Scanning electron microscope (SEM) image of substrate surface(a) Clean quartz surface; (b) Quartz surface coated with 1% SNP solution; and (c) Quartz surface coated with 25% SNP solution
As shown above, the wettability of the droplet of the same liquid (e.g., oil in this study) can be affected by the surrounding fluid (e.g., either air or water in this study)[23]. For the combination of air-water or air-oil, the clean and SNP coated quartz substrates showed the water-wet or oil-wet property. The CA of oil in air was lower than the CA of water in air. However, for the combination of water-oil or oil-water, the quartz substrate clearly showed a water-wet property (For example, an oil droplet on clean and SNP-coated quartz substrate was a wetting phase in air, but it became a non-wetting phase in water).
The contact angle of a water droplet in air on 1% of SNP-coated quartz substrate was smaller than that on 25% of SNP-coated substrate. The results indicate that the surface roughness might reduce the hydrophilicity,which could be explained by the Wenzel model and the Cassie-Baxter model[24]. There were more nanoparticles adsorbed on the substrate surface coated by 25% of SNP nanofluid (Figure 3), which increased the roughness or coating heterogeneity. Small air bubbles might be trapped in the grooves of the rough surface; therefore, liquid could not perfectly wet this surface. Therefore, the hydrophilicity was reduced.
3.3 Water and oil flow - pore-scale displacement pattern
The oil and water saturation profiles during the 10 cycles of alternate oil and water injection into the three microfluidic chips (clean, SNP-coated, and TES-coated)are shown in Figure 4.
For the case of clean microfluidic chip, oil starts invading into the water-saturated microfluidic chip followed by alternate water and oil invasion (Figure 4a). During the oil injection at the 1stcycle, oil saturation increases from So=0 to 0.99, and water saturation decreases from Sw=1 to 0.01. The invading oil displaces almost all water existing in the pore space of the microfluidic chip during the 1stcycle. Then, during the water injection at the 1stcycle, the oil saturation decreases from So=0.99 to 0.43 (with the water saturation Sw=0.57). Thereafter,the maximum oil saturation at each cycle decreases down to So=0.76 (Sw=0.24) during the first five cycles of injection. After the 5thcycle, the maximum oil and water saturation remains almost constant.
However, for the SNP-coated and the TES-coated microfluidic chip, there is no significant change in maximum oil and water saturation after the 1stcycle(Figure 4b & 4c). The maximum oil saturation rates at each cycle are approximately So=0.9 (Sw=0.1) for the SNP-coated microfluidic chip and So=0.8 (Sw=0.2) for the TES-coated microfluidic chip.
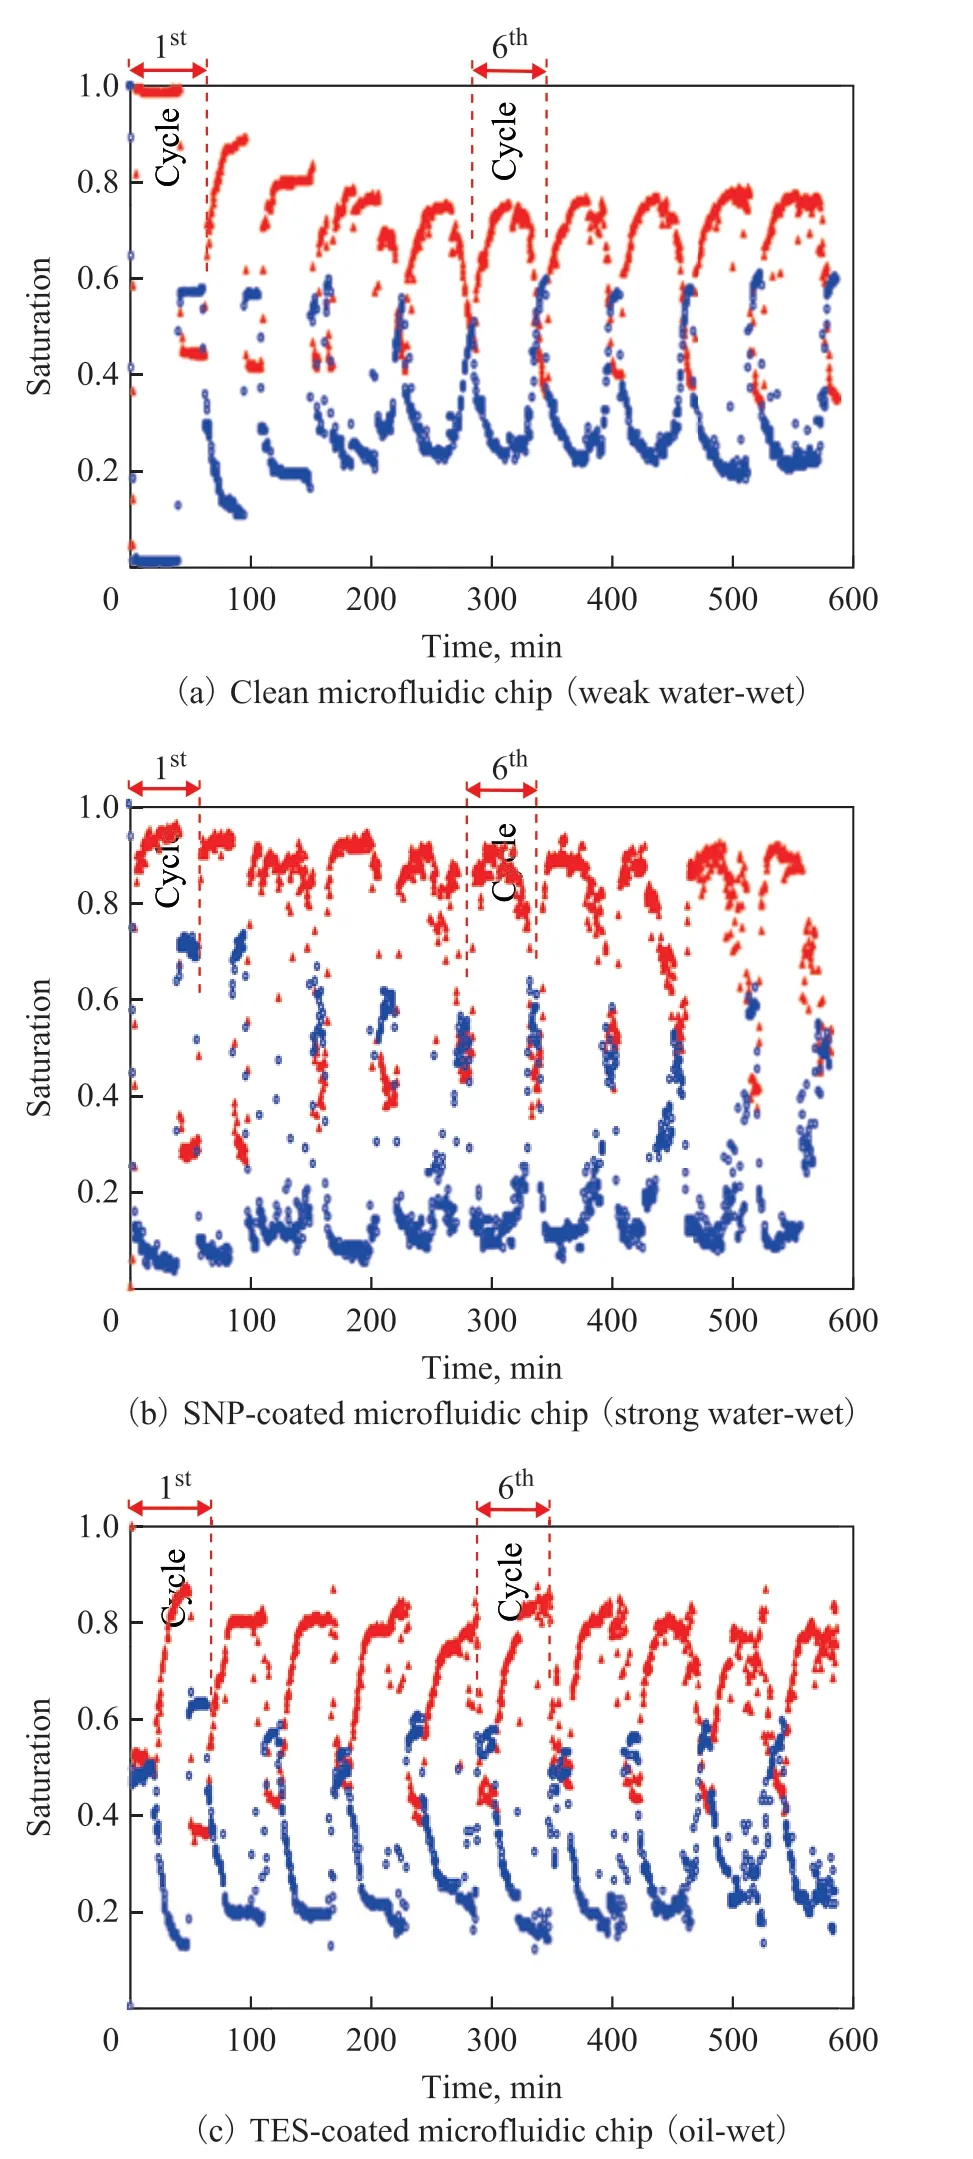
Figure 4 Saturation of oil and water during 10 cycles ofinjection
The water and oil flow patterns at the 1stcycle and the 6thcycle of injection in the clean microfluidic chip are shown in Figures 5 and 6, respectively. During the first oil invasion into the water-saturated clean microfluidic chip, the invading oil front is a flat and straight line perpendicular to the invading direction (Figure 5a).The logarithmic ratio of the invading oil viscosity μinvover the defending water viscosity μdefis logM=μinv/μdef=2.1, which results in a stable displacement and a high displacement ratio in porous media[25]. As shown in Figure 4, the maximum oil saturation during oil invasion (favorable displacement, logM>0) is always higher than the maximum water saturation during water invasion (unfavorable displacement, logM<0). The water injection at the 1stcycle after oil injection shows that the invading water forms preferential flow path due to viscous fingering (logM=-2.1) and only 57.2% of oil is drained from the microfluidic chip (Figure 5b). It means that a considerable area of the pore space (~42.8%) is occupied by trapped oil clusters. During the 2ndcycle of oil injection, oil flows through the pore space by merging the existing trapped oil clusters, resulting in the isolated water clusters. Therefore, the maximum oil saturation after the 6thoil injection decreases to So=0.75 (Figure 6a).The fluid flow pattern during the 6thcycle of oil and water injection is shown in Figure 6. After several alternate oil and water invasion, there are many isolated oil and water clusters that cannot be drained easily. When oil (or water) invades at each cycle, oil (or water) tends to merge the existing isolated oil (or water) clusters and leave behind the isolated water (or oil) clusters. Therefore, the oil saturation after oil invasion cannot reach 100% even under a favorable displacement condition (logM > 0).
The oil saturation at six different regions from the input to output boundaries of the clean microfluidic chip is shown during the 1stcycle and the 6thcycle of invasion (Figure 7). During the invasion of either oil or water, six images are selected to analyze the oil saturation at six different regions.
During the 1stcycle of oil invasion, oil saturation starts increasing from the input side first, then there is a gradual increase of oil saturation to the output side (Figure 7a). As shown in Figure 5a, as soon as the viscous oil invades into the water-saturated clean microfluidic chip,the oil saturation dramatically increases (from So=0 to 0.99). When water invades during the 1stcycle, oil saturation starts decreasing from the input side (Figure 7b). However, during the oil and water invasion at the 6thcycle, oil and water saturation at six regions of the microfluidic chip evenly increases or decreases(Figure 7c & 7d), and there is no significant difference in oil saturation degree between different regions in the microfluidic chip after the 1stcycle of injection.
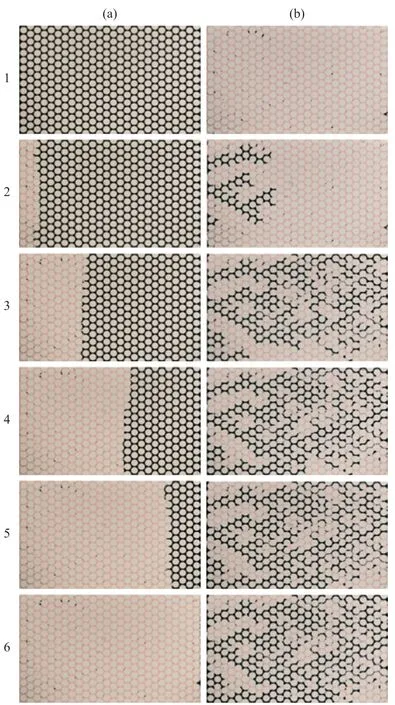
Figure 5 Oil and water invasion into a clean microfluidic chip during 1st cycle of injection(a) Oil invasion (from left boundary to right boundary) into water-saturated microfluidic chip; and (b) Water invasion (from left boundary to right boundary) into oil-invaded microfluidic chip. Note that oil is dyed as light red, and water is shown inblack. Fluid invades from left to right side.
This means that, during the oil (or water) invasion, oil(or water) quickly forms a flow channel by combining the already existing un-drained/isolated oil (or water)clusters without displacing the water (or oil) clusters.The pattern of the oil saturation variation during oil and water invasion for the SNP-coated and the TES-coated microfluidic chips is similar to the pattern in the clean microfluidic chip.
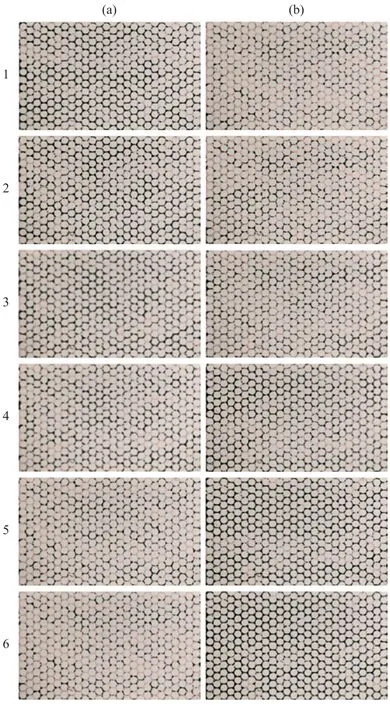
Figure 6 Oil and water invasion into a clean microfluidic chip during 6th cycle of injection(a) Oil invasion (from left boundary to right boundary) intowater-saturated microfluidic chip. (b) Water invasion (from left boundary to right boundary) into oil-invaded microfluidic chip.Note that oil is dyed as light red, and water is shown in black.Fluid invades from left to right side
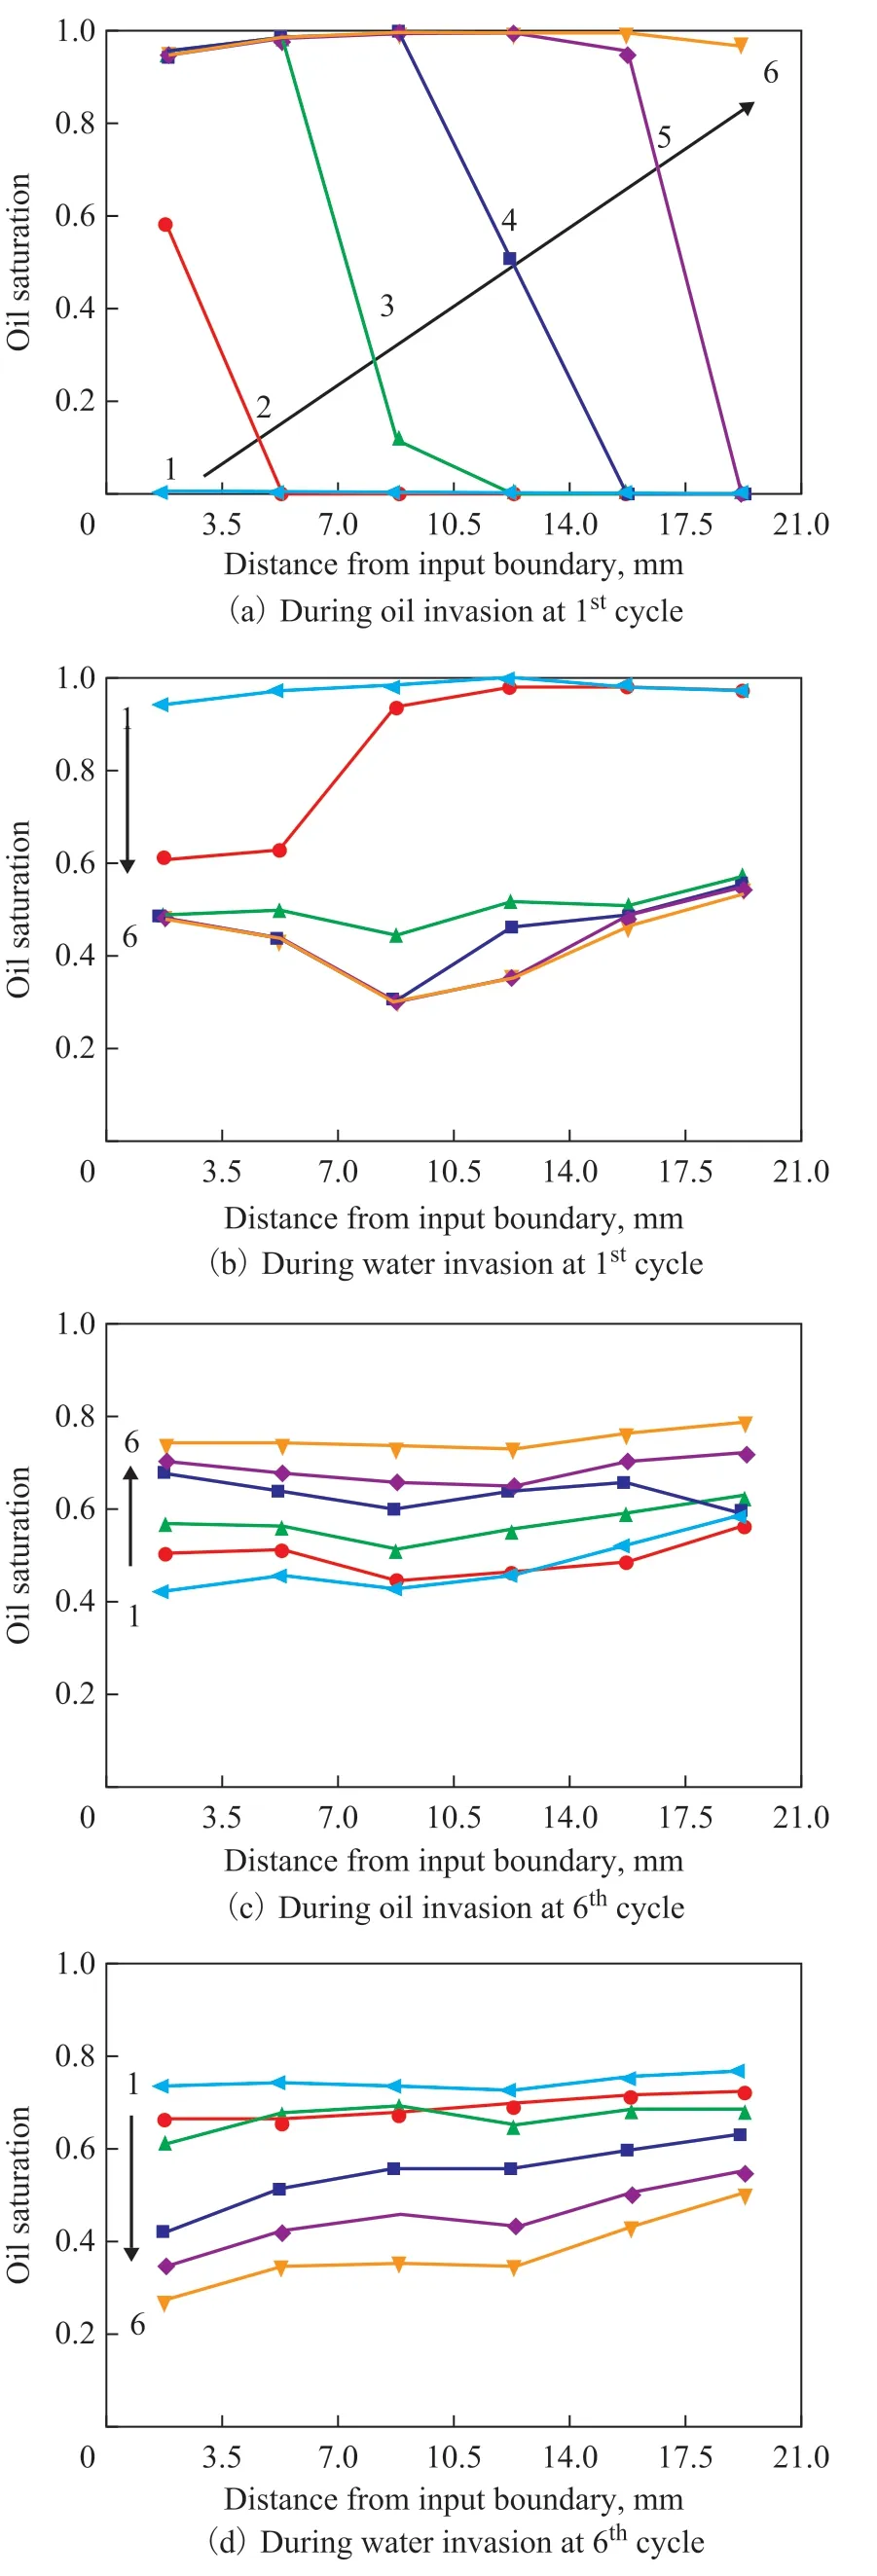
Figure 7 Oil saturation profile at different locations at the clean microfluidic chip during oil and water invasion
Typical images of oil and water pore-scale flow patterns are presented in Figure 8. The images show the oil and water invasion into the microfluidic chip at the 6thcycle. The images for the clean microfluidic chip show that the pore space of the microfluidic chip has a mixed wettability (Figure 8a): some pore spaces show the oilwet property and other parts of the pore space show the water-wet property. In addition, the interface between the water and oil phase is very rough possibly due to the inclusion of impurities such as red and blue dyes, and the shape of the oil or water clusters are elongated to form irregular shape. However, the SNP-coated microfluidic chip shows the water-wet surface all the time (Figure 8b).During oil invasion, most water is displaced because the viscosity of invading fluid is higher than the viscosity of defending fluid (stable displacement). After oil invasion,a thin water layer coated on the grain post is observed and narrow water menisci are frequently observed between grain posts. And the water clusters remaining in the pore space are not easily displaced further by continuous oil invasion. The images of oil and water invasion into the TES-coated microfluidic chip show the oil-wet surface (Figure 8c). During the oil invasion, the isolated water clusters tend to be mobilized by oil flow, and are sometimes drained out of the microfluidic chip through droplet movement motion. However, the isolated oil clusters in the TES-coated microfluidic chip do not tend to be mobilized during water invasion.

Figure 8 Pore-scale flow pattern at 6th cycle during oil and water invasion(a) Clean microfluidic chip; (b) SNP-coated microfluidic chip; and (c) TES-coated microfluidic chip.
4 Conclusions
The wettability of the clean, the SNP-coated, and the TES-coated substrates is investigated by measurement of contact angles for the combination of surrounding fluid-liquid droplets including air-water, air-oil, oilwater, and water-oil droplets. The SNP-coating increases the wettability of both water and oil droplets surrounded by air. The SNP-coating using the 1% SNP solution is more effective than the 25% SNP solution.The contact angle of a mineral oil droplet is even lower than the contact angle of a water droplet on the clean and the SNP-coated quartz substrates in air. The TEScoating increases the oil wettability and decreases the water wettability of the surface. The contact angle of a liquid droplet on a given substrate is affected by the surrounding fluid because of different interfacial tensions and buoyancy effect: for the TES-coated quartz substrate, the contact angle of an oil droplet is θ=17.7 in air and is θ=102.0 in water.
The oil and water alternate injection into the clean, the SNP-coated, and the TES-coated microfluidic chips shows that the oil and water saturation profiles (including the maximum and the minimum oil and water saturation)are very dependent on the wettability of the pore space in the microfluidic chip. For the clean microfluidic chip, the maximum oil saturation during the oil invasion decreases from So=0.99 at the 1stcycle to So=0.76 at the 5thcycle,and thereafter remains constant. The maximum oil saturation (average over 10 cycles) is So=0.9 for the SNPcoated microfluidic chip and So=0.8 for the TES-coated microfluidic chip. In other words, the minimum water saturation is Sw=0.1 for the SNP-coated microfluidic chip and is Sw=0.2 for the TES-coated microfluidic chip.And oil invasion (for the 1stcycle) can result in a high displacement efficiency (denoting a high oil saturation)because of a favorable viscosity ratio, logM=2.1>0.For the 1stcycle of injection, the oil or water saturation changes gradually from the input boundary to the output boundary as oil or water continues to invade. But for later cycles of injection, the oil or water saturation change does not show regional dependence.
Judging from the pore-scale fluid pattern investigation,the isolated water clusters tend to remain in the SNPcoated pore space during oil invasion, and the isolated oil clusters tend to remain in the TES-coated pore space during water invasion. This affects the fluid pattern and the oil and water saturation.
Acknowledgments:This study was supported by the research fund of the Korea Agency for Infrastructure Technology Advancement (19CTAP-C142849-02).
杂志排行
中国炼油与石油化工的其它文章
- Design, Optimization and Control of Extractive Distillation for Separation of Ethyl Acetate-Ethanol-Water Mixture Using Ionic Liquids
- Modeling of Continuous Cross-flow Microfiltration Process in an Airlift External-loop Slurry Reactor
- Effects of Nitrogen-Containing Biodegradation Enhancers on Sorption of n-Hexadecane in Soil-Water System
- Novel Approach for Improved Tribological Behavior of Biodiesel Soot in Liquid Paraffin
- Compatibility Evaluation between Direct Coal Liquefaction Residue and Bitumen
- Constant Volume Spray Auto-ignition Study of Alkanes
