Influence of Cr3+ Concentration on SO2 Removal over TiO2 Based Multi-walled Carbon Nanotubes
2019-05-10YangYanchunJiaFengruiJianWeiweiZhangShaopengMaDanzhuLiuGuangxin
Yang Yanchun; Jia Fengrui; Jian Weiwei; Zhang Shaopeng; Ma Danzhu; Liu Guangxin
(College of Petroleum Engineering, Liaoning Shihua University, Fushun 113001)
Abstract: In this study, titanium dioxide supported by multi-walled carbon nanotubes (MWCNTs/TiO2) and Cr-doped TiO2 supported by MWCNTs (MWCNTs/Cr-TiO2) were synthesized by the sol-gel method. The prepared samples were characterized by transmission electron microscopy, X-ray photoelectron spectroscopy, X-ray diffraction, the Brunauer-Emmett-Teller analysis, and the Raman spectroscopy. The oxidation and efficiency for removal of SO2 in a simulated flue gas were investigated experimentally in a fixed-bed reactor. The 15% MWCNTs/Cr-TiO2 sample displayed excellent adsorption properties, and a SO2 removal rate equating to 30.415 1 mg/g from the simulated flue gas containing 2 300 μg/g of SO2, 8% of O2, and 5% of H2O was achieved under optimal conditions covering a temperature of 333.15 K, and a space velocity of 1 275 h-1. The adsorption process was enhanced because Cr doping modified the pore structure and inhibited the grain growth of TiO2. In addition, the Freundlich and Langmuir models revealed that SO2 was mainly adsorbed through chemical adsorption on the sample surfaces, and the thermodynamic model analysis indicated that the adsorption was a spontaneous, exothermic, and entropy-reducing process. The adsorption kinetics of SO2 can be described by the pseudosecond-order kinetic and the Bangham dynamics models. The possible reaction mechanism involved in desulfurization process was also proposed.
Key words: MWCNTs/ TiO2; Cr doping; SO2 removal; oxidation
1 Introduction
The rapid industrial development in recent years has caused many environmental problems, in particular the emission of large amounts of industrial waste gases,including SOX, NOX, and volatile organic compounds(VOCs), which can adversely affect the human health and the environment[1-3]while also consuming abundant waste heat resources. These problems have raised the demand for energy conservation and emission reduction worldwide. Although the traditional wet flue gas desulfurization process can reduce emissions, it does so at the expense of full utilization of waste heat. Therefore,strategies for the removal of pollutants from dry flue gas must be developed in order to fully utilize the waste heat.In the dry flue gas desulfurization process, the adsorbent is the key component. At present, the adsorbents of carbon-based materials, particularly the carbon nanotubes(CNTs), have attracted considerable attention[4-6]as the most efficient catalysts for pollution abatement due to their large specific surface area, low cost,wide availability, and recyclability. Researchers have extensively explored the adsorption of],], rhodamine B and methyl orange[12],and methane and VOC gas molecules[13-14]on CNTs. In addition, CNTs exhibit strong adsorption affiliations to organic compounds, such as n-nonane and CCl4[15],thiophene[16], and PAHs[17]. The adsorption capacities of organic compounds onto CNTs are generally higher than that onto AC and other carbon adsorbents. Metal doping(such as Fe, Cu, Mn, Ni, and Ti) is an effective method for considerably increasing the oxidation ability of carbonaceous catalysts[18-23]. Nguyen, et al.[18]investigated the adsorption of CO2on catalytic systems comprising a transition metal (Fe, Co, or Ni) on CNTs using the density functional theory (DFT). Sampaio, et al.[19]prepared the Ti-loaded CNTs and used them for methylene blue decomposition. Wang, et al.[24]used the Ti-loaded CNTs to degrade 2,4-dinitrophenol. Tulaphol, et al.[25]embedded MWCNTs into SiO2particles and demonstrated that the supported adsorbents displayed excellent performance for adsorption of gaseous chlorinated phenolics. Yoosefia, et al.[26]demonstrated the adsorption of single and double SO2gas molecule(s) on the surface of the Pt-doped and Au-doped (5,5) single-walled CNTs (Pt/CNT-V and Au/CNT-V) by using the DFT. Shaari, et al.[27]successfully synthesized the novel adsorbents composed of the CNTsupported Ce-TiO2nanocomposites through a modified sol-gel method and analyzed the ultraviolet spectrum in a batch reactor. Their experimental results revealed that the nano-mixed materials significantly increased the efficiency for removal of phenol. Liu, et al.[28]utilized the Cu-doped TiO2on MWCNTs by the sol-gel method to remove SO2and found that the adsorption process showed an excellent desulfurization performance. Bao,et al.[29]synthesized the CNTs supported Mn-TiO2for SO2removal and confirmed that Mn-TiO2improved the desulfurization performance of MWCNTs.
Previous investigations have focused on the adsorption on CNTs or the metal doped-CNTs to evaluate the adsorption for industrial waste treatment. Few studies have highlighted the application of MWCNTs/Cr-TiO2for SO2removal. In this work, MWCNTs/Cr-TiO2samples were synthesized by the sol-gel method for use in SO2adsorption. The prepared samples were characterized by transmission electron microscopy (TEM), X-ray photoelectron spectroscopy (XPS), X-ray diffraction(XRD), the Brunauer-Emmett-Teller (BET) analysis,and the Raman spectroscopy to gain an insight into the surface structure and catalyst properties. A fixed-bed reaction system was used to examine the adsorption performance of the MWCNTs/Cr-TiO2adsorbent in flue gas. The effects of fixed-bed temperature, H2O content,space velocity, and Cr3+content on the adsorption of the samples were investigated. The adsorption equilibrium,adsorption thermodynamics, and adsorption kinetic models of the samples were investigated systematically.
2 Experimental
2.1 Chemicals
All chemicals used, including C16H36O4Ti, anhydrous ethanol, Cr(NO3)3, HNO3, and H2SO4, were commercial products purchased from the Nanjing Chemical Pharmaceutical Co., Ltd. The raw MWCNTs (with a purity of >95%, a diameter of 10—15 nm, and a length of 10 mm-30 mm) were provided by the Chengdu Organic Chemistry Co., Ltd., Chinese Academy of Sciences. The raw MWCNTs were acid-treated and functionalized in a mixture of concentrated sulfuric acid and nitric acid at a volume ratio of 3:1[30].
2.2 Preparation of the samples
The optimum MWCNTs/TiO2molar ratio was in the range of 1.5% to 5% by weight under the experimental conditions investigated[27,31]. MWCNTs/Cr-TiO2was synthesized by the sol-gel method using C16H36O4Ti serving as the Ti precursor, anhydrous ethanol, and Cr(NO3)3. In the typical synthesis of MWCNTs/Cr-TiO2with a molar fraction of Cr ranging from 1% to 15%(Cr:Ti; denoted as 1% MWCNTs/Cr-TiO2, 3% MWCNTs/Cr-TiO2, 7% MWCNTs/Cr-TiO2, and 15% MWCNTs/Cr-TiO2, respectively), 0.86 g of acid-treated MWCNTs was sonicated in a solution containing 75 mL of anhydrous ethanol, 25 mL of C16H36O4Ti, and 4 mL of HNO3(8 mol/L) under vigorous stirring. Then, the mixture was added to a solution containing 25 mL of anhydrous ethanol,5 mL of distilled water, and a certain amount of Cr(NO3)3(with the pH value adjusted to 2 by adding HNO3) under vigorous stirring. Then, the sol was allowed to stand for 2 h, dried at a constant temperature of 353.15 K for 15 h, and calcined at 773.15 K for 3 h at a heating rate of 10 K/min.
2.3 Flue gas desulfurization method
The schematic of the experiment system is described as follows. The system consisted of a gas supply, a fixed-bed reactor, and an analytical system. The simulated flue gas consisted of O2, H2O, SO2, and H2O balanced with N2. The flue gas was a cylinder gas (provided by the Shenyang Zhaote Company, China), and the constituents of flue gas were detected by a flue gas analyzer (Gasboard-300). The N2flow was divided into two streams. One of the streams was converged with SO2. The other stream was allowed to pass through a water bubbler to introduce a humid flow.The H2O content was controlled by the flow rate of N2and the temperature of the water bath, while the exact content was measured by a portable flue gas analyzer Testo-365(Detu Instrument International Trading Co., Ltd.,Germany). The fix-bed reaction tube consisted of a quartz tube with an inner diameter of 2.3 cm and a length of 70 cm. It was used to support the adsorbent at a distance of 35 cm from the bottom of the reaction tube. The quartz tube was placed inside a heating furnace equipped with a programmed temperature control function, which could realize an accurate temperature control.The experimental conditions are listed in Table 1. In this experiment, the SO2concentration in the mixed flue gas ranged from 1 200 μg/g to 2 600 μg/g. The baseline experiments were conducted in Case 1 to determine the desulfurization performance of different Cr loading on MWCNTs/TiO2. The effects of fix-bed temperature, H2O content, space velocity, and SO2content on SO2adsorption
were determined experimentally in Cases 2 to 5.

Table 1 Experimental condition
2.4 Characterization
The MWCNTs/Cr-TiO2samples were characterized by various analytic techniques. TEM observations were performed with a field emission electron microscope JEM-2100F (operating at 120 kV). The samples were sonicated in anhydrous ethanol and then were collected on a copper carbon-coated TEM grid. The chemical compositions of MWCNTs/Cr-TiO2were studied by the XPS analysis using a PHI Quanterall. The XRD patterns were recorded using a D/max-2 500/PC X-ray diffractometer with Cu Ka radiation ranging from 5 to 85 (2θ) at a scanning speed of 0.02 ()/s. The Raman spectra of the same samples were measured with a Raman spectrometer. The BET surface area of the MWCNTs/Cr-TiO2samples was determined using an Autosorb-IQ2-MP.
3 Results and Discussion
3.1 Characterizations of adsorption

Figure 1 TEM images of MWCNTs: (a) MWCNTs;(b) Acidified MWCNTs;, and (c) MWCNTs/TiO2
Figure 1 shows the TEM images of MWCNTs and MWCNTs/TiO2. As shown in Figure 1(a), the un-acidified MWCNTs were clustered, and single roots had long length.Figure 1(b) illustrates that the external diameter of the acid-treated MWCNTs was shorter than the un-acidified MWCNTs, and that acid treatment resulted in opening of the ends and breakage of the tubes[31]. Figure 1(c) reveals that MWCNTs were wrapped with TiO2, confirming the tight connection between MWCNTs and TiO2.The XPS analysis was conducted on the 15% MWCNTs/Cr-TiO2to study the surface chemical species. Figure 2(a)reveals the peaks corresponding to C, Ti, O, and Cr. The atom ratio of Cr to Ti was in the order of 14.7%, which was less than the theoretical value (15%). As for the 15% MWCNTs/Cr-TiO2, the nature and oxidation state of the Cr species were determined in the Cr2p spectrum.The binding energy of the Cr 2p3/2 and Cr2p1/2 peaks at 577 eV and 588.7 eV indicated the presence of Cr6+,and the peak at 586.4 eV was related to Cr3+[32]. The high resolution of C 1s in Figure 2(b) can be fitted to three peaks. The main peak was located at 284.6 eV, which was ascribed to the graphite carbon and C-C bonds from MWCNTs. The second peak at 285.9 eV was attributed to C-O bonds. In addition, the broad peak located at 288.1 eV represented C=O and COO bonds[33]. Three chemical states of oxygen were detected in the XPS spectra of O 1s (Figure 2(c)), viz.: the lattice oxygen(530.1 eV), the surface hydroxyl oxygen (531.1 eV), and the C-O bond (532.4 V), on the TiO2surface. Given that Ti-O and C-O bonds appeared in the XPS spectra of C 1s and O 1s after peak fitting, an intimate connection was anticipated between MWCNTs and TiO2through the Ti-OC bond. The results suggested that Cr existed in multivalent states on the TiO2surface. In the Ti2p spectra shown in Figure 2(d), the peaks of Ti 2p 3/2 and Ti 2p 1/2 for 15%MWCNTs/Cr-TiO2appeared at 458.6 eV and 464.35 eV,indicating the presence of typical Ti4+. Moreover, the binding energy of Ti 2p was reduced as compared to that of bare TiO2. When Cr was introduced, Ti4+was transformed partially to Ti3+. The appearance of Ti3+was responsible for the shift of Ti 2p to lower binding energy.

Figure 2 XPS survey spectra and C1s, O1s and Ti2p spectra of 15%MWCNTs/Cr-TiO2
Figure 3 shows the XRD patterns of the TiO2and MWCNTs/Cr-TiO2samples calcined at 773.15 K, The strong diffraction peaks of TiO2were found at 25.3,36.9, 37.9, 38.5, 48, 53.8, 55, 62.7, and 75.1,which respectively corresponded to the reflections from the (101), (103), (004), (112), (200), (105), (211),(204), and (215) crystal planes of the tetragonal TiO2structure mainly consisting of anatase phase. These Cr-doped samples mainly displayed an anatase phase,indicating that the anatase of TiO2was retained after Cr doping. However, the (101) peak of MWCNTs/TiO2was broader as compared with that of bare TiO2and was further broadened in the Cr-doped samples. Such peak broadening was possibly due to the reduction of crystallite size and lattice strain[34-35]. The results revealed that the introduction of MWCNTs and Cr doping restrained the grain growth of TiO2. No diffraction peaks were detected for MWCNTs between 5 and 85. To confirm the presence of MWCNTs at lower concentrations, the Raman spectra of MWCNTs/TiO2calcined at 773.15 K were obtained (Figure 3). Both the typical D and G bands for MWCNTs appeared. The D band located at 1 352 cm-1was assigned to the poorly organized graphite, whereas the G band at 1 591 cm-1corresponded to the sp2 bonding of crystalline graphite sheets.
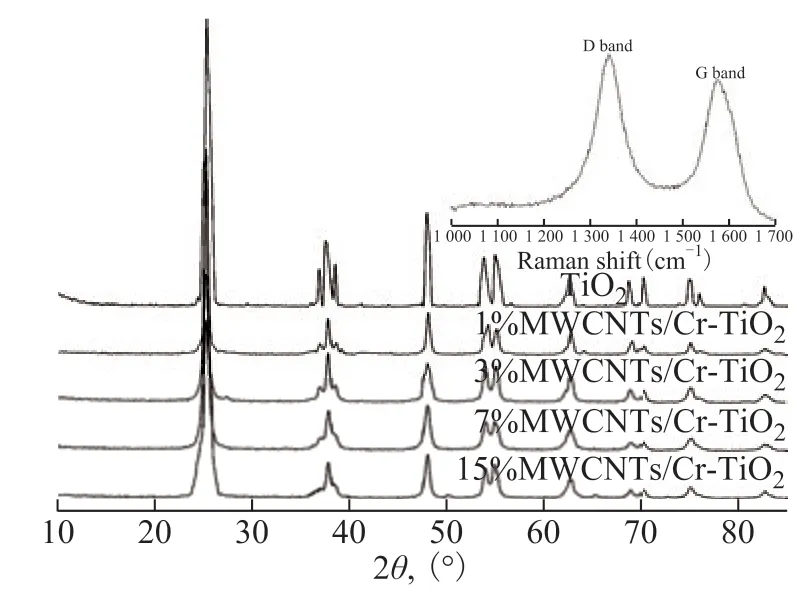
Figure 3 XRD and Raman patterns of samples
3.2 Experimental results
The breakthrough capacity of the sorbent (Q, mg/g) was calculated using the following formula:

where M is the molar weight of SO2, g/mol; C0is the concentration of SO2in the input stream; C is the detected concentration of SO2in the effluent gas, mg/m3; L is the flow rate of the mixed gas, L/min; m is the mass of adsorbent filled in the fixed-bed, g; and τ is the adsorption balance time of SO2, min. All experimental data were averaged over multiple experiments.
3.2.1 Fixed-bed temperature effect
The fixed-bed temperature critically affects the removal of SO2from flue gas in a fixed-bed. Figure 4 provides the fixed-bed temperature for SO2adsorption by 15%MWCNTs/Cr-TiO2. The test was performed at 333.15 K,353.15 K, and 375.15 K, respectively, while maintaining the other experimental variables unchanged. When the fixed-bed temperature was 333.15 K, the saturated adsorption capacity and the initial adsorption rate were 30.415 1 mg/g (at 245 min) and 0.29 mg/(g·min),respectively. The saturated adsorption capacity and the adsorption rate decreased by 8.683 5 mg/g and 0.021 5 mg/(g·min) for each 20 K increment in the fixed-bed temperature. At 333.15 K, the sample maintained a maximum adsorption rate from 0 min to 48 min. By contrast, at 375.15 K, the maximum adsorption rate was maintained for only 20 min. The surface of the adsorbent was first physically adsorbed and then oxidized to sulfuric acid by the adsorbent under the action of O2and H2O in the flue gas[36]. The fixed-bed temperature slightly affected the catalytic oxidation of the adsorbent but greatly influenced the physical adsorption of SO2,because the residence time of SO2on the adsorbent was inversely proportional to the temperature[37]. Hence, the physical adsorption of SO2was reduced, which directly affected the decline of chemical adsorption. SO2did not have enough time to convert into SO3. At the same time,the H2O content also decreased, which further prevented the conversion of SO3into H2SO4, leading to a gradual decrease in its saturated adsorption and adsorption rate.Thus, a relatively low fixed-bed temperature could enhance the SO2adsorption capacity and the adsorption rate of the sample.
3.2.2 H2O content effect
Many studies have confirmed the prominent role of H2O in the catalytic removal of SO2[28-29,38]. SO2removal was enhanced with an increasing H2O volume content, when the H2O content ranged from 1% to 5%. As shown in Figure 5, when the H2O content in the flue gas was 1%,the adsorption capacity of the sample was 15.901 5 mg/g,and the maximum adsorption rate was maintained for only 8 min. When the H2O content was 5%, the adsorption capacity was 30.415 1 mg/g, and the maximum adsorption rate was maintained for 48 min. H2O played an important role in the formation of hydroxide groups on the sample surface. The surface hydroxide groups not only could serve as the absorption sites for SO2but also could function as the hydrogen bonding sites for H2O, leading to formation of more hydroxide groups[39]. The formed-OH could oxidize SO2with high reactivity. When the volume fraction of the water vapor increased, SO2and water occupied the same active centers. Therefore, SO2was oxidized to SO3, which could easily combine with water to form H2SO4. Excessive water could elute H2SO4from the active centers, and the eluted H2SO4was stored in the pores of the adsorbent. The active centers were regenerated to continue the adsorption and oxidation of SO2. The increase in the H2O content in the flue gas had two main functions. On the one hand, the oxidized product SO3was hydrated to H2SO4. On the other hand,it could be eluted from the active centers to facilitate the continued adsorption of SO2. The results implied that within a certain range (1%-5%), the increase in H2O content promoted the flue gas desulfurization.

Figure 4 Fixed-bed temperature effect Adsorption rate:■—333.15 K; ●—353.15 K; ▲—375.15 K;Adsorption capacity:□—333.15 K; ○—353.15 K; △—375.15 K
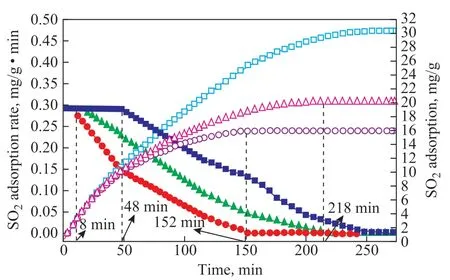
Figure 5 H2O content effectAdsorption rate:■—5%; ●—3%; ▲—10%;Adsorption capacity:□—5%; ○—3%; △—10%
3.2.3 Space velocity effect
The space velocity is the ratio of the flow rate of gas to the volume of adsorbent in unit time. During the experiment, the fixed-bed temperature was 333.15 K,and the simulated SO2concentration in the flue gas was 2 300 μg/g. Figure 6 shows the adsorption result of 15%MWCNTs/Cr-TiO2at a space velocity ranging from 1 275 h-1to 3 075 h-1. At the beginning of the experiment,the adsorption rates at 3 075 h-1rapidly decreased to 0 within 40 min, and the samples at a space velocity of 1 275 h-1and 2 338 h-1attained a saturated adsorption capacity within 152 min and 254 min, respectively.As the space velocity increased from 1 275 h-1to 3 075 h-1, the adsorption capacity decreased from 31.415 1 mg/g to 9.502 4 mg/g, whereas the adsorption capacity rate increased from 0.29 mg/(g·min) to 0.475 mg/(g·min). SO2removal by adsorption in the presence of oxygen and water covered mainly three steps[40], viz.: (a) adsorption of the flue gas; (b) catalytic conversion of SO2into SO3, followed by adsorption to H2SO4; and (c) desorption of H2SO4from the surface.With an increasing space velocity, the step (b) became determinant, and SO2would spend less time in the fixed bed. Given the reduced retention time of SO2, the reactants could not be adsorbed quickly on the surface,and the oxidation of SO2to form SO3would not occur,leading to a reduced sulfur retention. The microscopic response of space velocity was resulted from the heat and mass transfer of the adsorbent component on the surface of the adsorbent[41]. A smaller space velocity corresponded to a lesser heat and mass transfer effect on the adsorption efficiency in terms of the adsorbed components. The experiments suggested that it was evident when the space velocity changed from 127 5 h-1to 307 5 h-1, a low space velocity could increase the SO2adsorption capacity and the adsorption rate of the sample.
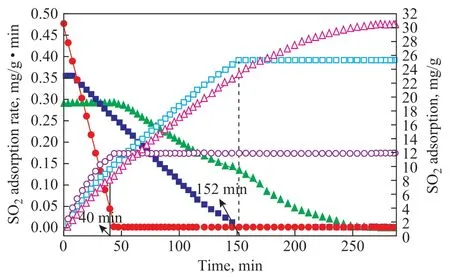
Figure 6 Space velocity effectAdsorption rate:■—2 338 h-1; ●—3 507 h-1; ▲—1 275 h-1;Adsorption capacity:□—2 338 h-1; ○—3507 h-1; △—1 275 h-1
3.2.4 Cr3+content effect
To evaluate the adsorption performance of samples for treating SO2, experiments were performed on TiO2,MWCNTs, and MWCNTs/Cr-TiO2(1%, 3%, 7%, and 15%). Figure 7(a) shows that obviously, as the amount of Cr increased from 1% to 15%, the adsorption capacity of MWCNTs/Cr-TiO2gradually increased to 30.415 1 mg/g and the maximum adsorption rate also gradually increased to 0.29 mg/(g·min) and lasted for 48 minutes. In Figure 7(b), the adsorption capacity of pure TiO2and MWCNTs was 2.522 3 mg/g and 19.746 0 mg/g, respectively.
The enhancement of the adsorption capacity of 15% MWCNTs/Cr-TiO2might be attributed to a combination of factors. The XPS analysis confirmed the presence of surface defects due to the partial transfer of Ti4+to Ti3+. These surface defects acted as adsorption sites for SO2. Moreover, the Crn+inside TiO2could serve as both the electron and hole traps.Crn+trapped electrons and holes to form Cr(n-1)+and Cr(n+1)+and to generate superoxide or hydroxyl radicals.The improved adsorption ability of 15% MWCNTs/Cr-TiO2might be ascribed to modifications of the surface structures. Given that the atom ratio of Cr to Ti detected on the sample surface was less than the theoretical value on 15% MWCNTs/Cr-TiO2, a portion of Cr species (Cr3+and Cr6+) were believed to be incorporated into the TiO2lattice. The XRD analysis indicated that the crystallite size of the samples decreased in the Cr-doped samples as compared with those in pure TiO2. Table 2 shows the specific surface area and pore size of MWCNTs,TiO2, and MWCNTs/Cr-TiO2(1%, 3%, 7%, and 15%)obtained by the BET analysis. A smaller pore size induced a growth of the specific surface area, resulting in more structural defects and surface absorption sites.In other words, the amount of surface oxygen vacancies increased on the sample surface. In view of the strong oxidizing properties of Cr3+and Cr6+[32], as the Cr content increased, the oxidizability of the sample increased,resulting in an increased sulfur capacity of the sample.Therefore, a high Cr molar fraction in MWCNTs/TiO2within the range of 1%-15% (Cr:Ti) could increase the SO2adsorption capacity and adsorption rate of the sample.

Figure 7 (a)Cr3+concentration effect; (b)adsorptioncapacity
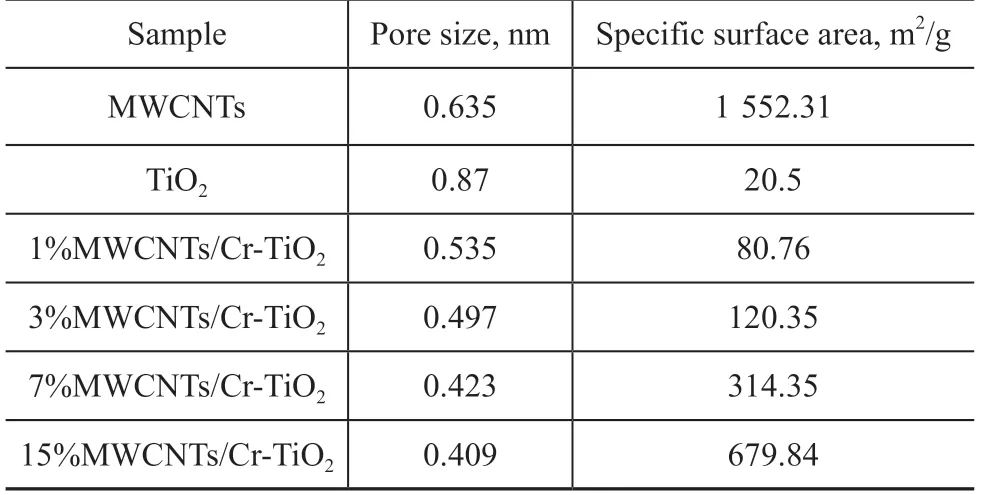
Table 2 Pore size and specific surface area for different samples
4 Adsorption Isotherm Model Analysis
4.1 Analytical adsorption equilibrium model
To better elucidate the mechanism for adsorption of SO2over MWCNTs/Cr-TiO2, the commonly used Langmuir and Freundlich models[42-43]were adopted to simulate the experimental data. Figure 8 shows the linearized form of Freundlich and Langmuir isotherms. The Langmuir isotherm equation is:

where Ce(mg/m3) and qe(mg/g) are the equilibrium adsorption concentration in the flue gas and the adsorption capacity of the adsorbent at equilibrium state, respectively.KL(m3/g) is the equilibrium adsorption constant, and qm(mg/g) reflects the maximum adsorption capacity.
The Freundlich isotherm equation is:

where KF(mg·(m3)1/n)/(g·g1/n) is the Freundlich constant, and 1/n, between 0 and 1, reflects the adsorption intensity or surface heterogeneity. The adsorption isotherm can provide further information on the adsorption behavior of an adsorbent.Figure 8 shows the adsorption isotherms of adsorbents at different temperatures. Table 3 lists the parameters, which were obtained by fitting the experimental data with both models. As shown in Table 3, the R2values of the Langmuir and Freundlich models were higher than 0.98, suggesting that both can predict the SO2adsorption equilibrium on the sample surface and that the adsorption process of the sample was dominated by chemical adsorption. As the temperature increased, qmdecreased. Thus, an increased temperature was not conducive to the reaction.

Table 3 The parameters of 15%MWCNTs/Cr-TiO2 isothermal adsorption model fitting

Figure 8 Langmuir model and Freundlich model■—333.15 K; ●—353.15 K; ▲—373.15 K
4.2 Adsorption thermodynamic analysis
In this study, experiments were conducted at the fixedbed temperatures of 333.15 K, 353.15 K, and 373.15 K,respectively, to determine the most favorable adsorption temperature. Variations in the thermodynamic parameters of the adsorption process were generally calculated using the Gibbs and van’t Hoff equations[44].

where ΔG is the free energy of adsorption; ΔH is the change in adsorption enthalpy, kJ/mol; ΔS is the adsorption entropy, kJ/(mol·K); K is the Langmuir constant; and R is the universal gas constant,8.3143 J/(mol·K).

Table 4 Thermodynamic parameters of adsorption process at different fix-bed temperatures
As shown in Fig. 9, low temperature favored the progress of SO2adsorption. The most favorable adsorption temperature was 333.15 K. The thermodynamic adsorption parameters of the sample for SO2can be calculated based on the fitting results, as shown in Table 4. ΔH was -43.64 kJ/mol, and ΔS was -21.06 J/(mol·K).As shown in Table 4, the free energy of adsorption, ΔG,became negative, indicating that the adsorption of SO2by the sample was a spontaneous process. In addition,as the temperature increased, the absolute value of ΔG decreased, indicating that with the increase of adsorption temperature, the spontaneous tendency of the adsorption process decreased, suggesting that a temperature increase was not conducive to adsorption process. The change in adsorption enthalpy was negative, indicating that the adsorption process was an exothermic reaction.The negative change in entropy (ΔS) reflected the decreased randomness on the adsorbent during the adsorption process. The decrease in the degree of freedom of the adsorbate molecules was not conducive to adsorption.
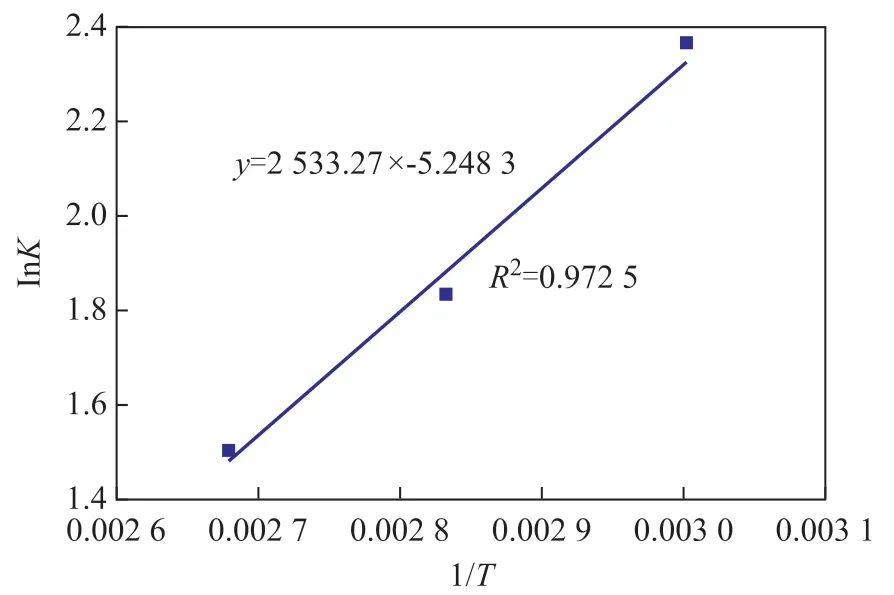
Figure 9 The relationship of lnK to 1/T of SO2 adsorption on 15% MWCNTs/Cr-TiO2■—Exp.data;—Fitting line
4.3 Kinetic adsorption model
The kinetics of the adsorption of SO2onto MWCNTs/Cr-TiO2(1%, 3%, 7%, and 15%) were modeled using a pseudo-first-order model (Eq. (5)), a pseudo-second-order model (Eq. (6)), a Bangham kinetics model (Eq. (7)), an Elovich model (Eq. (8)), and an intraparticle diffusion model (Eq. (9)) kinetic equation[45-46], respectively:


where qt(mg/g) and qe(mg/g) are the uptake of SO2at a time t and at equilibrium, and k1(min-1) and k2(g/mg·min) are the rate constants of pseudo-first-order and pseudo second-order models, respectively. k4(mg/(g·min0.5)) is the intra-particle diffusion rate constant, and a, b, k3, and c are constants. The best fit model was chosen based on the values of the regression coefficient (R2) of the linear plots of all kinetic model equations. By using the different kinetic mechanism models, the dynamic data under different conditions were linearly fitted, and the rationality of the model was determined according to the linear correlation. After a comprehensive evaluation, the optimal kinetic adsorption model was selected. Different fixedbed temperatures corresponded to different adsorption parameters, and a higher correlation coefficient R2corresponded to a better fitting effect. Figure 10 and Table 5 show the kinetic adsorption model fitting curve and corresponding parameters for each sample, respectively.Both the pseudo-second-order kinetic model and the Bangham model had a large linear correlation coefficient(R2) of 0.99. Among them, the pseudo-second-order kinetic model had the highest linear correlation coefficient. As shown in Fig. 10, the pseudo-second-order kinetic model fitted line passed nearly all data points, indicating that the dynamic adsorption process of SO2on MWCNTs/Cr-TiO2in the fix-bed could be described by the pseudo-secondorder kinetic model and the Bangham model.
5 Reaction Mechanism
A simplified mechanism for the SO2removal is shown in Figure 11. When Cr was introduced, Cr ions would preferentially reside at the interstitial positions of the TiO2lattice or be loaded on the TiO2surface. The newly formed impurity levels of CrO3and Cr2O3between TiO2and MWCNTs provided several adsorption sites. The surface properties are fundamental for desulfurization. SO2was adsorbed mainly in oxygen vacancies and with hydroxyl groups. Oxygen vacancies were dispersed on the surface and were responsible for adsorption of O2,H2O, and SO2. When H2O was adsorbed in oxygen vacancies, surface hydroxide groups were formed due to water dissociation. SO2was adsorbed mainly through interactions with surface hydroxide groups[47].Oxygen vacancies and surface hydroxide groups acted not only as adsorption sites but also as reaction sites that were involved in the formation of -OH, O2-, and O-. Sulfite was formed through SO2reaction with oxygen vacancies and surface hydroxide groups, and it was further oxidized to sulfate, upon being exposed to -OH and O-species (formed through oxygen dissociation in oxygen vacancies).
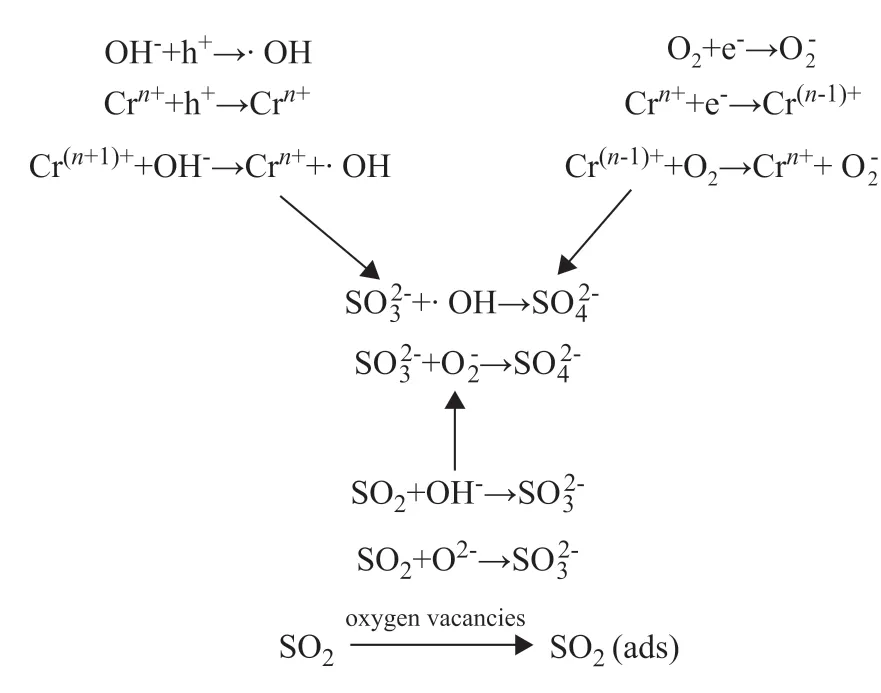
Figure 11 Reaction mechanism

Figure 10 Calculated results of different models□—15%MWCNTs/Cr-TiO2; ○—7%MWCNTs/Cr-TiO2; △—3%MWCNTs/Cr-TiO2; ▽—1%MWCNTs/Cr-TiO2

Table 5 The parameters of MWCNTs/Cr-TiO2 (1%, 3%, 7%, and 15%) kinetics adsorption model fitting
6 Conclusions
In this study, MWCNTs/Cr-TiO2was synthesized by the sol-gel method and was characterized by TEM, XPS,XRD, Raman spectroscopy, and BET analysis. The results revealed that MWCNTs were wrapped with TiO2and Cr. The XRD analysis indicated that MWCNTs/Cr-TiO2consisted mainly of the anatase phase. The introduction of Cr ions decreased the pore size of MWCNTs/TiO2, which contributed to the large specific surface area for adsorption.On the basis of the desulfurization experiments, the following can be concluded. The 15% MWCNTs/Cr-TiO2catalyst exhibited superior desulfurizing properties compared with those with other different Cr concentrations, TiO2, and MWCNTs. The optimum operating conditions covered a fixed-bed temperature of 333.15 K, a H2O content of 5%;and a space velocity of 1 275 h-1. Under these conditions, the sulfur retention reached 30.415 1 mg/g.
In addition, both the Langmuir and Freundlich models could predict the SO2adsorption equilibrium on the surfaces of 15% MWCNTs/Cr-TiO2(R2>0.98) and validated that the SO2adsorbed on the sample surfaces was mainly realized via chemical adsorption. The adsorption thermodynamics analysis showed that the changes in the free energy of adsorption, adsorption pickup, and adsorption entropy were negative. Therefore,the SO2adsorption onto the sample was a spontaneous,exothermic, and entropy-reducing process, in which an increased temperature was not conducive to the adsorption process. Furthermore, the adsorption kinetics model analysis revealed that the pseudo-second-order model and the Bangham model (R2>0.98) could predict the dynamic adsorption of MWCNTs/Cr-TiO2.
Acknowledgement:This work was financially supported by the National Natural Science Foundation of China (No.51706091), the Open Foundation of Key Laboratory of Industrial Ecology and Environmental Engineering, MOE of China (No. KLIEEE-18-04), the Talent Scientific Research Fund of LSHU(No. 2018XJJ-011), and the PhD Research Startup Foundation of Liaoning Shihua University (No. 2016XJJ-025).
杂志排行
中国炼油与石油化工的其它文章
- Novel NiMo Catalysts Supported on Sol-Gel Nanosized HY Zeolite-Alumina Composites for Hydrodesulfurization of Diesel
- Catalytic Cracking Characteristics of Plant Oil for Producing Light Olefins and Light Aromatics
- Polycrystalline Phase WO3/g-C3N4 as a High Efficient Catalyst for Removal of DBT in Model Oil
- Phosphorous-Modified Carbon Nanotube-Supported Pt Nanoparticles for Propane Dehydrogenation Reaction
- Design, Optimization and Control of Extractive Distillation for Separation of Ethyl Acetate-Ethanol-Water Mixture Using Ionic Liquids
- Kinetic Model of Hydrogenation for Removal of Trace Olefins from Alkylation Mixture Formed during Linear Alkylbenzene Synthesis
