Electrokinetic flow in the U-shaped micro-nanochannels
2019-03-07BilongQiuLingynGongZiruiLiJongyoonHn
Bilong Qiu, Lingyn Gong, Zirui Li,*, Jongyoon Hn,b,c
a Institute of Laser and Optoelectronic Intelligent Manufacturing, College of Mechanical and Electrical Engineering, Wenzhou University,Wenzhou, 325000, China
b Department of Electrical Engineering and Computer Science, Massachusetts Institute of Technology, Cambridge, Massachusetts, 02139,USA
c Department of Biological Engineering, Massachusetts Institute of Technology, Cambridge, Massachusetts, 02139, USA
Keywords:U-shaped micro-nanochannels Electrokinetic flow Maximum shear stress
ABSTRACT U-shaped micro-nanochannels can generate significant flow disturbance as well as locally amplified electric field, which gives itself potential to be microfluidic mixers, electrokinetic pumps,and even cell lysis process. Numerical simulation is utilized in this work to study the hidden characteristics of the U-shaped micro-nanochannel system, and the effects of key controlling parameters (the external voltage and pressure) on the device output metrics (current, maximum values of electric field, shear stress and flow velocity) were evaluated. A large portion of current flowing through the whole system goes through the nanochannels, rather than the middle part of the microchannel, with its value increasing linearly with the increase of voltage. Due to the local ion depletion near micro-nanofluidic junction, significantly enhanced electric field (as much as 15 fold at V=1 V and P0=0) as well as strong shear stress (leading to electrokinetic flow) is generated.With increasing external pressure, both electric field and shear stress can be increased initially(due to shortening of depletion region length), but are suppressed eventually at higher pressure due to the destruction of ion depletion layer. Insights gained from this study could be useful for designing nonlinear electrokinetic pumps and other systems.
In recent years, with the rapid development of micro and nanotechnologies, various microfluidic systems have been developed to realize novel applications in a wide range of fields, especially in chemical and biological analysis [1-3]. As an important branch of microfluidic system, micro-nanochannels, typically composed of two microchannels bridged by a series of nanochannels or ion selective membranes, have shown great potential in bio-molecules preconcentration [4-6]. The key mechanism in such systems is the electric field-driven selective charge transport through the nanochannels (or permselective membranes), facilitated by the electrical double layer which is induced by the charge carried by the walls. If, for example,cations are transported out of a microchannel through nanochannels by a strong external electric field, concentrations of both cations and anions decrease to near zero (forming an ion depletion zone) near the junction of microchannel and the nanochannels, while increases (forming an ion enrichment zone) at the other end of the nanochannels. This phenomenon is called ion concentration polarization (ICP) [7]. At this specific location, the electric field is significantly amplified, hindering the motion of all negatively charged species, thereby resulting in the local enrichment of negatively charged molecules [8]. A million-fold enrichment in front of the nanochannels has been experimentally proved to be achievable [4]. By contrast, the concentration in the downstream microchannel is extremely low,i.e. the downstream solution is desalinated [9]. Together with the amplified electric field [10], an extended space charge is formed there [11], giving rise to a strong vortical fluid flow [12]. This unique fluid phenomenon could find applications in fluid pumping [13] and mixing [14-16]. In addition, the combination of strong electric field and vortical flow can be utilized for effective cell lysis, for both analytical and disinfection purposes [17].Yet, there has been no detailed study and modeling of these applications of ICP-generating micro-nanochannel systems.
In this study, the mechanism of a U-shaped micronanochannel system is studied via numerical simulation.
We simplified the mixer proposed by Kim et al. [14] and obtained the simulation model of this paper. This design is simple and practical with only 2 reservoirs, with single values of voltage and pressure to control, and therefore used by many researchers previously. Yet, there has been no detailed parametric studies and modeling reported, because the electrokinetic behaviors of the system are quite diverse and non-intuitive, including the distributions of fluid velocity and ion concentrations over the microchannel, dependences of the current and the maximum shear stress on the external voltage and the external pressure.
Figure 1 shows the schematic diagram of two-dimensional(2D) U-shaped micro-nanochannels. The solution inside is potassium chloride (KCl) with the concentration C0= 1 mM. A square reservoir with sides Ls= 2 μm is connected to each end of the U-shaped microchannel. Two straight arms of the U-shaped channel of length Lm= 100 μm and width Wm= 1 μm are linked by an array of nanochannels (7 single channels). The width and length of each nanochannel are 10 nm and 2 μm, respectively,with the distance between the neighbouring nanochannels being 100 nm. The center of the nanochannels array is located at x = 60.04 μm. The curved part of the microchannel is composed of two concentric semicircles of diameter dw=2 μm (the same as the length of the nanochannels) and Dw= 4 μm, respectively.The U-shaped channel walls are negatively charged with surface charge density σ-= 5 mC/m2. The walls of the reservoirs are not charged.
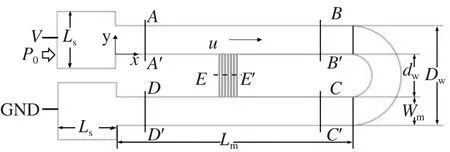
Fig. 1.Schematic diagram of the U-shaped micro-nanochannels.Cross section A-A' is located at x=10 μm, B-B' at x=90 μm, C-C' at x=90 μm, D-D' at x=10 μm, and E-E' at y=-1 μm.
A pressure P0and a voltage V (>0) are applied to the left boundary of the upper reservoir. And the boundary of lower reservoir is grounded. With such configuration, rightward electroosmotic flow (EOF) [18], with an average velocity, is induced in the upper part of the microchannel (leftward in the lower part). Therefore, the left boundaries of the upper reservoir and the lower one are named, respectively, the inlet and the outlet. The part of microchannel between the inlet reservoir and the upper micro-nanofluidic junction (s=0~60.61 μm) is referred to as the inlet part (), the part between the outlet reservoir and the lower micro-nanofluidic junction (s=145~205 μm) as the outlet part (), and the part located between two micro-nanofluidic junctions as the middle part (). The pressure and the voltage are modulated to study their effects on the system behavior. Some unique features of this system are figured out at the meantime.
In our simulation, the fluid flow is described by incompressible Navier-Stokes equations (Eqs. (1) and (2)). Transport of ions is governed by the Nernst-Planck equations (Eqs. (3) and (4)).The distribution of the electric potential is governed by the Poisson equation (Eq. (5)) [19, 20]. Since only KCl buffer solution is used in this paper, the chemical valence in the following is expressed as ±1.
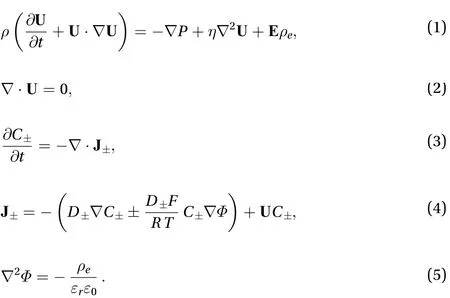
In the momentum equation (Eq. (1)) and the incompressibility equation (Eq. (2)), t is the timeis the fluid density; U ≡ (u, v) is the velocity vector of the fluid; P is the pressure;is the fluid viscosity;≡ (Ex,Ey) is the electric field anddenotes the space charge density. In ion conservation equation (Eq. (3)), C±and≡ (J±x,J±y) are the concentrations and flux densities of K+and Cl-, respectively. In the ion transport equation (Eq. (4)),D±and μ±=±D±F/(RT) are the diffusion coefficients and the electrophoretic mobility of K+and Cl-, respectively, where F, R and T are Faraday's constant, gas constant and the absolute temperature, respectively. In the Poisson equation (Eq. (5)),is the electric potential;is the relative dielectric constant,is the vacuum permittivity. The relationship between the electric field and the electric potential is=-∇Φ. The space charge density is given by ρe=F(C+-C-).
At the inlet boundary, we set C+=C-=C0, the diffusion coefficients of ions are D+=1.957×10⁻⁹m2/s (K+), D-=2.032×10⁻⁹m2/s(Cl-) [21]; The density of the electrolyte solution is=1000 kg/m3,the viscosity is=0.001 Pa·s; The relative dielectric constant=78 and the temperature of the system is T=300 K.
Governing equations (Eqs. (1)-(5)) are solved using COMSOL v5.2a with the boundary conditions of external pressures at inlet and outlet boundaries; no-slip and no flux condition on all channel walls, constant concentration at the inlet, external voltages at inlet and outlet etc. Readers may refer to Ref. [22] for detailed description of the numerical methods.
Basic mechanisms of this system are first elaborated. The ion concentration polarization would not occur if no external voltage is applied. With an external voltage applied to the system, the cations tend to enter the downstream through the nanochannels, driven by electric field force, thereby leading to the formation ICP, as shown in Fig. 2(a). It is shown that the concentration near the upper micro-nanofluidic junction is much lower than near the lower micro-nanofluidic junction. A low concentration region, or the ion depletion zone, forms in front of the upper micro-nanofluidic junction. This ion depletion zone expands to the downstream microchannel along the fluid flow.When the diluted fluid goes closer to the lower micro-nanofluidic junction that located in the downstream, concentration gradually increases to a level which is nearly the same as that in the inlet solution. This is because the diluted solution is compensated by the abundance of ions in the ion enrichment zone,which is formed near the lower micro-nanofluidic junction at steady state. The arrows in Fig. 2(a) demonstrate the fluid flow. It is notable that a vortex forms in front of the upper nano-microchannel junction. This vortex acts as a pump, pushing the fluid going forward [13]. Figure 2(b) illustrates the electric potential distribution and the axial component of the electric field along the central line of the microchannel at V=1 V and P0=0.The electric potential in the entire microchannel decreases, in the direction of the fluid flow, to 0. It is noticeable that the most significant potential drop, which corresponds to the local amplification of electric field (one can achieve 15 fold increase in the generated local field), occurs in front of the upper micro-nanofluidic junction, owing to the dramatically decline of ion concentration there. Figure 2(c) shows the pressure distribution in the microchannel at V=1 V and P0=0. The pressure increase in the middle part (acting as a pump) is particularly high (~400 Pa). In contrast, because of the extremely low concentration (~0.02 mM) (see Fig. 2(a)) and small electric field (~3000 V/m) (see Fig.2(b)) in the curved part of the microchannel, the fluid there is almost free from the electric body force. Therefore, it is revealed that almost all of the pumping (shear stress) is generated at the micro-nanofluidic junction region as shown in Fig. 2(c).
Figure 3 shows the curves of average concentrations versus the applied voltage on cross sections A-A', B-B', C-C' and D-D' at P0=0. As shown in Fig. 3, in low voltage regime (V<0.3 V), the concentrations of B-B', C-C' and D-D' increases with V, while the concentration of A-A' decreases slightly from 1 mM to 0.9 mM.The former is the result of the continuous diffusion of ions from the ion enrichment zone, and the latter is due to the forward expansion of the ion depletion zone. At this moment, the EOF is still not high enough to realize the expansion of the ion depletion zone to the downstream. As V increases, both the transport of ions through the nanochannels and the EOF are enhanced,leading to a strengthened ion depletion zone and thereby a lower concentration at B-B'. This low concentration region is expanded to C-C' by the increased fluid flow, therefore the concentrations at B-B', C-C' and D-D' all go down. It's noticeable that when the voltage increases above 1 V, the concentrations at B-B'and C-C' decrease to approximately 0, indicating that there are almost no ions in the curved part of the microchannel. It is safe to conclude that the middle part of the microchannel is suitable for processing some neutral particles. As a consequence, under such conditions, the concentrations at A-A' and D-D' keep constant at 1 mM (both equal to the initial value).
Figure 4 shows the dependence of velocity on V at P0=0.represents the average velocity at the outlet of the micro-nano system. Electroosmotic flow of the first kind (EOF1), proportional to V, represents the average velocity at the outlet of the system without nanochannels with the same parameters, i.e. the portion of the overall velocityfor which EOF accounts. When V<0.3 V, the vortex at the micro-nanofluidic junction has not been generated, sois almost identical to EOF1. When V further increases, the vortex at the micro-nanofluidic junction forms, acting as a pump;therefore presents a linear growth trend as well. Since the vortex tends to get stronger as V rises, the gap betweenand EOF1 increases from 50 μm/s at V=0.5 V to 310 μm/s at V=2 V.
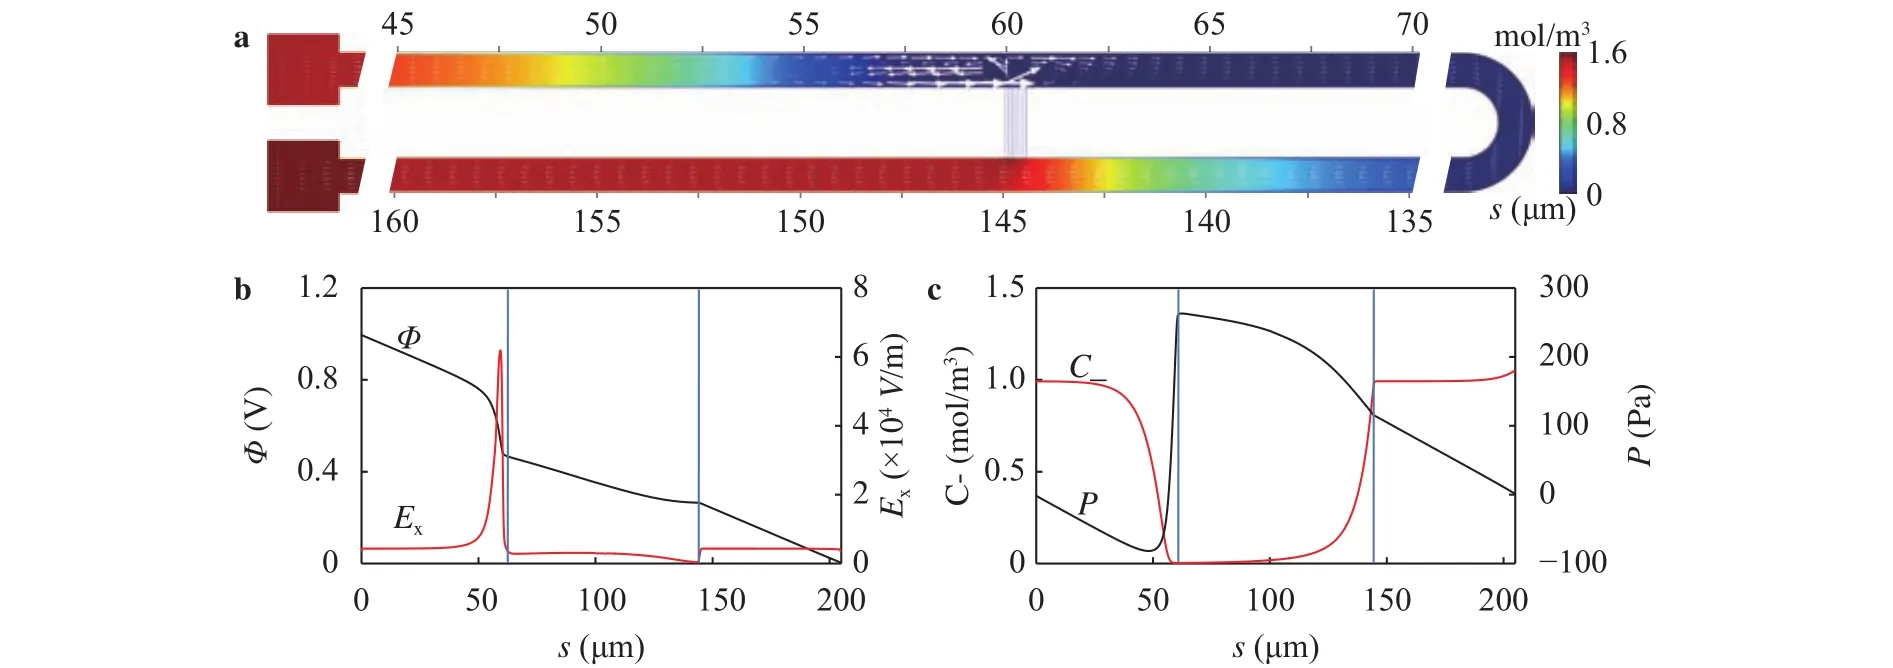
Fig. 2.a The concentration of Cl- (background color) and flow field distribution (arrows) throughout the system at V=1 V and P0=0. (The white arrows indicate the direction and magnitude of the velocity.) b The electric potential and the axial component of the electric field along the central line of the microchannel at V=1 V and P0=0. c The distributions of the ion concentration and the pressure along the central line of the microchannel at V=1 V and P0=0. (s is the distance that the fluid flows through from the inlet. Two light blue dashed lines represent the locations of micro-nanofluidic junctions.)
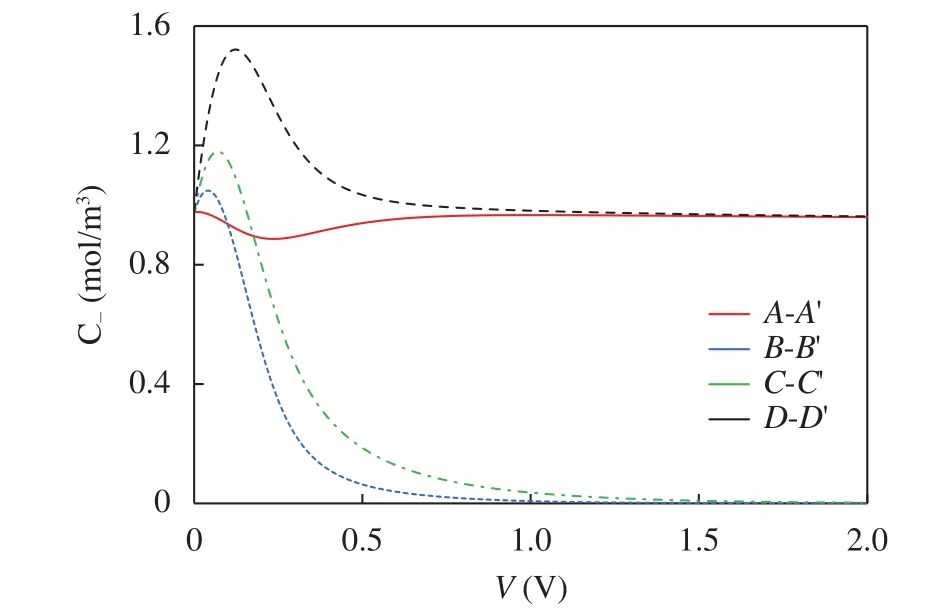
Fig. 3.Dependence of average concentrations over the cross sections A-A', B-B', C-C', D-D' on V at P0=0.
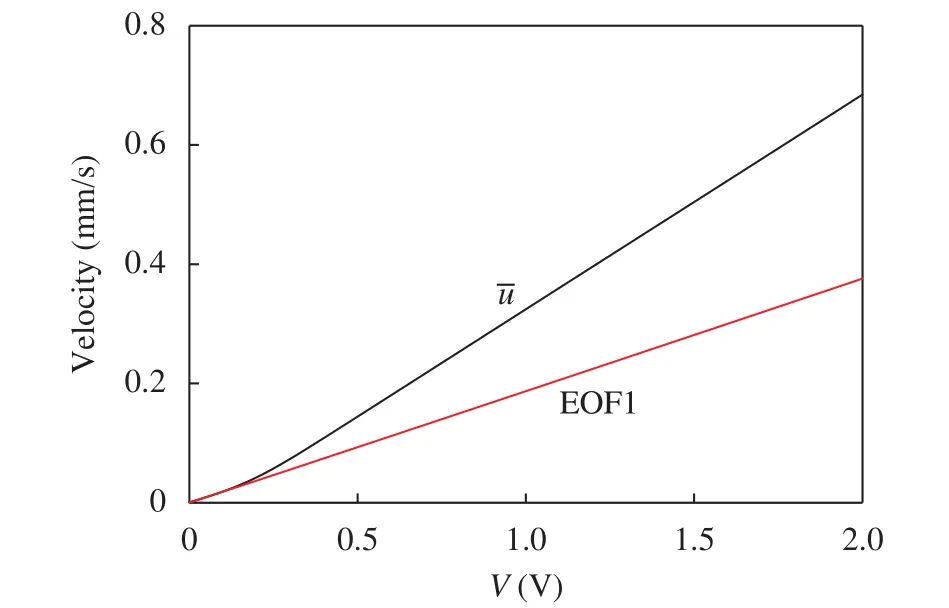
Fig. 4. represents the average velocity at the outlet of the micronano system at P0=0; EOF1 represents the average velocity at the outlet of the system without nanochannels at P0=0.
Current is one of the vital parameters that reveal the system behavior. To study the current-voltage relationship in a U-shaped micro-nanofluidic system, the system is assumed to be equivalent to a circuit, in which seven nanochannels are in parallel with the middle part of the microchannel, and in series with the inlet and outlet parts. Assume the depth of our 2D model lz=1 m, then the equivalent current I of each part can be obtained by the following Eqs. (6)-(8):
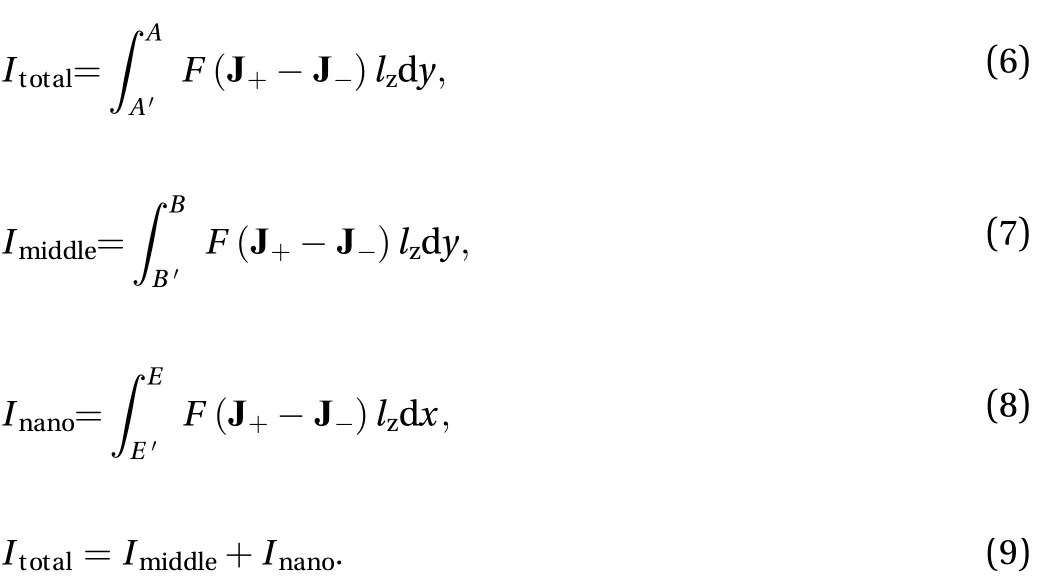
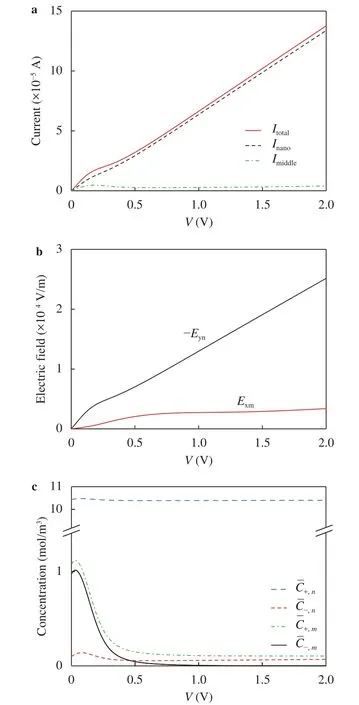
Fig. 5.Dependence of (a) the overall current Itotal, the current of the middle part Imiddle and the current of the nanochannels Inano, (b) the electric field in the nanochannels -Eyn and in the middle part Exm, (c)the average ion concentration in the nanochannels and middle part on V at P0=0.
Equation (9) describes the quantitative relationship between Itotal, Imiddle, and Inano. Figure 5(a) shows the curves of the overall current Itotal, the current of the nanochannels Inanoand the current of the middle part Imiddleversus the voltage V at P0=0. The current flowing from the inlet to the outlet is specified to be positive. Itotalgoes up linearly from 0 A at V=0 V to 1.4×10⁻⁴A at V=2 V. Most of the current passes through the nanochannels with only a negligibly small potion passing through the middle part.
Current largely depends on the electric field and ion concentration of each part. Because the currents of any sections in the middle part are identical, the values of parameters obtained in the region s=60.61-100 μm are correspondingly used to represent those in the middle part and then to be compared with the results in nanochannels. Figure 5(b) shows the dependence of the electric fields in the nanochannels -Eynand in the middle part Exmon V at P0=0. It can be observed that -Eynis always greater than Exm. The electric potential decreases along both the microchannel and the nanochannels from the upper micro-nano junction to the lower one. The magnitudes of the potential drop along these two routes are same when a certain V is applied,while the length of the middle part is much longer than the length of the nanochannels, so the electric field in the nanochannels is much greater than the electric field in the middle part. Figure 5(c) shows the dependence of the average ion concentrations in the nanochannelsand in the middle parton V at P0=0. It can be found thatthat is ion concentration in the nanochannels would never be less than in the microchannel. A higher concentration, together with a higher electric filed, therefore leads to greater current in the nanochannels than in the middle part.
As an important parameter indicating the working status of the system, the maximum shear stress[23] under varied voltage V and external pressure P0is obtained and its dependencies on V and P0are analyzed, respectively.
The change of V affects the maximum space charge densityand the maximum magnitude of the electric fieldover the system, thereby influencing the maximum shear stress. Figure 6(a) shows the dependence ofon the applied voltage V at P0=0. It should be pointed out that in order to eliminate the influence of the electrical double layer near the wall, the region which is within 50 nm from the wall is not taken into consideration in the calculation of these parameters. As V increases, the change ofcan be divided into two stages: (1) When V<0.3 V,fluctuates in a negligibly small range around 2.5 Pa. As V increases, in spite that both max() andincrease with V. This is because the incompletely formed ion depletion zone and the still small potential drop result in a quite small(~3000 V/m) (Fig.6(b)), which weakens the effect of the increasing. In this scenario, the vortex has not been completely formed and the shear stress acts mainly on the micro-nanofluidic junction.(2) As V increases above 0.3 V,increases linearly from 2.9 Pa at V =0.3 V to 42.6 Pa at V=2 V, with its position keeping almost unchanged. The reason for this linearity is the overall effects of an approximately constant max() and a max(|E|) which is linearly proportional to V. In this scenario, the ion depletion zone has been formed, thus max() reaches its maximum value and remains almost constant, and max(|E|) keeps going up linearly with V (Fig. 6(b)) because of the increasing potential drop.Therefore, following the same trend as max(|E|),rises linearly as V goes up.
The external pressure P0is another main factor that affects. From Fig. 6(c), it can be found that rise of P0leads to a rise-fall-rise mode change of.increases from 20 Pa at P0=0 to 23 Pa at P0=300 Pa when P0is small, while decreases to 8.3 Pa as P0further increases to 1500 Pa at V=1 V. As P0increases above 1500 Pa,tends to increase again.
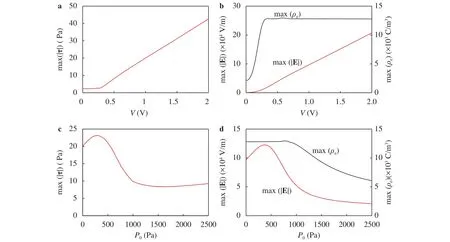
Fig. 6.Dependences of a the maximum shear stress max(||), b the maximum space charge density max() (black line), and the maximum electric field max(|E|) (red line) on the applied voltage V at P0=0. And dependences of c maximum shear stress max(||), d the maximum space charge density max() (black line), and the maximum electric field max(|E|) (red line) on the applied pressure P0 at V=1 V.
The reason for the capability of P0to modulatealso lies in its effects onand max(|E|) of the system. Under low P0conditions (P0=0~300 Pa), the increase of P0only compresses the vortex that located in front of the upper micro-nanofluidic junction, rather than destroys it. That is, the area of the depletion zone decreases as P0goes higher. In this regard, a majority of the drop of the electric potential is gradually confined to a narrower region, with a slight increase in max(|E|) from 9.7×10⁴V/m to 1.2×10⁵V/m (see Fig. 6(d)). At the meantime,remains at a stable level as long as the depletion zone still exists.An increasing electric filed, together with an unchanged charge density, gives rise to the strengthening of vortices located both in front of and behind the micro-nanofluidic junction, thereby leading to the increase of, as shown in Fig. 6(c). When P0increases above 300 Pa,still remains constant, whilebegins to decreases due to the increased P0that carries more ions there,is therefore decreased by 14.7 Pa. In this regard, the size of the vortex gets smaller. As P0becomes higher than 800 Pa, bothandshow a downward trend, resulting in a further decline of. During this process, the vortex is further disrupted until it is destroyed completely. After that,tends to increase with the increase of P0, because the fluid flow then is mainly pressure-driven andis mainly accounted for by the lateral pressure.
Figure 7 shows the dependence of velocity on P0at V = 1 V.The average velocity at the outlet of the micro-nano systemincreases linearly as P0increases. The maximum velocity over the micro-nano system,, follows the same trend as.is an appropriate parameter that can be used to indicate the strength of the vortex in the system. When P0>1500 Pa, slopes of the curves ofandare almost parallel, indicating that the vortex has been completely destroyed and the ion depletion region does not exist. Similar properties have also been found in H-shaped system [12].
In this paper, the U-shaped micro-nanochannel system is studied by numerical simulation. High ion concentrations, equal to the initial value C0, at both the inlet part and the outlet part make it incapable to be used in seawater desalination. While the negligible the electric field and concentration in the middle part of the microchannel enables the system to process some neutral particles. At V = 1 V, P0= 0 Pa, compared with EOF1, one may achieve 15 fold increase in the generated local electric field, and 1.7 fold increase in the flow rate owning to the ICP effect. Current of the whole system, increasing linearly with V, is found to be conducted mainly by the nanochannels, rather than the middle part of the microchannel. As the voltage V increases, the maximum shear stress fluctuates over a negligibly small range in low V regime and then tends to increase linearly. Increase of the external pressure P0produces a rise-fall-rise trend of the shear stress. Compared with the traditional H-shaped micro-nanofluidic systems, which are generally characterized with the three-stage current-voltage relationship, the U-shaped system manifests a noteworthy linear current-voltage relationship in nanochannels. Besides, the U-shaped system has only two,rather than four, reservoirs, making it easier to realize large-scale parallelism.
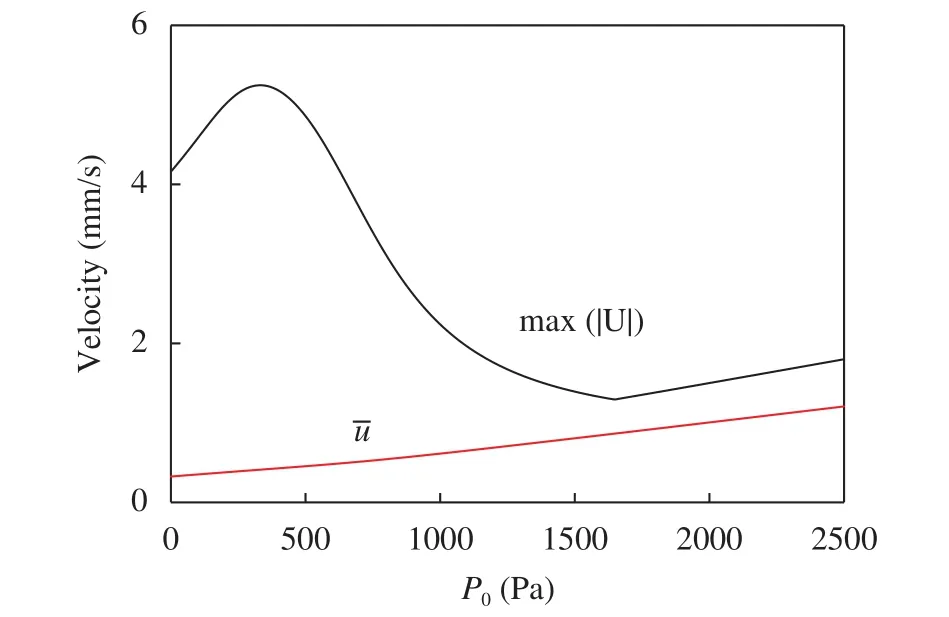
Fig. 7.max(|U|) represents the maximum velocity of the micronano system at V=1 V represents the average velocity at the outlet of the micro-nano system at V=1 V.
It is noteworthy that our simulation uses 2D simplified model instead of three dimensional (3D) one. This is because of two reasons. Firstly, it would be prohibitively expensive to do 3D simulations because a huge number of elements are required to describe the highly nonlinear physics of this system, especially when so many overlapping Debye layers are involved. Secondly,it has been a common practice to do 2D simulations for such kind of micro- nanofluidic systems [24-27], at least for the purpose of mechanism investigations. It has been well established that 2D simulation results can faithfully describe key physics of the corresponding 3D systems. For example, in our previous work on micro- nanofluidic preconcentration of charged particles, 2D simulation results matched perfectly well with the 3D experimental data, in terms of scaling laws of all the system parameters [28]. We believe that the results and mechanisms obtained in this paper will provide important guidance for various kinds of applications of U-shaped micro-nanochannels.
Acknowledgement
This work is supported by the Intergovernmental International Science, Technology and Innovation Cooperation Key Project of the National Key R&D Programme (2016YFE0105900),the National Natural Science Foundation of China (21576130 and 11372229), and Kuwait Foundation for the Advancement of Sciences (Kuwait-MIT signature project, Project code:P31475EC01).
Supplementary Information
A tutorial for this work's model is downloadable from website http://www.rle.mit.edu/micronano/publications/
杂志排行
Theoretical & Applied Mechanics Letters的其它文章
- Lattice Boltzmann model of percutaneous drug absorption
- Seepage-stress coupled modeling for rainfall induced loess landslide
- Dependency of gamma oscillations in E/I neuronal network on illumination contrast of external stimulus
- An energy approach to predict electromigration induced grain rotation under high current density
- Optimal control of a mobile robot on sphere
- Key structure in laminar-turbulent transition of boundary layer with streaky structures
