Key structure in laminar-turbulent transition of boundary layer with streaky structures
2019-03-07JoeYoshikawaYuNishioSeiihiroIzawaYuFukunishi
Joe Yoshikawa*, Yu Nishio, Seiihiro Izawa, Yu Fukunishi
a Industrial Technology Institute, Miyagi Prefectural Government, 2-2 Akedohri, Izumi-ku, Sendai 981-3206, Japan
b Seikei University, 3-3-1 Kichijyojikitamachi, Musashino-shi, Tokyo 180-8633, Japan
c Tohoku University, 6-6-01 Aramaki-Aoba, Aoba-ku, Sendai 980-8579, Japan
Keywords:Turbulent onset Key vortical structure Laminar-turbulent transition Boundary layer Streaky structures Short duration jet Numerical simulation
ABSTRACT A numerical simulation is performed to find out a key vortical structure in the laminar-turbulent transition. A low-speed streak is generated inside a laminar boundary layer using an isolated cuboid roughness, aimed at providing an environment unstable to outer disturbances. Then, a short duration jet is issued into the boundary layer. When the jet velocity is low, some vortices appear in the boundary layer, but the transition of the boundary layer does not take place.However, when the jet velocity exceeds a certain threshold, two vortices newly appear above the elongated legs of a V-shaped vortex and only one of them is stretched and survives. After that,vortices are generated one after another around the survived one. By comparing the decayed and the survived vortices, it is found that the difference in their heights is the key characteristic which leads to the transition.
Turbulent flows cause a drastic increase in the friction drag compared to laminar flows, at the same time, they are capable of suppressing flow separations. Since it is important in engineering applications to control the flow states, the laminar-turbulent transitions of a boundary layer have been studied for a long time.In a low-disturbance environment, in the beginning, linear perturbations grow. After the linear stage, nonlinear effects become predominant and some vortical structures appear inside the boundary layer. Finally, the breakdown of such structures makes the flow field turbulent and the transition process is completed.Although much knowledge has been accumulated on the processes of boundary layer transitions, the phenomena at its final stage remain unclear. There are studies which investigated the beginning of turbulence. Peixinho and Mullin [1] and Lemoult et al. [2] investigated the jet velocity threshold in order to start turbulence. They focused on the Reynolds number dependency of the threshold and not on the vortical structures which played an important role at the onset of turbulence. Although some studies [3, 4] focused on the vortical structures observed in the nonlinear stage of transition process, the vortices in direct relation to the transition could not be identified because so many structures appeared in their computations. In our previous study [5],Blasius boundary layer was locally disturbed by a short duration jet and the resulting two flow fields were compared: one was the flow field which became turbulent and the other was the one which returned back to the laminar state. In the study, it was shown that a hairpin vortex with widespread legs was a key vortical structure for the transition.
In this study, a boundary layer with a streaky structure is chosen as a target to study the onset of transition to turbulence.An isolated cuboid roughness on the wall is used to introduce a streaky structure into the boundary layer so that the boundary layer will become slightly unstable. To investigate the key structure which leads to transition in this slightly unstable condition[6, 7] is the purpose of this work.
Governing equations are the three dimensional incompressible Navier-Stokes equations and the continuity equation. Only the differences in velocities from the Blasius profile are computed. Physical properties in the equations are all non-dimensionalized by the uniform flow velocity U∞and the displacement thicknessof Blasius boundary layer at the inlet of the prelim-inary computation. Finite difference method is used to solve the equations. The marker-and-cell (MAC) method is used as an algorithm to couple the velocity and pressure fields. Time integral is realized by the Crank Nicolson method. The second-order central difference scheme is applied to the spatial derivatives,except for the convection term which is discretized by the thirdorder upstream difference scheme (K-K scheme [8]). The Multidirectional difference scheme is employed only when the velocity of the next step is computed. The red-black successive overrelaxation (SOR) method is used to solve the Poisson equation for pressure [9]. The computational code is parallelized by OpenMP.
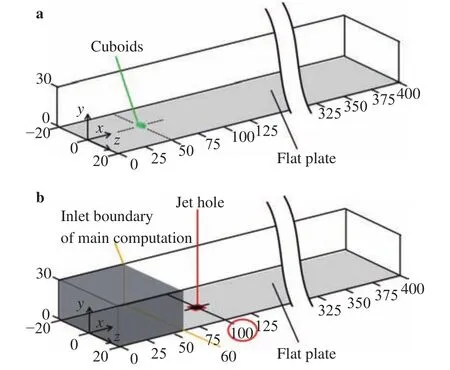
Flow fields are computed in two steps: a preliminary computation to obtain streaky structures and the main computation where the low speed streak is destabilized by ejecting a short duration jet. Figure 1 shows the computational domains. The origin of Cartesian coordinate system is at the center of the wall at the inlet boundary, where the x, y, and z denote the streamwise, wall-normal, and spanwise coordinates, respectively. The Reynolds number at x = 0 is==530. The computational region is a rectangular-shaped box and 400 × 30 × 40 in dimensions. The grid points number is 2401 × 101 × 241 and they are equally-spaced in x and z directions. In the y direction, the 61 points from the wall are equally-spaced and grid points are gradually widened for the rest. The normalized wall-normal size of equally-spaced grid region is 6.0 from the wall, which is larger than the maximum thickness of boundary layer, 5.24, at the downstream end. The base flow is assumed to be laminar. The velocities of a spatially developing Blasius profile are provided as the base flow throughout the computational domain.
The velocity fluctuations at the inlet boundary are fixed to zero in the preliminary computation, and the obtained values are given as boundary conditions in the main computation. The non-slip condition is applied at the wall, and the derivatives of the velocity fluctuation are zero at the outlet boundary and the top boundary. The derivative of the pressure fluctuation is zero at all boundaries. In the preliminary computation, steady streaky structures are obtained by placing a small cuboid of 1 × 1 × 2 at x = 50. The height is approximately one third of the local boundary layer thickness. The velocities obtained at x = 60 in the primary computation are used as the inflow condition in the main computation. In the main computation, a jet is ejected into the low-speed streak for 15 unit time at a uniform wall-normal velocity of vjetthrough a square hole of 2 × 2 in the wall at x = 100.

Fig. 1.a Domain for preliminary computation. b Domain for main computation.
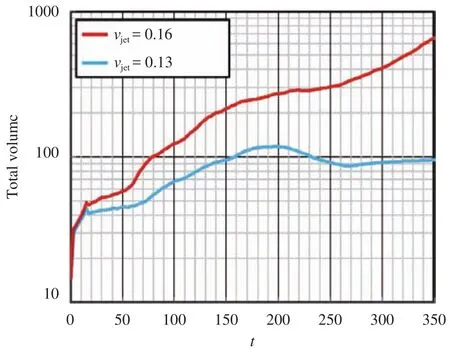
Figure 2 shows the time variations of the total volumes of vortical structures inside the boundary layer of the two cases changing the jet velocity: vjet= 0.13 and vjet= 0.16. The vortical regions are defined as inner parts of isosurfaces of Q = 0.0015,where Q represents the second invariant of velocity gradient tensor. For t > 15, which is after the ejection is stopped, the total volumes increase in both cases. For the vjet= 0.13 case, the volume begins to decrease around t = 200 and it stays around a value afterwards. On the other hand, for the vjet= 0.16 case, the vortex volume almost monotonically increases. Figure 3 shows vortical structures at t = 100, 150, 200, 250, and 300. The vortices are visualized by isosurfaces of Q = 0.0015 colored by the local streamwise vorticity. First, at t = 100, in both cases a V-shaped vortex (labeled as "V") with its legs opened in the downstream direction is observed between two hairpin vortices. The vortical structures in the two cases are similar. Such a hairpin-V-hairpin structure has also been observed in the other studies which focused on the symmetric mode in the secondary instabilities of low-speed streaks [10]. In the vjet= 0.16 case at t = 150, streamwise vortices composing the V-shaped vortex are elongated in the streamwise direction and their downstream tips are wrapped around the adjacent streamwise vortices. At t = 200, each elongated streamwise vortex is split into an upstream part V1and a downstream part V2and, new vortices, A1and A2, emerge above V1and V2vortices, respectively. Although vortex A2soon disappears, vortex A1continues to grow. Finally at t = 300, complicated vortical structures are formed in the vicinity of vortex A1. On the other hand, in the vjet= 0.13 case, although the legs of V-shaped vortex are elongated for a while, no additional vortices appear to complicate the flow field. From the observation above,it can be concluded that the appearance of vortex A1is the cause of the laminar-turbulent transition.

Fig. 2.Time variations of total vortex volumes inside the computational region.
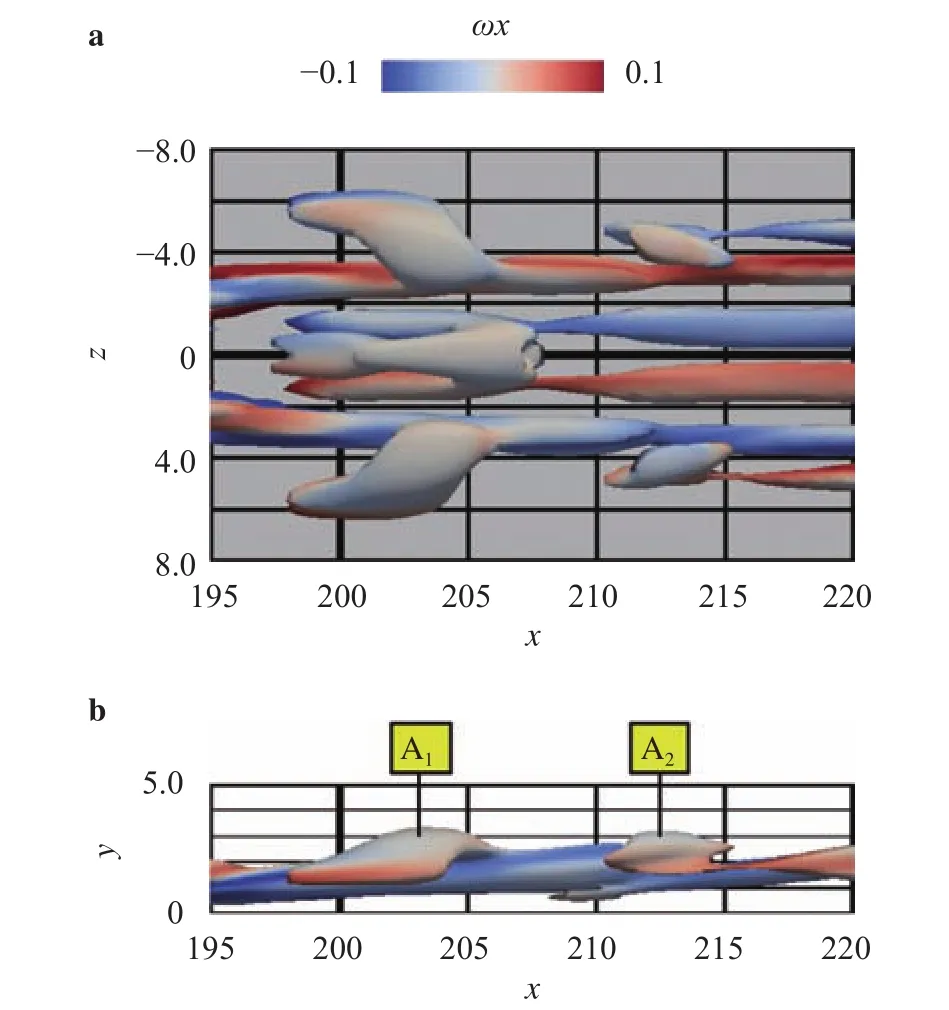
Finally, the difference between vortices A1and A2are discussed. Figure 4 shows the top and side views of vortical structures at t = 200. These vortices are visualized by isosurfaces of Q= 0.0005 whose value is one-third of the value used in Fig. 2. In the side view Fig. 4(b), only the vortical structures located in z >2.0 are drawn. The vortex A1lies between y = 1.4 - 3.3, whereas vortex A2is located y = 2.1 - 3.2. Thus, vortex A1is much more likely to be stretched by the mean background shearof the boundary layer compared to vortex A2. This characteristic of being susceptible to the stretching by the shear of the boundary layer is same as the key structure found in the previous study [5].The assumption that a key structure in boundary layer transition is likely to be a vortical structure with height difference is fortified.

Fig. 4.Top and side views of the vortical structures at t = 200. a Top view. b Side view.
A short duration jet was ejected into a low-speed streak to find out the key vortical structure that causes the onset of turbulence. Two vortices appeared above the elongated legs of V-shaped vortex when the jet was strong enough. Only one of the two vortices, which had a larger height difference between its ends, survived through stretching by the shear of the boundary layer, and complicated structures arose around it. This characteristic of the key structure was the same as the key structure found in the previous study.
Nomenclature
Q: Second invariant of velocity gradient tensor [-]
t: Time [-]
U∞: Uniform velocity [m/s]
vjet: Jet velocity [-]
x: Coordinate in the streamwise direction [-]
y: Coordinate in the wall-normal direction [-]
z: Coordinate in the spanwise direction [-]
v: Kinematic viscosity [m/s]
杂志排行
Theoretical & Applied Mechanics Letters的其它文章
- Lattice Boltzmann model of percutaneous drug absorption
- Seepage-stress coupled modeling for rainfall induced loess landslide
- Dependency of gamma oscillations in E/I neuronal network on illumination contrast of external stimulus
- An energy approach to predict electromigration induced grain rotation under high current density
- Optimal control of a mobile robot on sphere
- Electrokinetic flow in the U-shaped micro-nanochannels
