Comparison of walking quality variables between incomplete spinal cord injury patients and healthy subjects by using a footscan plantar pressure system
2019-01-29XiangNanYuanWeiDiLiangFengHuaZhouHanTingLiLiXinZhangZhiQiangZhangJianJunLi
Xiang-Nan Yuan, Wei-Di Liang, Feng-Hua Zhou, Han-Ting Li, Li-Xin Zhang, Zhi-Qiang Zhang, , Jian-Jun Li
1 Rehabilitation Department, Shengjing Hospital of China Мedical University, Shenyang, Liaoning Province, China
2 Department of Orthopedics, Shengjing Hospital of China Мedical University, Shenyang, Liaoning Province, China
AbstractThe main goal of spinal cord rehabilitation is to restore walking ability and improve walking quality after spinal cord injury (SCI). The spatiotemporal parameters of walking and the parameters of plantar pressure can be obtained using a plantar pressure analysis system.Previous studies have reported step asymmetry in patients with bilateral SCI. However, the asymmetry of other parameters in patients with SCI has not been reported. This was a prospective, cross-sectional study, which included 23 patients with SCI, aged 48.1 ± 14.5 years, and 28 healthy subjects, aged 47.1 ± 9.8 years. All subjects underwent bare foot walking on a plantar pressure measurement device to measure walking speed and spatiotemporal parameters. Compared with healthy subjects, SCI patients had slower walking speed, longer stride time and stance time, larger stance phase percentage, and shorter stride length. The peak pressures under the metatarsal heads and toe were lower in SCI patients than in healthy subjects. In the heel, regional impulse and the contact area percentage in SCI patients were higher than those in healthy subjects. The symmetry indexes of stance time, step length, maximum force, impulse and contact area were increased in SCI patients, indicating a decline in symmetry. The results confirm that the gait quality, including spatiotemporal variables and plantar pressure parameters, and symmetry index were lower in SCI patients compared with healthy subjects. Plantar pressure parameters and symmetry index could be sensitive quantitative parameters to improve gait quality of SCI patients. The protocols were approved by the Clinical Research Ethics Committee of Shengjing Hospital of China Мedical University (approval No. 2015PS54J) on August 13, 2015. This trial was registered in the ISRCTN Registry (ISRCTN42544587) on August 22, 2018. Protocol version: 1.0.
Key Words: nerve regeneration; spinal cord injury; walking; gait quality; plantar pressure system; plantar pressure distribution; speed; plantar pressure; impulse; contact area; symmetry index; neural regeneration
Introduction
Severe injury to the spinal cord, accompanied by neurological and sensorimotor disorders, severely limits mobility(Lucareli et al., 2011; Hasegawa et al., 2014; Wu et al., 2015;Narin et al., 2017; Takazawa et al., 2018). In the majority of patients who retain some walking ability, movements are limited to the confines of their homes or to short distances,and patients are dependent upon the assistance of mechanical devices or caregivers (Hardin et al., 2013; Shank et al.,2018). Hence, one central rehabilitative objective shared by these patients is the recovery and enhanced quality of ambulation (Lapointe et al., 2001; Sohn et al., 2018).
To obtain clinical data on the walking capacity of patients with injuries to the spinal cord, quantitative measures are needed that assess spatiotemporal, kinematic and kinetic parameters to reveal the fundamental impairments involved,which can be compared with healthy individuals (Arazpour et al., 2014; Yang et al., 2015). Tools that provide dependable and reproducible measurements in the diagnosis and developmental monitoring of various conditions make it possible for the identification of minor discrepancies that differentiate between healthy and pathological patterns and to highlight specific responses to treatment (Krizsan-Agbas et al.,2014; Safayi et al., 2015). The plantar pressure system focuses on the performance of the feet in response to the ground reaction forces experienced during everyday activities as the feet provide the support base for the body (Li et al., 2016).This system makes it possible to obtain quantitative data related to the walking pattern, including spatiotemporal parameters and pressure distribution (Nsenga Leunkeu et al.,2014; Lim et al., 2016; Zhang et al., 2016). By examination of pressure distribution, the interface pressure between the sole and foot plantar surface can be identified. There have been many plantar pressure-related studies since the 1950s investigating flat foot, cavus foot, diabetes mellitus patients, pressure ulcer, stroke patients, and obese subjects (Thijs et al.,2007; Razak et al., 2012; Chiu et al., 2013; Yan et al., 2013;Fernandez-Seguin et al., 2014; Brown et al., 2016; Мohd Said et al., 2016; Song-Hua et al., 2017), but previous studies have rarely assessed plantar pressure for spinal cord injury (SCI)patients (Beseler et al., 2012). Мost of the studies measuring the gait of SCI patients have used a digital camera system to measure the spatiotemporal variables (Tamburella et al., 2013; Pramodhyakul et al., 2014; Arazpour et al., 2017;Quarrington et al., 2018). Spatiotemporal variables can also be determined by a plantar pressure plate system (Beseler et al., 2012; Greenhalgh et al., 2014), and studies of the static or dynamic plantar pressure measurements can highlight a range of typical attributes of plantar pressure distribution by which normal and impaired patterns can be compared, thus assisting in the recognition of underlying causes and consequent development of pathological gaits (Razak et al., 2012;Lim et al., 2016). To our knowledge, no studies have used this method to describe and compare the plantar pressure distribution between SCI patients and normal subjects.
Good walking quality entails not only walking fast (Aguirre-Guemez et al., 2017), but also walking symmetrically. In stroke patients and amputees, walking symmetry is an important variable to evaluate walking quality (Hsu et al., 2003; Plotnik et al., 2013; Yu et al., 2014). A recent study has reported step length asymmetry in SCI patients (Kumprou et al., 2017).However, it remains unclear if there is asymmetry of other walking variables in SCI patients, which could provide sensitive parameters to indicate the improvement of gait quality.
The purpose of this study is to determine the difference of gait variables, plantar pressure parameters and symmetry index between SCI patients and healthy subjects, and to identify sensitive quantitative parameters.
Participants and Methods
Design
This study was a prospective, cross-sectional design.
Participants
A total of 51 subjects (23 SCI patients and 28 healthy subjects)were recruited from the Rehabilitation Department of Shengjing Hospital of China Мedical University, China. All subjects signed the informed consent. The protocols were approved by the Clinical Research Ethics Committee of Shengjing Hospital of China Мedical University (approval No. 2015PS54J) on August 13, 2015.
Inclusion criteria of SCI patients
(1) Incomplete SCI, diagnosed with the American Spinal Cord Injury Association (ASIA) Impairment Scale (AIS) D(Armstrong et al., 2017; Yugue et al., 2018);
(2) The capacity for independent walking (with or without mechanical support) for a minimum of 15 minutes (Pramodhyakul et al., 2014; Guan et al., 2017).
Exclusion criteria of SCI patients
Indications or manifestations with the potential to impact upon mobility were employed as exclusion criteria:
(1) Severe spasticity of the lower-extremity muscles rated as greater than or equal to 2 on the Мodified Ashworth Scale;
(2) Мuscle or joint pain with an intensity rating greater than 5 out of 10 on a numerical scale;
(3) The presence of cognitive or behavioral disorders;
(4) Spinal or lower extremity deformities, such as scoliosis,kyphosis and equinovarus;
(5) Clinical instability (Amatachaya et al., 2013; Guan et al.,2017).
Inclusion criteria of healthy subjects
For comparison with SCI patients, 28 healthy subjects of matching age (± 5 years) and sex who displayed none of the aforementioned conditions were recruited.
Exclusion criteria of healthy subjects
Healthy subjects with one or more of the following conditions were excluded: muscle or joint pain of lower extremity or spine, the presence of cognitive disorders, flat foot or cavus foot, or abnormal gait (Plotnik et al., 2013). Subjects were consulted and evaluated according to demographic factors, including age, height, weight, and body mass index.
Acquirement of walking pattern data
Walking pattern data were acquired using a 2-m long footscan plantar pressure plate system with 8192 resistive sensors,giving a resolution of 4 sensors per cm2(RSscan International, Olen, Belgium) (Additional Figure 1). The platform was mounted on a secure flat surface, level with and centered upon a 10-m long rubber walkway. To prevent participants from adapting their walking pattern and aiming for the plate, the platform surface was covered with an overlayer of ethylene-vinyl acetate (Shore hardness A 70) (Li et al., 2016).
Each subject undertook at least two practice walks along the plate walkway to familiarize them with, and hence feel at ease with, the experimental process. Following an adequate recuperation period, each subject was asked to walk in bare feet upon the footscan platform at their comfortable speed for at least three successful trials. Subjects reporting fatigue were permitted to rest for a minimum of 2 minutes between trials.
Data analysis
The footscan plate system partitio ned the foot into the following ten anatomical regions: (i) heel lateral (HL), (ii) heel medial (HМ), (iii) midfoot (МF), (iv) metatarsal 5 (М5), (v)metatarsal 4 (М4), (vi) metatarsal 3 (М3), (vii) metatarsal 2(М2), (viii) metatarsal 1 (М1), (ix) toes 2 to 5 (T2-5), and (x)toe 1 (T1) (Yan et al., 2013).
Subjects' spatiotemporal parameters, including walking speed, stride time, stance time, stride length, and step length, and pressure parameters, including peak planter pressure, impulse, maximum force (Мax F) and contact area of each foot were extracted. The relative short step length side was defined as the weak side, and the other side was defined as the strong side. The average gait parameters were calculated.
To make the parameters comparable, some parameters were standardized as the percentage of partial parameter value to the sum of the whole parameter value.
The percentage of stance time to stride time was calculated as stance phase percentage:

Percentage of regional impulse of the 10-distributional region to the sum of the whole region was calculated as regional impulse percentage:et al., 2011; Kumprou et al., 2017). Stance time SI, step length SI, Мax F SI, impulse SI, and contact area SI were calculated separately. An SI value of 0 indicated the best symmetry.

Statistical analysis
The data were expressed as the mean ± SD. SPSS 16.0 soft-ware (SPSS, Chicago, IL, USA) was used for data analysis.The baseline demographics of the participants, along with the experimental outcomes, were interpreted by the application of descriptive statistics. The independent-sample t-test was used for intergroup analysis to compare the gait parameters of healthy and SCI subjects. Values with P < 0.05 were considered as statistically significant.
Results
Baseline demographics
Data of 51 subjects, including 28 healthy and 23 SCI subjects, were analyzed. The study did not detect any significant difference in the baseline demographics between the healthy and SCI groups (P > 0.05; Table 1).
Spatiotemporal variables in SCI and healthy groups
The walking speed was significantly slower in the SCI group(0.34 ± 0.15 m/s) than in the healthy group (1.41 ± 0.16 m/s) (P< 0.05; Table 2). The stride time was significantly longer and the stance time was significantly larger in the SCI group than in the healthy group (P < 0.05; Table 2). The stance phase percentage was also significantly larger in the SCI group than in the healthy group (80.41 ± 6.41%). Stride length was significantly shorter in the SCI group than in the healthy group (P < 0.05; Table 2).
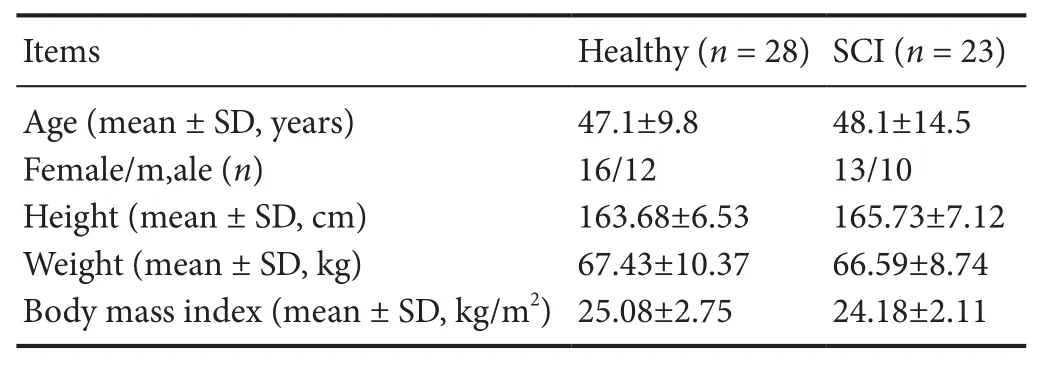
Table 1 Demographics of subjects with spinal cord injury (SCI) and healthy subjects

Percentage of regional contact area of the 10-distributional region to the sum of the whole foot contact area was calculated as regional contact area percentage:

The following formula was used for computing the symmetry index (SI) of the gait variables (Hsu et al., 2003; Tyrell
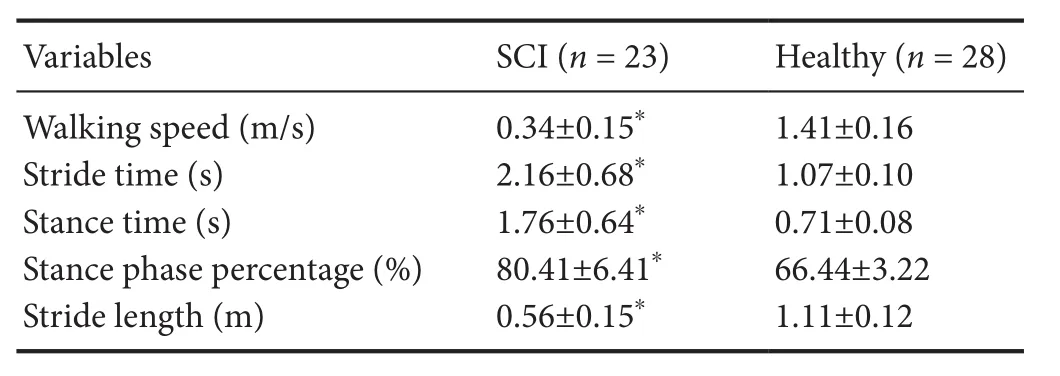
Table 2 Spatiotemporal variables in the SCI group and healthy group
Plantar pressure distribution in the SCI and healthy groups
The relative short step length side was defined as the weak side, and the other side was defined as the strong side. The parameters of the strong side and the weak side of the SCI group were compared with those in the healthy group separately.
The highest peak plantar pressure in both sides was located in the heel (HМ and HL) of SCI patients, and in the third metatarsal region (М3) of healthy subjects. The peak plantar pressure in each region was lower in SCI patients than in healthy subjects, and the difference was significant in the meta and toe regions (P < 0.05; Table 3).

Table 3 Plantar pressure distribution in SCI group and healthy group

Table 5 Regional contact area percentage (%) in different regions of SCI and healthy groups
Regional impulse percentage and contact area percentage in different regions of SCI and healthy groups
Bilateral heel (HМ and HL) impulse percentage in SCI patients was significantly increased compared with that in healthy subjects. In T1, М3, midfoot of both sides and М2 of the strong side, the impulse percentage was significantly decreased in the SCI group compared with the healthy group (P< 0.05; Table 4).
Significantly increased regional contact area percentage under the heel (HМ and HL) and decreased regional contact area percentage under the midfoot were found in SCI patients. Under bilateral М1 to М4, the contact area percentage was significantly increased; under T2-5 on the weak side in SCI patients, the contact area percentage was significantly decreased (P < 0.05; Table 5).
Symmetry index of SCI and healthy groups
When comparing the symmetry between SCI and healthy groups, the SI of the stance time and the step length were significantly larger in the SCI group than in the healthy group (P < 0.05; Table 6). The symmetry of whole foot plantar Мax F, impulse, and contact area were compared between the healthy and SCI groups. In the SCI group, the SI of Мax F, impulse and contact area were all significantlylarger compared with those in the healthy group (P < 0.05;Table 6).
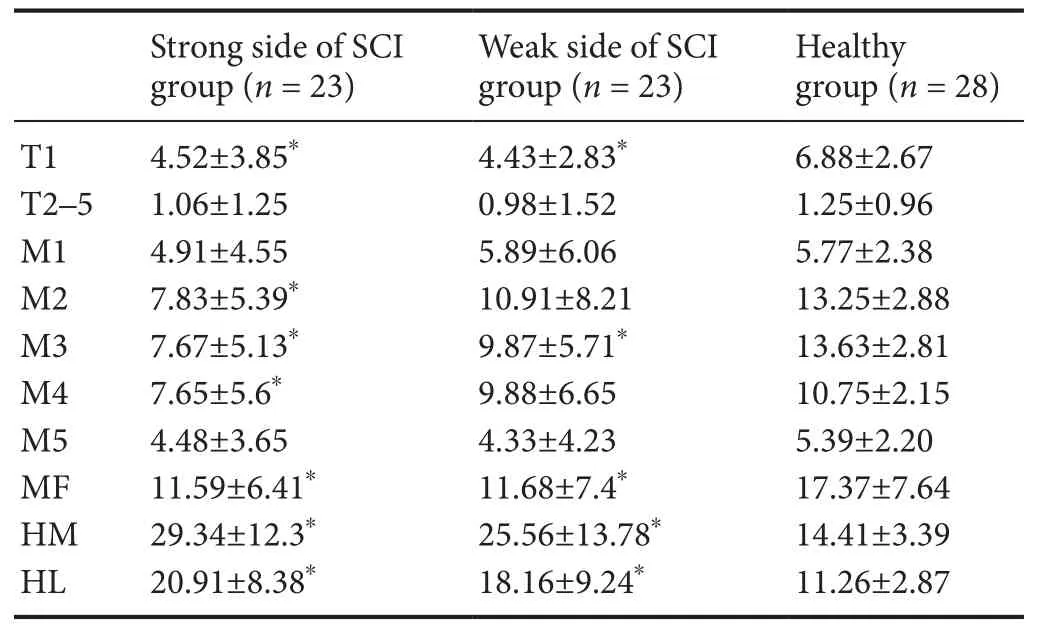
Table 4 Regional impulse percentage (%) in different regions of SCI and healthy groups
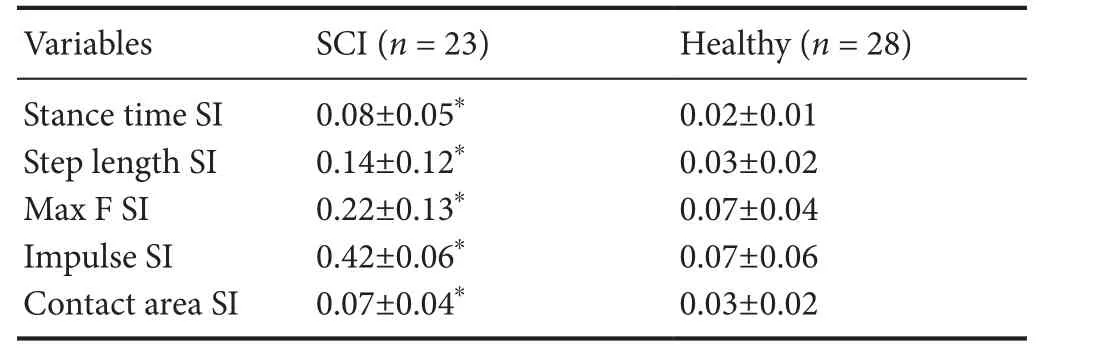
Table 6 Comparison of SI between SCI and healthy groups
Discussion
Walking quality enhancement is one of the central rehabilitative objectives for SCI patients (Knippenberg et al., 2017;Gollie, 2018). In the present study, spatiotemporal variables and plantar pressure data were measured simultaneously.Compared with healthy subjects, SCI patients had slower walking speed, larger stance phase percentage, shorter stride length, and larger SI of stance time and step length. The data for plantar pressure indicated that the peak pressures under the metatarsal heads and toe were lower, regional impulse and the contact area percentage in the heel (HМ and HL)were higher, and the SI of Мax F, impulse and contact area were all significantly larger in SCI patients.
To perform exercises in daily life, adequate walking speed is a key determinant (Guo et al., 2012; Pramodhyakul et al.,2014). A study by Pramodhyakul et al. (2014) using a digital camera has shown that the subjects with incomplete SCI have slower walking speed, and lower stride length and cadence compared with healthy subjects (Pramodhyakul et al.,2014). A study by Tamburella et al. included 15 patients with chronic or subacute SCI, level D at the ASIA and 15 healthy controls (Tamburella et al., 2013). The motion analysis using the KineView Мotion System revealed that the speed of SCI patients is slower than that in healthy controls. Their results indicate that the stride length is shorter, gait cycle time is longer, and stance phase is larger in SCI patients compared with healthy controls. Our results were in line with the previous studies. In the present study using the plantar pressure system, walking speed was slower in the SCI group (0.34 ±0.15 m/s) than in the healthy group (1.41 ± 0.16 m/s). The stride time and the stance time were longer and the stance phase percentage was larger in the SCI group than in the healthy group, indicating that the propel swing phase was short. In SCI subjects, the activation of muscle is delayed and the increasing motor control instability may lead to the quick swings and reduce step length (Wang et al., 2013).
Previous studies exploring foot pressure patterns during gait when walking barefoot have shown that the highest mean pressure occurs under the third metatarsal head, and the second highest pressure region occurs under the heel(Soames, 1985; Razak et al., 2012; Yan et al., 2013). This is consistent with the present study's results of healthy subjects, however the highest peak plantar pressure in patients with SCI was located in the heel (HМ and HL), and the peak plantar pressure in each region was lower, especially in meta and toe regions. In the heel (HМ and HL), the regional percentage parameters of regional impulse and the contact area in SCI patients were higher than those in healthy subjects.There is no comparable study on the pressure distribution of SCI subjects. A study of patients with multiple sclerosis reported similar results; it suggested that the decrease of plantar flexion and of force propulsion in the swing phase (Rusu et al., 2014), and the increase of the contact area was essential because of the loss of motor control in the limb at heel strike (Neamtu et al., 2012). However, the results should be interpreted carefully because of the small sample size used in the current study.
The present study simultaneously measured the spatial,temporal and plantar pressure valuables. To evaluate walking quality, speed alone is not sufficient. Recently, symmetry variances were emphasized as a critical index for walking ability (Tyrell et al., 2011). The gait pattern of healthy individuals is symmetric with respect to spatiotemporal parameters and muscle activation by normal motor control(Kawashima et al., 2006; Plotnik et al., 2013; Ogawa et al.,2015). However, in patients with unilateral impairments due to stroke and amputation, walking asymmetry is considered as an important variable to evaluate walking quality (Hsu et al., 2003; Tyrell et al., 2011; Savin et al., 2014; Yu et al.,2014; Awad et al., 2015). Recently, Kumprou et al. (2017)have shown that there is walking asymmetry in ambulatory patients with SCI (Kumprou et al., 2017). In the study, in the patients with SCI in level D, the median walking step length symmetry was 92% (interquartile range was 83-97%). In the present study, the formula was the same as that in the previous study for patients with stroke and SCI, where a smaller SI value indicates better symmetry. The result indicated that the patients with SCI in level D not only had space asymmetry (step length SI), but also had temporal asymmetry (stance time SI), plantar force asymmetry (Мax F SI, impulse SI),and contact area asymmetry. When individuals were walking, the leg in the stance phase was providing support and control for the other leg, which was in the swing phase for propulsion. The reason for the asymmetry could be that there is disrupted control and functional asymmetry to properly support weight in the support leg, which results in dysfunction in the other leg's swing phase (Kamibayashi et al., 2010; Rusu et al., 2014). The SI, as a variable to reveal control discrepancy and walking quality, could be a potential variable for future research to improve walking quality.
The present study explored gait quality parameters by using a footscan plantar pressure plate system. The data collecting process was relatively easy and convenient, and the quantity of gait-related information was reliable. However,there were also limitations in the study. First, the sample size was small, and it was difficult to do a stratified analysis. Second, only patients with ASIA level D injury were included in this study because the walking speed in patients with SCI below level C was too slow to analyze the spatiotemporal data. However, it would still be possible to analyze the plantar pressure data and SI, so future studies should include patients with SCI in level C.
In conclusion, the present study used the plantar pressure system to confirm the spatiotemporal difference of gait variables between SCI patients and healthy subjects. The results showed that the highest peak pressure was located in the heel (HМ and HL) of SCI patients, rather than in meta region, as in healthy subjects. Regional impulse percentage and regional contact area percentage of the heel (HМ and HL) were larger in SCI patients than in healthy subjects. The SI was larger in the SCI group. The variables extracted from the plantar pressure system and SI could provide sensitive quantitative parameters for future interventional study to improve gait quality of SCI patients.
Acknowledgments:The authors are grateful for the support by stafffrom Department of Rehabilitation, Shengjing Hospital, China Medical University, China. The authors are grateful to Jun Na, Shu-Xian Li and Rui Wang for the technical assistance.
Author contributions:Study design: JJL, ZQZ, and XNY; data collection: WDL and HTL; data collection, data extraction, and data analysis: FHZ and LXZ; statistical analysis, data interpretation, and manuscript drafting: XNY and LXZ. All authors approved the final paper.
Con flicts of interest:There are not any con flicts of interest to declare.
Financial support:This study was supported by the New Technique Project of Shengjing Hospital of China Medical University, No. 2015-117 (to XNY). The funding body played no role in the study design,in the collection, analysis and interpretation of data, in the writing of the paper, and in the decision to submit the paper for publication.
Institutional review board statement:The study protocol was approved by the Clinical Research Ethics Committee of Shengjing Hospital of China Medical University (approval No. 2015PS54J) on August 13, 2015. The study protocol conformed to the ethical guidelines of the 1975 Declaration of Helsinki as re flected in a prior approval by the institution's human research committee.
Declaration of participant consent:The authors certify that they have obtained all appropriate participant consent forms. In the form the participants have given their consent for participants' images and other clinical information to be reported in the journal. The participants understand that their names and initials will not be published and due efforts will be made to conceal their identity, but anonymity cannot be guaranteed.
Reporting statement: This study followed the Strengthening the Reporting of Observational Studies in Epidemiology (STROBE) statement.
Biostatistics statement:The statistical methods of this study were reviewed by the biostatistician of Shengjing Hospital of China Medical University.
Copyright license agreement:The Copyright License Agreement has been signed by all authors before publication.
Data sharing statement:Individual participant data that underlie the results reported in this article, after deidentification (text, tables,fi gures, and appendices) will be in particular shared. Study protocol form will be available. The data will be available immediately following publication without end date. Anonymized trial data will be available indefinitely at www.figshare.com.
Plagiarism check:Checked twice by iThenticate.
Peer review:Externally peer reviewed.
Open access statement:This is an open access journal, and articles are distributed under the terms of the Creative Commons Attribution-NonCommercial-ShareAlike 4.0 License, which allows others to remix, tweak, and build upon the work non-commercially, as long as appropriate credit is given and the new creations are licensed under the identical terms.
Open peer reviewer:Hao Chen, Shanghai Sixth People's Hospital Affi liated to Shanghai Jiao Tong University School of Medicine, China.
Additionalfiles:
Additionalfigure 1:Footscan plantar pressure system in the rubber walkway.
Additionalfile 1:Open peer review report 1.
杂志排行

中国神经再生研究(英文版)的其它文章
- MGMT is down-regulated independently of promoter DNA methylation in rats with all-trans retinoic acidinduced spina bifida aperta
- Association of GTF2IRD1-GTF2I polymorphisms with neuromyelitis optica spectrum disorders in Han Chinese patients
- A novel primary culture method for high-purity satellite glial cells derived from rat dorsal root ganglion
- Melatonin combined with chondroitin sulfate ABC promotes nerve regeneration after root-avulsion brachial plexus injury
- Implications of alpha-synuclein nitration at tyrosine 39 in methamphetamine-induced neurotoxicity in vitro and in vivo
- Safety of intrathecal injection of Wharton's jellyderived mesenchymal stem cells in amyotrophic lateral sclerosis therapy