Progress of Steam Turbine Flutter Analysis
2018-11-13TianruiSunPaulPetrieRepar
Tian-rui SunPaul Petrie-Repar
(1.School of Energy and Power,Beihang University,Beijing,China 2.Department of Energy Technology,KTH Royal Institute of Technology,Stockholm,Sweden)
Abstract:Flutter analysis is an important part of the design process of modern steam turbines.The fidelity of flutter analysis for steam turbines has increased rapidly over the last 15 years,mainly due to the increasing capacity in computing power.In this paper,recent developments in steam turbine flutter analysis are presented.These developments include numerical approaches,wet steam fluid models,far-field boundary conditions,tip leakage flow effects and multi-row effects.Although some of these developments are not time-affordable for industry today,research in these areas can help researchers understand the quantitative error estimate of the current flutter prediction methods.
Key Words:Flutter,Steam Turbine,Turbomachinery Aeromechanics,Unsteady Aerodynamics
Nomenclature
σinter-blade phase angle
w*reduced frequency
cchord at mid-span
fmodal frequency
KEaverageaverage kinetic energy of the blade mode shape
Nnumber of blades
nnodal diameter
prefreference pressure
Vrefrelative velocity at turbine exit
Waeroaerodynamicwork
1 Introduction
Aeroelasticity is the branch of physics and engineering that studies the interactions between the aerodynamic,inertial,and elastic forces that occur when an elastic body is exposed to a fluid flow.The three main issues in turbomachinery aeroelasticity are forced response,flutter and non-synchronous vibrations.Flutter is the self-excited vibration of a structure due to the interaction of aerodynamic and structural-dynamic forces.The amplitude of blade vibration will rapidly increase when flutter occurs,which will cause high-cycle fatigue and possibly blade failure.Therefore,it is important to detect potential flutter problems in the steam turbine design phase.
The turbine blades of the last stage of large-scale steam turbines are typically over one metre long.These long blades are susceptible to flutter because of their low structural frequency and supersonic tip speeds.Although no steam turbine blade failure(loss of blade)due to flutter has been reported in the literature(Rice 2009)[1],blade flutter is a concern for the manufacturers of steam turbines(Stuer 2008,Panovsky 2000,Waite 2016)[2-4]and blade root cracking at the last stage of a steam turbine due to flutter has been reported(Masserey2012)[5].Experimental results from Alstom verifies that the potential of flutter occurring in modern steam turbines(Rice 2009)[1].It is important that the flutter stability of at least the last stage is assessed for any new blade design or new operating condition of a large scale steam turbine.
The reduced frequency is an important non-dimensional parameter in flutter prediction(Bendiksen 1980)[6],which is definedas Equation(1).
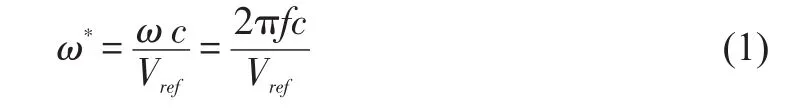
in whichfis modal frequency,cis chord length,Vrefis average relative velocity at turbine exit.The physical interpretation of the reduced frequency can be defined as the time a fluid particle takes to travel a distance equal to chord length divided by the vibrating blade's oscillation period.Generally,lower reduce frequency indicates a higher possibility of flutter.Atypical value of the reduced frequency of the first bending mode in last stage steam turbines is between 0.2and0.3.
In order to analyze flutter,the coupled aerodynamic and structural dynamic(aeroelastic)system must be considered.An aeroelastic system can only be considered flutter free if all possible eigenmodes of the aeroelastic system are stable.The aeroelastic eigenmodes of a turbomachinery row are the traveling wave modes(Lane 1956[7])if the following assumptions are made:each blade is identical(tuned blades),unsteady aerodynamic forces do not alter the structural deformation or frequency,each blade has only one degree of freedom(DOF),unsteady flow perturbations are linear with blade vibrations and the aerodynamic(and/or structural)coupling between blades is symmetric.The traveling wave modes are patterns of blade motion with the blades moving with a constant amplitude and with a constant phase shift between adjacent blades.This phase shift is referred to as the inter-blade phase angle and is equal to
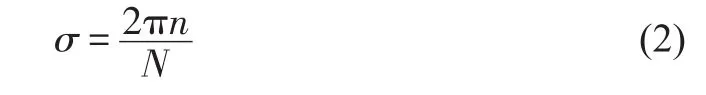
wherenis the nodal diameter andNis the number of blades.The nodal diameter is the diameter formed by points which are stationary on a disk in the vibration.A positive nodal diameter indicates that the direction of the phase(and the perceived direction of travel)of the blade vibrations of the row is in the same direction as the rotation of the rotor.
A turbine row can only be considered flutter free if all possible traveling wave modes are stable.The stability of a traveling wave mode can be determined by calculating the unsteady flow response to the blade motion of the traveling wave mode.The unsteady flow calculation can be performed on a single passage mesh if a phase shift corresponding to the inter-blade phase angle is applied to the unsteady flow perturbations at the periodic boundaries.
The work(Waero)performed by the unsteady flow on the blade can be calculated by integrating the unsteady pressure with the mode shape displacement.If this work is positive,the unsteady aerodynamics are adding energy to the motion of the blades.The aeroelastic stability of each traveling wave mode is usually expressed as the logarithmic decrement of the mode which is the rate of decrease in the amplitude of the blade motion per cycle and can be calculated as

whereKEaverageis the average kinetic energy of the blade mode shape.Note that negative values of logarithmic decrement are unstable.
If the logarithmic decrement value is negative,then the level of the unsteady aerodynamic work needs to be compared with the level of structural damping.The level of structural damping will depend on the material of the blade,the blade connections and the nodal diameter.If the mechanical damping is not sufficient to overcome the positive aerodynamic work,then a flutter risk exists.
The results of three-dimensional unsteady flow calculations performed for the purpose of flutter analysis of steam turbine blades have been presented previously.These methods solved the inviscid flow equations(Rice 2009,Masserey 2012,Huang 2006)[1,5,8]and the URANS flow equations(Stuer 2008)[2]in the time domain.Results from a 3D linearized flow solver have also been presented(Petrie-Repar,2015)[9].These previous studies were for performed for industry and the blade geometry and flow conditions were proprietary and it is not possible for others to repeat and verify these studies.Standard test cases with open descriptions are very useful to the research community as they allow researchers to compare solutions from their methods with solutions from other methods.These comparisons can be used to validate methods and highlight deficiencies in methods.
Recently,2D and 3D steam turbine flutter test cases have been developed.A 2D flat plate steam turbine flutter test case was established by Petrie-Repar(2015)[9],the geometry is shown in Figure 1.The blade is a flat plate with a thickness of 2.5mm with half circles at the leading and trailing edges.It has a high stagger angle of 78 degrees and a high Mach number at the turbine exit,1.362.These parameters are similar to those of a typical steam turbine near the tip.A3D steam turbine flutter test case was established by KTH(Qi 2017)[10].This is the first open 3D realistic-scale steam turbine flutter test case.The geometry for this test case was generated by Alstom Power in Rugby and modified by Durham University(Burton,2014)[11].The test case includes a 60 blades stator stage,a 65 blades rotor stage,and an exhaust.The schematic of the test case and boundaries are shown in Figure 2.The rotor blades are 0.92m long and highly twisted.The stagger angle at the tip is 67 degrees.The rotor speed is 3000 rpm.The stage is representative of the aerodynamic characteristics of modern steam turbines.
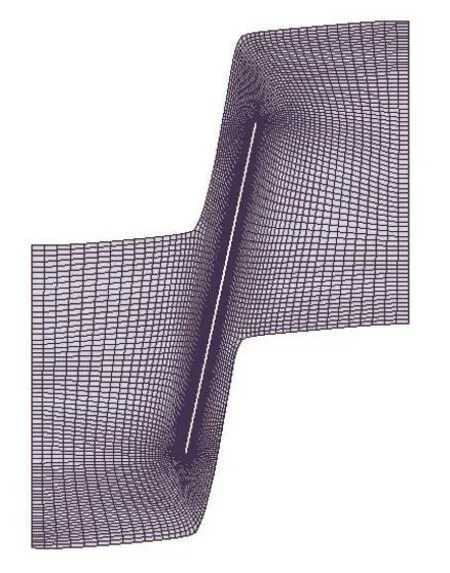
Fig.1 Geometry of the 2D steam turbine model(Petrie-Repar2015)[9]
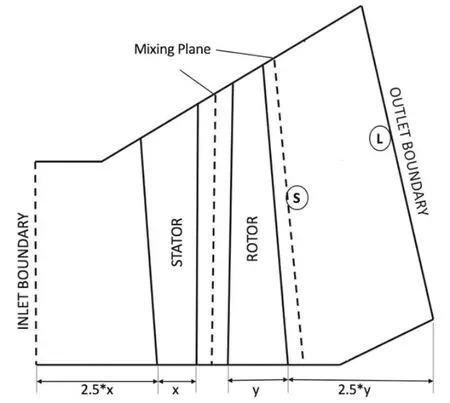
Fig.2 Schematic of stage and boundaries of the 3D steam turbine model(Qi2017)[10]
The complex flow structure in the tip region for the 2D and 3D test cases(Petrie-Repar 2015,Sun 2017)[9,12]are shown in Schlieren plots in Figure 3.The left-hand side of Figure 3 presents the shock structure at a 2D transonic steam turbine model,and the right-hand portion of Figure 3 shows the interaction between tip leakage flow and shocks at the tip region for the 3D test case.Considering the complex flow phenomena and fluid-structure interaction effects of last stage steam turbines,calculating the work performed on the blades by the unsteady flow induced by the motion of the blades is the most challenging aspect of predicting the aeroelastic stability.
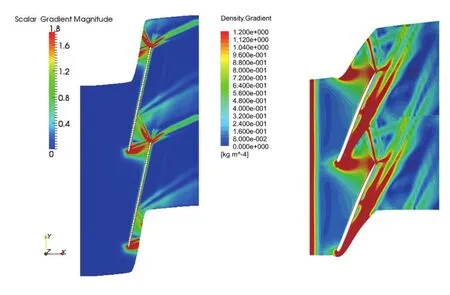
Fig.3 Typical flow structure near tip in a 2D test case(left)and a typical tip leakage vortex structure at 98%span of a 3D steam turbine test case(right)(Petrie-Repar 2015,Sun 2017)[9,12]
The log-dec versus nodal diameter plot for the 3D test case is shown in Figure 4(Sun 2017[12]).The minimum log-dec value is-0.4%,which is typical for last stage steam turbine blades.Even when the blade is aerodynamic unstable,the stage may be flutter-free due to the contribution of the mechanical damping.It is usually the case that the minimum log-dec is negative,therefore,the question for design engineers is does the stage have enough structural damping to overcome the negative aerodynamic damping.In that case,the quantitative prediction of the minimum log-dec is critical.However,predicting the log-dec in the design phase is challenging,and thus a large safety margin is currently applied in the design phase to avoid flutter.A high precision prediction method of log-dec in the design phase can increase the confident of engineers and contribute to the modern steam turbine development system.
A typical distribution of aerodynamic damping versus span for the least stable ND is shown in Figure 5(Sun 2017)[12].It can be seen that most of the aerodynamic work is done near the tip region.Meanwhile,the transonic flow structure near the tip is complex due to the interaction between shocks,tip leakage flow,and blade vibrations.
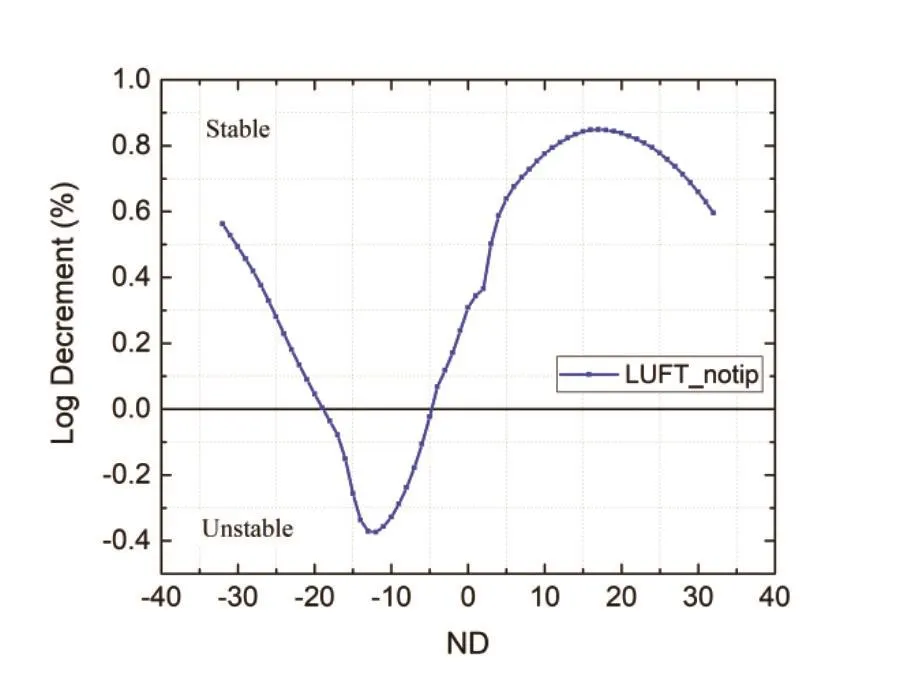
Fig.4 A typical log-dec versus ND curve of a 3D steam turbine model(Sun 2017)[12]
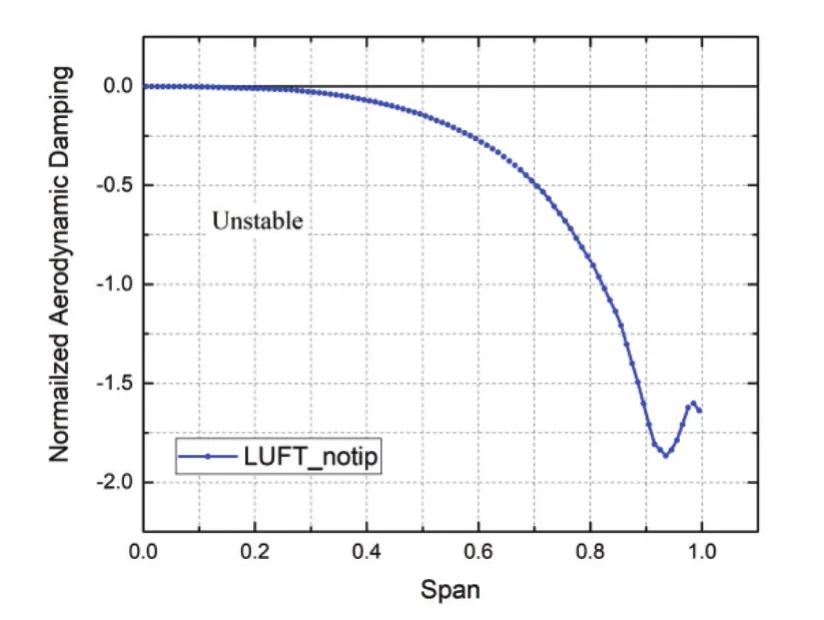
Fig.5 A typical aerodynamic damping versus span curve of a 3D steam turbine model(Sun 2017)[12]
Unfortunately,the amount of published experimental results for steam turbines flutter is limited,especially for the results in 3D realistic scale stages.Rice(2009)[1]carried an experimental analysis on a model steam turbine,in which the excitation of the blade motion was provided with an electromagnet and the blade response was measured using strain gauge sensors.Two test cases with difference mass-flow rates and same volumetric flow were analyzed to separate the aerodynamic damping and mechanical damping.The amplitude decay curve and the“half power point”method were both applied to obtain the damping value.The calculated overall damping followed a form of periodic curve with nodal diameter.The aerodynamic damping curve was obtained by subtracting the mechanical damping.A region of negative aerodynamic was shown in both cases.The results verified that the aerodynamic instability exists in modern steam turbines.Although the total damping value was positive due to the contribution of mechanical damping,the analyzed steam turbine model had a potential of flutter.Comparison between the experimental result and a corresponding inviscid simulation showed an agreement in overall shape and the presence of instability,however,magnitude and the corresponding number of nodal diameters in the numerical results were both larger than that indicated in experi-mental results.The significant error in flutter prediction indicates that an advance in numerical methods are necessary for the modern steam turbine design system.
This paper will focus on recent efforts to improve the fidelity of CFD simulations for the prediction of aerodynamic damping for flutter analysis for steam turbines.In particular,this paper will discuss the influence of the following aspects of the numerical model:time domain vs frequency domain,fluid model(ideal gas,equilibrium wet steam and non-equilibrium wet steam),boundary conditions,flow model(inviscid,URANS and DES),tip leakage modelling and multi-row effects.
2 Numerical Approach
The vibration of blade motion is generally small in the flutter cases,and a linear relationship between vibration amplitude and aerodynamic force is widely verified by both experiment and numerical studies.Meanwhile,the aerodynamic characteristics in last stage steam turbines are remarkably linear(Panovsky2000,Vogt2007)[3,13].Considering most of the unsteady disturbance in the flow field is caused by the single-frequency blade vibration,linearized solvers can have a much higher efficiency in flutter calculation than the time-marching approaches(Petrie-Repar 2010)[14].The linearized unsteady flow equations are derived by assuming small harmonic perturbations from a steady-state flow and the resulting linear equations are solved.Another advantage of the linearization approach is that it is much easier to apply exact 3D non-reflection boundary conditions on the inlet/outlet boundary than the time-marching method(Petrie-Repar 2010)[14].It has to be mentioned that the ability of linearized solvers is limited to linearized flow phenomena.The nonlinear flow effects on flutter,such as the limit cycle oscillation and wake-tip leakage flow interaction,have to be calculated by non-linearized solvers.A non-linearized solver is also required for the high-fidelity numerical simulations.
Generally,the flow structure in steam turbines is more two-dimensional than the flow in compressors and fans(Waite 2016)[4].In the past,2D flutter test cases were applied to under stand the influence of blade loading and mode shape on aerodynamic damping.Previous 2D stability analyses were performed on sections near the tip as this region has the largest contribution.By analyzing these test cases,the influence of incident angle,shock position and blade loading on aerodynamic stability were investigated(Panovsky 2000,Meingast 2009)[3,15].
Modern steam turbines are well aerodynamic designed to reduce the secondary flow losses when it works at the design point.Comparing with other turbomachines such as fans and compressors,flow in steam turbines normally has smaller separation region and less secondary flow structure.Therefore,the inviscid calculation that can capture the main flow field with a small computation cost is widely applied.
Three-dimensional viscous simulation based on URANS equation is also widely applied to the flutter prediction recently.Previous research on a gas turbine showed that the viscous calculation was necessary when the viscous effects exist in the flow field such as corner separations(McBean,2005)[16].A comparison between the inviscid and URANS approach for the prediction of aerodynamic damping is shown in Figure 6(Qi 2017)[10].This comparison shows that the influence of viscous effects on flutter is not significant in the 3D steam turbine stage at the design point.However,in order to capture the influence of tip leakage flow on flutter,viscous modelling will be necessary.
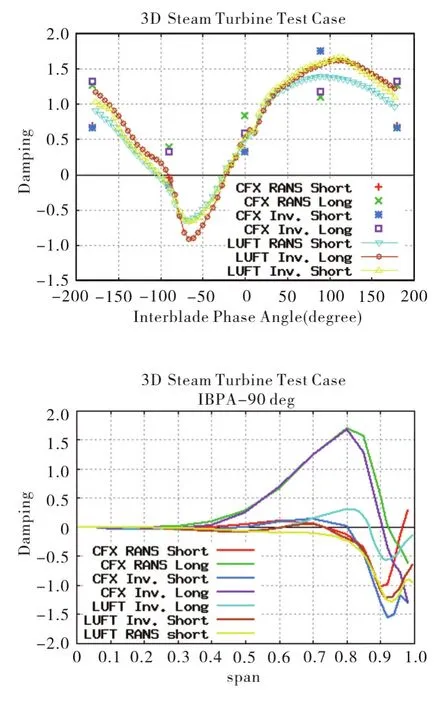
Fig.6 Normalized aerodynamic damping versus IBPA(upon)and the local work coefficient among spans(down)by difference numerical approach on a 3D steam turbine model(Qi 2017)[10]
URANS turbulence models introduce addition diffusion(eddy viscosity)to the flow.This addition diffusion does not allow for the accurate resolution of secondary vortex structures that will occur in tip leakage flows.High-fidelity turbulence models have proven their ability to capture complex secondary flow phenomenon(Riéra 2016)[17].Recent analysis on a 3D realistic-scale steam turbine stage(Sun 2018)[18]illustrated the difference in both tip leakage flow structure and blade loading between URANS and Detached-Eddy Simulation(DES).As in Figure 7,a more detailed tip leakage flow structure was captured by DES.The difference of secondary vortices in tip region can also have an influence on the flutter prediction and needs to be further analyzed.
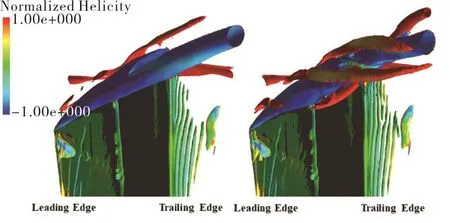
Fig.7 Instantaneous tip-clearance vortex core region by Q-criteria captured by URANS(left)and DES(right)(Sun 2018)[18]
3 Fluid Model
Typically,the effects of steam condensation are not considered in steam turbine flutter analysis.The ideal gas model is widely applied to reduce the computational cost.However,the steam in the last stages of low-pressure steam turbines is expanded below saturation conditions and regions of sub cooled steam vapor can exist due to the high expansion rates.Wetness is formed via spontaneous condensation leading to a massive release of latent heat and therefore influences the flow behavior.Once the deviation from equilibrium conditions is high enough,stable nuclei will occur.The impact of non-equilibrium effects on steam turbine aerodynamics was discussed by Starzmann(2011)[19]by comparing with experimental results.The complex flow field simulated by CFD that applied non-equilibrium wet-steam(NES)gas model shown a good agreement with the flow measurement.
Petrie-Repar(2012)[20]applied an equilibrium wet-steam(EQS)gas model on a 2D steam turbine flutter test case.Flow properties such as pressure,temperature,the speed of sound and viscosity of wet steam were calculated using formulae from IAPWS(Wanger2000)[21].The fluid was treated as a single phase and the motion of droplets was not considered.Another research(Petrie-Repar 2015)[9]applied both EQS and NES gas model on a high-stagger angle 2D steam turbine test case.In the simulation with the NES model,a rapid expansion near the throat occurred and the shock on the suction side was 6% chord further upstream than with the ideal gas model.From the left-hand side of Figure 6,the predicted aerodynamic damping distribution was almost identical for the ideal gas and wet-steam flow models when the ratio of specific heats of the ideal gas matched the polytropic index of the wet-steam steady-state solution.The change in the flow structure due to considering NES effects also affected the unsteady flutter work on the blade particularly near the shock on the suction side,which was shown in the right-hand portion of Figure 8.Fuhrer(2016)[22]performed unsteady flow simulations of the 2D steam turbine flutter test case using ANSYS CFX with an ideal gas,an equilibrium wet steam and a non-equilibrium wet steam models.The steam properties of the equilibrium wet steam and non-equilibrium wet steam calculations were also based on the IAPWS-IF97(Wanger 2000)[21].Nucleation zones were revealed near the blade leading edge and trailing edge in the NES calculations.The nucleation that occurred on the pressure side near the trailing edge caused a destabilizing effect for most inter-blade phase angles.There were differences in the local wall work distribution between EQS and NES located at the suction side downstream of the passage shock region.In conclusion,the results with the ideal gas model and the EQS model were similar,but the NES model results predicted lower aerodynamic damping values for most inter-blade phase angles.
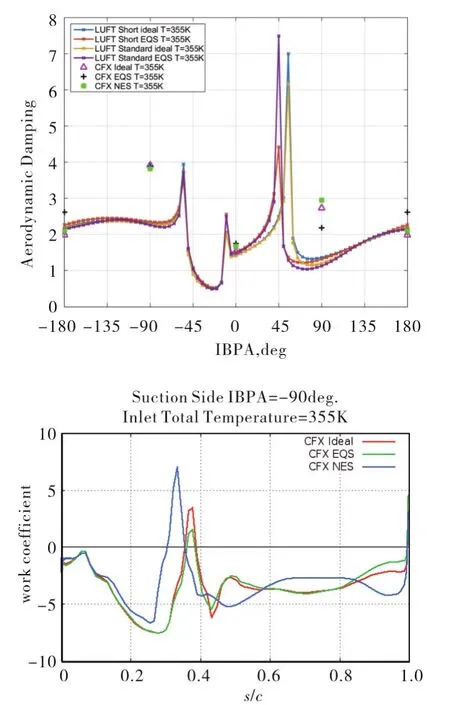
Fig.8 Normalized aerodynamic damping versus IBPA(upon)and the local work coefficient at suction side(down)on a 2D test case by the ideal gas,EQS and NES model
From those previous studies,applying EQS model does not have much influence on steam turbine flutter prediction comparing with the ideal gas model when the steam polytropic is almost constant.Meanwhile,a significant effect was shown by nucleation when the NES model was applied.Although the non-equilibrium wet steam model is physically closer to the working fluid in last stages,application of that model will require a large number of extra computation resources.As far as we are aware,there is no published result on how the nucleation influences the flutter characteristics on 3D steam urbine models.Quantitative analysis of the chosen of working fluid model for 3D steam turbine flutter prediction will be necessary in the future.
4 Boundary Reflection Effects
The location of the far-field boundaries(inlet and outlet)must be set a finite difference from the blade for unsteady flow simulations.The applied boundary condition at the far-field can generate reflected unsteady waves that propagate back into the computational domain and thus influence the unsteady flow characteristics if a proper non-reflecting boundary condition is not applied(Hall 1993)[23].A non-reflecting boundary condition should allow all outgoing unsteady waves to exit the flow domain at the far-field boundaries without reflection.Unwanted,non-physical reflections of unsteady waves at the far-field can affect the accuracy of the simulation.
A non-reflecting boundary condition is applied by decomposing the unsteady flow perturbations at the far-field into independent waves.The direction of each wave is determined and the waves are labeled as incoming or outgoing.The amplitudes of the incoming waves are set to zero,except for those that may have been prescribed at the boundary.The outgoing waves were extrapolated out of the domain.
The true test of non-reflecting boundary conditions is that the solution should be independent of the boundary location.The predicted local wall work coefficient for the last stage of a steam turbine(Petrie-Repar,2014)[24]is shown in Figure 9.The unsteady flow solutions were calculated on a short and a long domain with a 1D and an exact 3D(Petrie-Repar 2010)[14]non-reflecting boundary conditions(NRBC).It can be seen that the solutions calculated with the 3D-NRBC are similar for both domains while there are differences in the solutions calculated with the 1D-NRBC.The solutions are similar for the pressure side(not labelled)but there are differences on the suction side due to reflections from the outlet boundary.

Fig.9 Local work coefficient at 90%span for a steam turbine blade.Results calculated with 1D and 3D non-reflecting boundary conditions and on a short and a long domains.(Petrie-Repar 2014)[24]
5 Tip Leaksge Flow Effects
The tip leakage flow driven by pressure gradient,flows from the pressure side of the blade to the suction side.A tip leakage vortex is formed due to the interaction between the tip leakage flow and the main flow(Sjolander 1997)[25].Transonic tip-clearance flow does influence the loading on the blade near the tip and can have an effects on the blade aerodynamic stability(Bunker 2006,Teixeria 2014,Sun 2017)[26,28,12]as most of the aerodynamic work contributing to flutter is done near the tip region,see Figures 5.
The tip clearance effect on flutter prediction of a 3D realistic-scale steam turbine test case was analyzed by Sun(2017)[12].The analysis indicated that the tip leakage flow generates a low Mach number region on the suction side of blade tip,which influenced the flow structure near the tip region.The tip clearance flow did not have a significant effect on the overall shape of the damping versus IBPA curve,as in the Figure 10.However,a significant difference in wall work coefficient at the 98%span was found(Figure 10).In this 3D steam turbine test case,the tip clearance flow had a stabilization effect on flutter,and the main effect was on the suction side at near tip region.
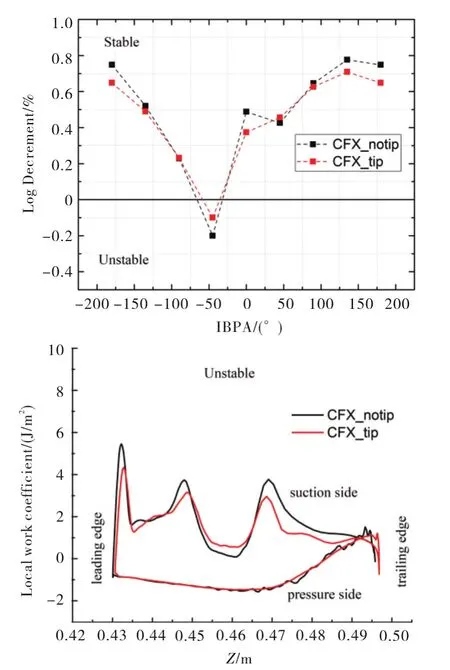
Fig.10 Log-dec versus IBPA curve(upon)and Local work coefficient distribution at 98%span(down)of a 3D steam turbine test case(Sun 2017)[12]
The previous work investigating the influence of tip clearance flow on flutter were based on URANS flow simulations(Sun 2017)[12].In recent work(Sun 2018)[18],a high-fidelity numerical model(DES)was used to resolve the detailed tip-clearance vortex structures that cannot be captured by URANS simulations(Figure7).Application of high-fidelity numerical models will help researchers gain a deeper understanding of the tip leakage flow effect on steam turbine aerodynamic stability.
6 Mulit-row Effects
Usually,the flutter analysis of a steam turbine only considers a single row as multi-row flutter analyses require a significant increase in computational effort.The multi-row effects are due to pressure waves generated by the vibrating blade reflecting back from upstream and downstream stator rows.These reflected waves can generate additional unsteady aerodynamic forces on the rotor blade and thus influence the blade aerodynamic stability(Buffum1995)[27].Previous work on the influence of multi-row effects on steam turbine flutter is limited to the work done by Huang(2006)[8],which analyzed the influence of the upstream stator on a low-pressure steam turbine.The upstream stator had a strong influence on the predicted damping value and the influence was also found to be strongly dependent on the axial distance between stator and rotor.The log-dec for the least stable mode(nodal diameter-11)was found to increase from-1.318% for the isolated row to-0.913% for the multi-row prediction.
The relative flow at the inlet of a steam turbine blade is generally subsonic and most of the acoustic waves are cut-off.Conversely,the relative flow at the outlet is generally transonic and most of the acoustic waves are cut-on.Considering that reflections from neighboring rows are more likely when the acoustic modes are cut-on,it is suspected that reflections from a downstream stator on the second-last stage turbine row could be more significant than the influence of the upstream stators.This is yet to be investigated in the open literature.
7 Conclusions
Flutter analysis is an important task in the design phase of modern steam turbines.With the development of experimental facilities and computation capacity,a greater understanding of steam turbine flutter phenomenon has been obtained in the past decades.The numerical approaches to predict flutter at the design phase kept improving and more physical effects have been considered in this aeroelastic problem.Balancing between precision and efficiency,the precision of flutter prediction increased as well as the requirement of computation resource.The advances in numerical approach,fluid model,boundary reflection effects,tip leakage flow effects,and multi-row effects are presented in this paper.Other aspects of model improvement in steam turbine flutter prediction were not discussed in this paper,such as the influence of mistuning and friction damping.
Although some of those advanced numerical models are currently not time-affordable for the industry,further research in these areas can help researchers understand the quantitative error in current flutter prediction method.Meanwhile,development of advanced models that can capture the similar physical phenomenon with fewer computation costs is also important.Future analyses that apply those state-of-art numerical tools can be a reference for the industrial flutter prediction approach,and thus help improve the modern steam turbine design system.
Acknowledgements
The support provided by China Scholarship Council(CSC)during a visit of Tian-rui Sun to KTH Royal Institute of Technology is acknowledged.
