Syntheses and calculation of (E)-4-chloro-4’-ethoxystilbene and (E)-4,4’-dichlorostilbene
2018-10-17ChengJinjinGeYuhua
Cheng Jinjin Ge Yuhua
(College of Chemistry and Chemical Engineering, Southeast University, Nanjing 210096, China)
Abstract:(E)-4-chloro-4’-ethoxystilbene (2a) and (E)-4, 4’-dichlorostilbene (2b) were synthesized by the Witting-Horner reaction. The crystals of 2a and 2b were prepared through solvent evaporation and characterized by the single-crystal X-ray diffraction. Molecular structure analysis confirms the E-configuration ofbond. The crystal of 2a reveals an orthorhombic and space group Pna21 structure while 2b shows a monoclinic and space group P21/c structure. The electronic structures of 2a and 2b were optimized at B3LYP/6-311++G (d,p) level. The Hirshfeld surface and fingerprint plot indicate close O—H and Cl—H contacts and π—π stacking in 2a and 2b. Molecular electrostatic potential shows that the O and Cl atoms of 2a and Cl atoms of 2b have the minimum energies and they are more likely to be attacked by electrophiles in reaction. Frontier molecular orbitals analysis demonstrates that the ΔELUMO-HOMOof 2a and 2b are 3.85 and 3.91 eV, respectively.
Keywords:1, 2-diphenylethylene; crystal structure; density functional theory; synthesis
1,2-Diphenylethylene possesses special biological activity and interesting fluorescence property, which can be widely used in both pharmaceutical and material chemistry applications. For example, trans-3, 4, 5-trihydroxystilbene is of potent antioxidant effect, which can be used for anticancer, anti-arteriosclerosis and reducing blood fat[1-2]. Some other 1,2-diphenylethylene derivatives were universally applied as organic optical storage materials, molecular switch materials, photon laser scanning microscopy, and fluorescent dye[3-4]. Therefore, the investigation of these compounds attracted considerable research attention. They can be prepared by the Perkin reaction, Knoevenagel reaction[5]and so on. However, most of these methods present problems such as poor steroselectivity and strict reaction conditions. Therefore, the development of convenient and efficient methods is of great interest to chemists. We decided to employ the Witting-Horner reaction for this purpose. First of all, the reaction is stereoselective and favors the E-configuration in stilbene products. In addition, the conditions of the reaction are moderate and vigorous exclusion of oxygen and moisture is not necessary. Moreover, the yield is relatively higher. We would also like to explore the structure and properties of E-stilbenes through theoretical calculations. Information about charge transfer and structure properties are obtained by the Mulliken charge distribution and Frontier molecular orbital. The reactivity of the compounds can be measured by the electrostatic potential. In summary, the overall research can be of great value in the synthesis and structural studies of E-stilbenes.
1 Experimental
1.1 Materials and measurements
All reagents were purchased from Aldrich Chemical Co. and were used without further purification. The1H NMR spectra were recorded at 303 K on a Bruker Avance 400 MHz NMR spectrometer using DMSO-d6as solvent and TMS as an internal standard. The UV-vis absorption spectra were recorded on a Shimadzu UV-3600 spectrometer.
1.2 Procedure of preparation
The mixture of benzyl chloride (100 mmol) and triethoxyphosphine (150 mmol) was stirred at 140 ℃ for 8 h and the product diethyl benzylphosphonate was purified through vacuum distillation. A solution of diethyl benzylphosphonate (10.0 mmol) in anhrdrous tetrahydrofuran (30 mL ) was stirred under nitrogen atmosphere for 0.5 h at 0 ℃ and 60% NaH (15.0 mmol) was added portionwise. Benzaldehyde (1a or 1b, 7.5 mmol) was added dropwise into the solution and the reaction mixture was stirred for 2 to 3 h at 0 ℃[6-7]. The reaction mixture was poured into cold water (150 mL) to precipitate the product. The crude product was purified by recrystallization (m(CH3OH):m(EtOAc)=1∶1). The synthesis process is shown in Fig.1.
(E)-4-Chloro-4’-ethoxystilbene(2a). Yield: 90.9%; melting point 175 to 177 ℃; IR (KBr, cm-1) 3 018, 2 978, 1 603, 969, 835, 723;1H-NMR(400 MHz, DMSO) δ 7.58 to 7.53 (m, 4H), 7.42 (d, 2H), 7.23 (d,J=16.0 Hz, 1H), 7.09 (d,J=16.0 Hz, 1H), 6.94 (d, 2H), 4.05 (q, 2H), 1.34 (t, 3H).
(E)-4,4’-dichlorostilbene (2b). Yield: 76.3%; melting point 74 to 76 ℃; IR (KBr, cm-1) 3 060, 2 924, 963, 811, 740, 717;1H-NMR (400 MHz, DMSO) δ 7.86 to 7.83 (dd, 1H), 7.63 (d, 2H), 7.48 to 7.46 (dd, 1H), 7.43 (d, 2H), 7.44 (d,J=16.4 Hz, 1H), 7.38 to 7.28 (m, 2H), 7.29 (d,J=16.4 Hz, 1H).
1.3 X-ray crystallography
Colorless crystals of 2a (CCDC: 1573662) and 2b (CCDC: 1573663) were grown by slow evaporation from methanol and analyzed by ENRAF NONIUS CAD4 serial X-ray diffractometer equipped with a graphite-monochromatic MoKα radiation (λ= 0.071 073 nm) at 298 K. The OPTEP drawings and numbering scheme of crystals are exhibited in Fig.2. The X-ray diffraction data and refinements are shown in Tab.1. Crystograpphic data is deposited in Cambridge Crystallographic Data Centre.
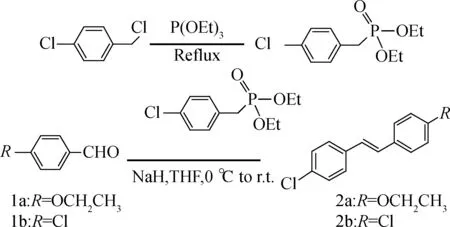
Fig.1 The synthesis of 2a and 2b

ParameterCrystal of 2aCrystal of 2bChemical formulaC16H15ClOC14H10Cl2Formula weight258.73249.12Crystal systemOrthorhombicMonoclinicSpace groupPna21P21/CCrystal density/(g ·cm-3)1.2591.380a/nm0.624 50.480 8b/nm0.742 31.027 3c/nm2.945 71.232 0α/(°)9090β/(°)9099.79γ/(°)9090V/nm31.365 50.599 7Formula units44Crystal size/(mm×mm×mm)0.30×0.30×0.100.20×0.10×0.10T/K293293Index range0


(d)Fig.2 OPTEP drawings and numbering schemes. (a) 2a; (b) 2b
2 Computational Methods
All the structures were optimized using B3LYP[8]method and 6-311++G (d, p)[9]basis set in Gaussian 09 software. B3LYP defines the exchange functional as a linear combination of Hatree-Fock, local and gradient-corrected exchange terms. 6-311G uses three sizes of contracted functions for each orbital-type. Meanwhile, the diffuse function can deal with molecules with lone pairs and polarized function allow orbitals to change size. After the optimization, the wave functions were acquired. Then, the Frontier molecular orbital and electrostatic potential are analyzed. The molecular Hirshfeld surface[10]of a crystal is constructed through partitioning the space into regions, which is determined by electron distribution. Normalized contact distancednormis used for mapping the surfaces and is calculated by the following equation:
wherediis the distance from Hirshfeld surface to the nearest nucleus internal;deis the distance from the surface to the nucleus external;rivdwis the van der Waals radius of the atom of the nearest nucleus internal andrevdwis the van der Waals radius of the atom of the nearest nucleus external. All of them are normalized by the van der Waals radius of the atom involved.
3 Results and Discussion
3.1 Crystal structure


Tab.2 Selected bonding length and bonding angle determined by experiment and B3LYP of 2a

Tab.3 Selected bonding length and bonding angle determined by experiment and B3LYP of 2b
3.2 Hirshfeld surface and fingerprint plot
The molecular Hirshfeld surface and fingerprint plot can be utilized to provide information about three-dimensional intermolecular interactions in crystal. Three-dimensional maps are generated withdnorm, where the atoms make intermolecular contactors closer than van der Waals radii and the contacts are highlighted in red. White and blue indicate van der Waals contacts and ones longer than van der Walls contacts, respectively. Two-dimensional fingerprint plots are derived from the Hirshfeld surface, which summarizes the complex information according to the combination ofdeanddi. Points on the plot are colored from green to blue with the increment of the contribution, while points with no contribution on the surface are left uncolored. The deep circular depressions on the surface represent hydrogen bonding contacts. Clearly, Fig.3 shows strong interactions between O—H and Cl—H. π—π interactions are colored as red and blue triangles. Fig.4 shows that there are considerable interactions between Cl—H. Two-dimensional fingerprint plots of 2a (see Fig.5) shows four sharp spikes, which means that interaction appears between two adjacent molecules in the crystal structure. Points with no contribution to the surface are left uncoloured, points with small contribution are left green and points with more contribution are left blue. Reciprocal Cl—H and O—H offer contribution to the Hirshfeld surface with 16.3% and 4.3%, respectively. Therefore, it can be concluded that close contacts are mainly due to C—H—Cl and C—H—O hydrogen bonding.

(a) (b) (c)

(a) (b) (c)

(a)(b)(c)

(d) (e)
Fig.5Two-dimensional fingerprint plots of 2a. (a) Full reciprocal; (b) Cl—H reciprocal; (c) O—H reciprocal; (d) H—H reciprocal; (e) C—H reciprocal
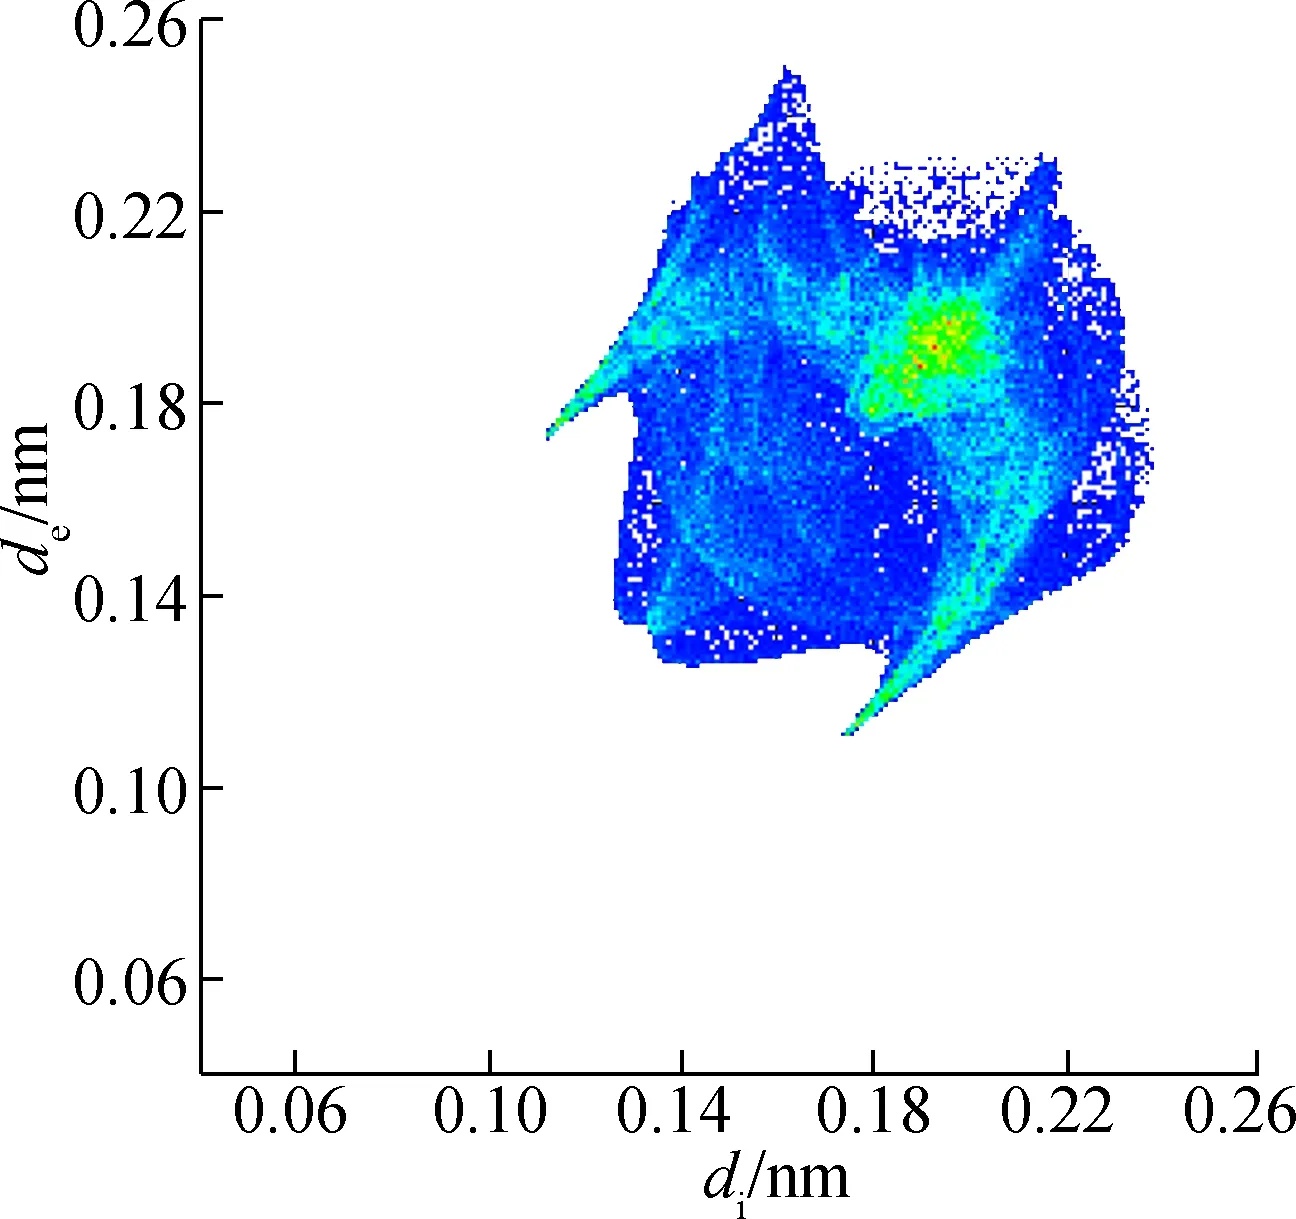
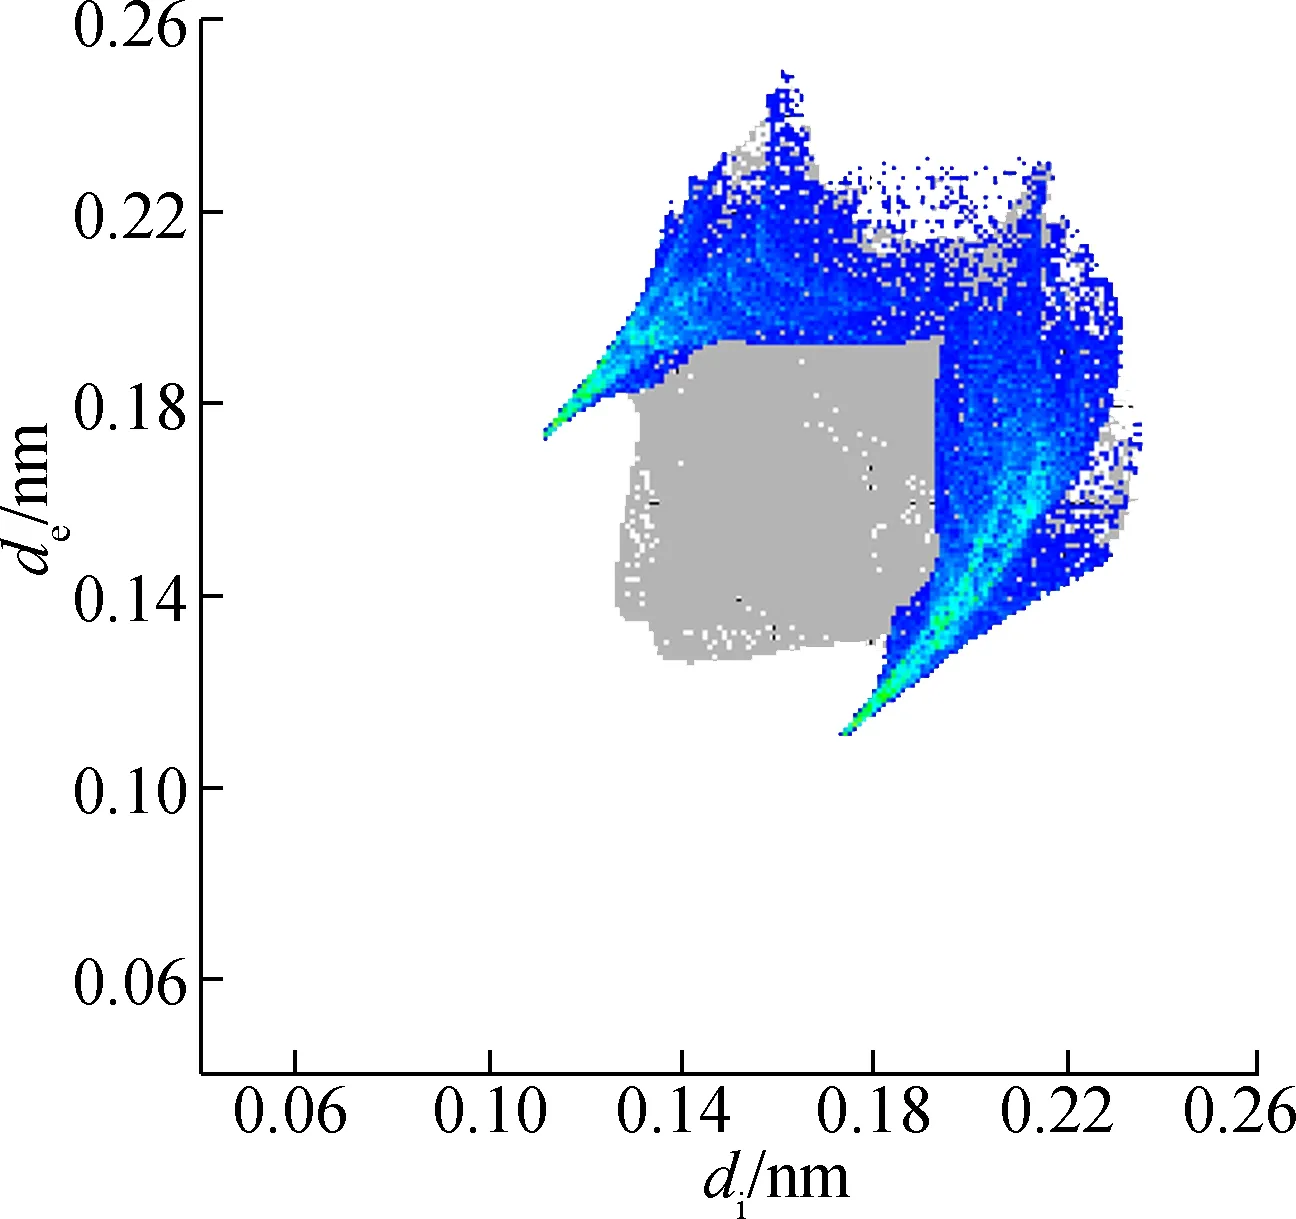
In addition, the reciprocal Cl—H of 2b (see Fig.6) is 31.5%, which means that C—H—Cl hydrogen bonding contributed significantly to the Hirshfeld surface. Points with no contribution to the surface are left uncoloured, points with small contribution are left green and points with more contribution are left blue. As close contacts are mainly contributed by hydrogen bonding, C—H—Cl and C—H—O are the hydrogen bonding of 2a, and C—H—Cl is the hydrogen bonding of 2b. Thus, the results are consistent with single crystal structures.
(a)
(b)

(c)

(d)Fig.6 Two-dimensional fingerprint plots of 2b. (a) Full reciprocal; (b) Cl—H reciprocal; (c) H—H reciprocal; (d) C—H reciprocal
3.3 Mulliken charge


Tab.4 Mulliken charge of 2a

Tab.5 Mulliken charge of 2b
3.4 Molecular electrostatic potential
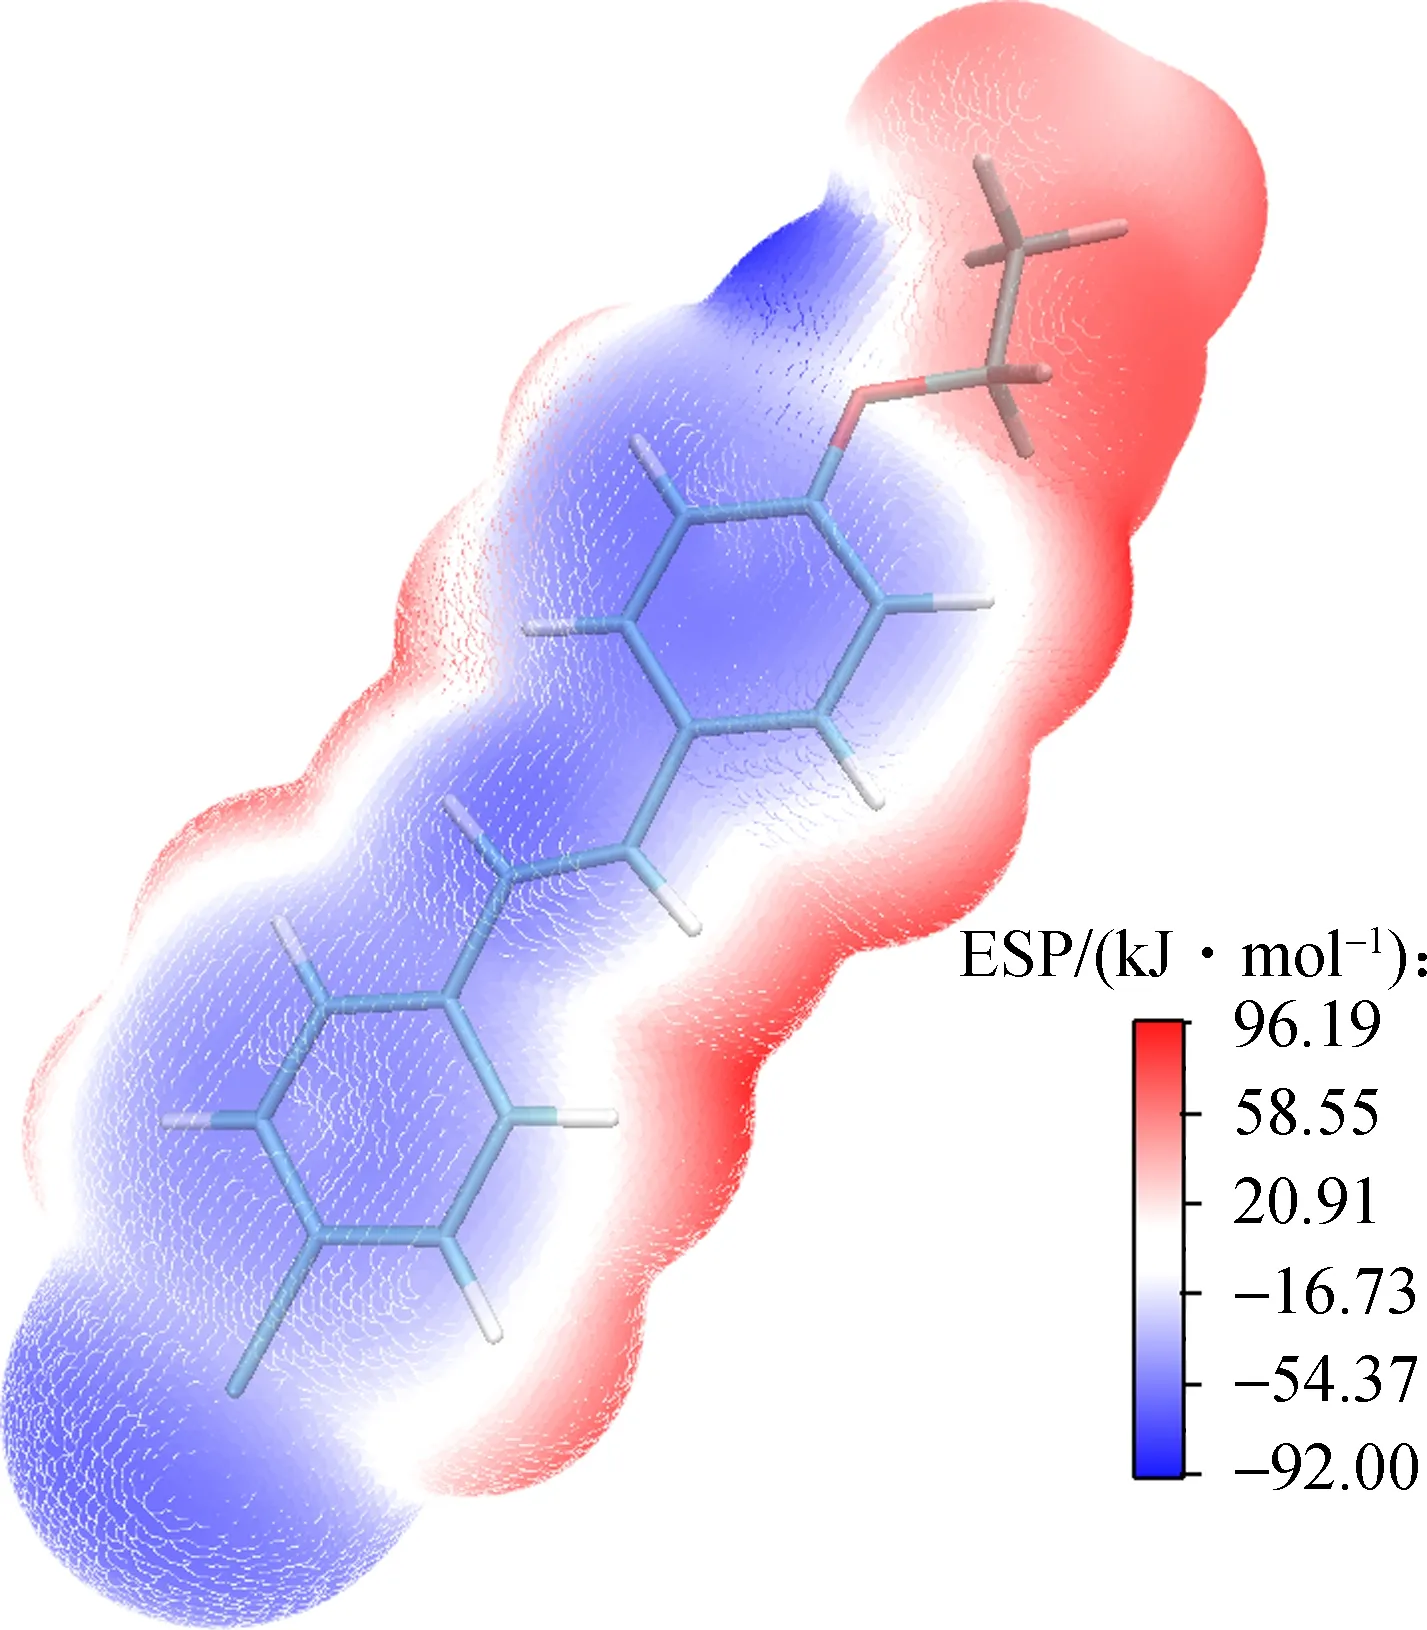
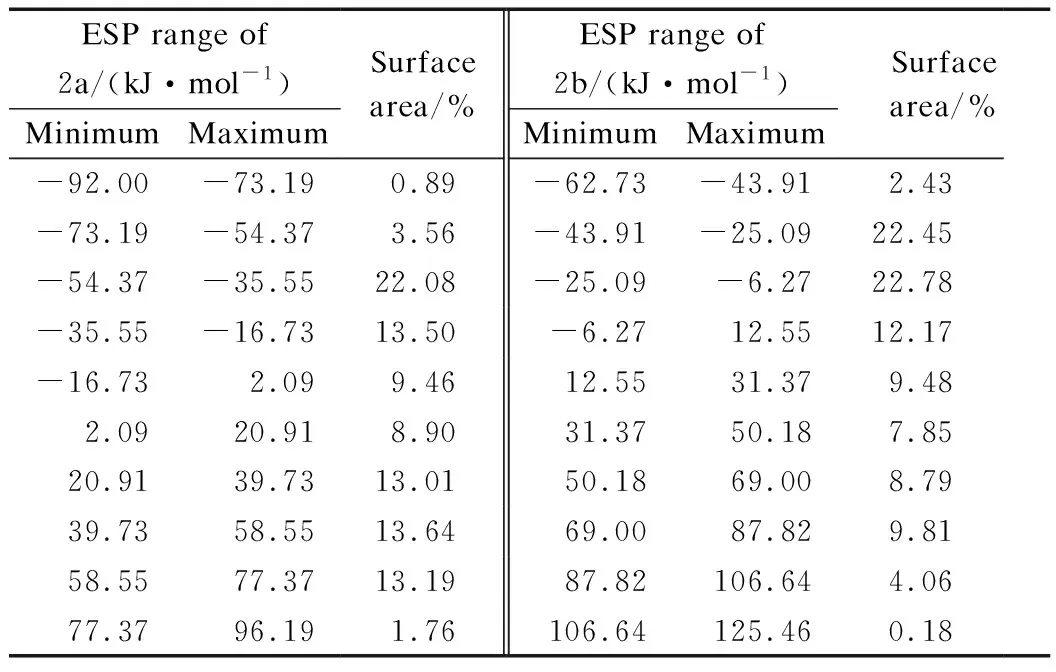
Electrostatic potential (ESP) over molecular van der Waals surface is critical for understanding chemicalreactivities, charge density and delocalization. In-depth investigation of ESP can provide deeper understanding of the structure. Fig.7 presents ESP-mapped molecular van der Waals surface of 2a and 2b. Molecular surface areas in ESP range, which are useful to quantitatively discuss the ESP distribution on the whole molecular surface of the products, as shown in Tab.6. According to Fig.7, lone pair of O atom leads to an ESP minima (-86.65 kJ/mol), which is the most negative on the van der Waals surface. Furthermore, the ESP minima located near the Cl atom have a value of -60.14 kJ/mol. As for 2b, the distribution of the minima is more symmetric, and for the two minima near two Cl atoms, which have a value of -47.38 kJ/mol. Each surface maximum corresponds to a hydrogen atom and the global maximum one of 2a and 2b are 91.96 and 108.90 kJ/mol, respectively. The surface areas of 2a and 2b are 3.1585 and 2.8184 nm2, respectively. In Fig.5, the negative values of ESP for 2a are concentrated between -54.37 and -35.55 kJ/mol (35.58%), while the positive values of ESP are concentrated in the range of 20.91 to 58.55 kJ/mol (40.00%). However, the distribution in 2b is symmetrical and moderate.
(a)

(b)Fig.7 Molecular electrostatic potential map. (a) 2a; (b) 2b
3.5 Frontier molecular orbitals
Frontier molecular orbitals have a critical role in determining the structures and properties of chemicals. The highest occupied molecular orbitals (HOMO) and lowest unoccupied molecularorbitals (LUMO) were calculated. LUMO+2, LUMO+1, LUMO, HOMO, HOMO-1 and HOMO-2 orbitals of 2a and 2b are presented in Fig.8 and the relevant information is listed in Tab.7. According to the results, the energy of HOMO and LUMO is -5.607 and -1.758 eV for 2a and -6.058 and -2.146 eV for 2b. Both products are stable as the energies of HOMO and LUMO, including neighboring orbitals, are all negative. HOMO and LUMO is known as the reference of electron donating and electron accepting potential. Higher ΔELUMO-HOMOmeans greater stability. ΔELUMO-HOMOof 2a and 2b are 3.85 and 3.91 eV, respectively.
Tab.6The distribution of molecular surface areas of 2a and 2b within different ESP ranges
ESP range of 2a/(kJ·mol-1)MinimumMaximumSurface area/%ESP range of 2b/(kJ·mol-1)MinimumMaximumSurface area/%-92.00-73.190.89-62.73-43.912.43-73.19-54.373.56-43.91-25.0922.45-54.37-35.5522.08-25.09-6.2722.78-35.55-16.7313.50-6.2712.5512.17-16.732.099.4612.5531.379.482.0920.918.9031.3750.187.8520.9139.7313.0150.1869.008.7939.7358.5513.6469.0087.829.8158.5577.3713.1987.82106.644.0677.3796.191.76106.64125.460.18

Fig.8Molecular frontier orbitals from HOMO-2 to LUMO+2. (a) 2a; (b) 2b

Tab.7 The energies of molecular orbitals and the energy gap of HOMO and LUMO eV
4 Conclusion
(E)-4-chloro-4’-ethoxystilbene (2a) and (E)-4, 4’-dichlorostilbene (2b) were synthesized and their single crystals were characterized. Compound 2a presented an orthorhombic space group Pna21 structure and 2b was found to be a monoclinic space group P21/c structure. Hirshfeld analyses revealed close O—H and Cl—H contacts in the crystal structure of 2a, while close Cl—H contacts existing in 2b. Electrostatic potential showed that O and Cl of 2a and Cl of 2b have most negative values. Therefore, they are more likely to undergo electrophilic attack. HOMO and LUMO orbitals of the benzene rings in both compounds are calculated according to the Frontier molecular orbitals and ΔELUMO-HOMOof 2b is higher than that of 2a.
杂志排行
Journal of Southeast University(English Edition)的其它文章
- Mathematical models for properties of mortars with admixtures and recycled fine aggregates from demolished concretes
- Damage evolution analysis of cast steel GS-20Mn5V based on modified GTN model
- Analogy-based software effort estimation using multi-objective feature selection
- A recognition model of survival situations for survivable systems
- A weighted selection combining schemefor cooperative spectrum prediction in cognitive radio networks
- Experimental study of the onset of nucleate boiling in vertical helically-coiled tubes
