Mathematical models for properties of mortars with admixtures and recycled fine aggregates from demolished concretes
2018-10-17MiRenjiePanGanghuaLiYangLuXiaojun
Mi Renjie Pan Ganghua Li Yang Lu Xiaojun
(1School of Materials Science and Engineering, Southeast University, Nanjing 211189, China)(2Jiangsu Key Lab of Construction Materials, Southeast University, Nanjing 211189, China)(3Jiangsu Collaborative Innovation Center, Southeast University, Nanjing 211189, China)(4Jiangsu Zhenjiang Research Institute of Building Science Group Co., Ltd, Zhenjiang 212004, China)
Abstract:In order to expand the engineering application of recycle aggregate mortars (RAM) with aggregates from demolished concretes, the models for the properties of RAM and the replacement rate of these recycled fine aggregates were proposed. First, different kinds of mathematical models for the basic properties (compressive strength, water retention rate, and consistency loss) of RAM with two kinds of admixtures, thickening powders (TP) and self-made powdery admixtures (SSCT) designed for RAM, and the replacement rates were established, while the average relative errors and relative standard errors of these models were calculated. Additionally, the models and their error analyses for the curves of drying shrinkage and curing time of RAM+SSCT at different replacement rates were put forward. The results show that polynomial functions should be used to calculate the basic properties of RAM+TP and RAM+SSCT at different replacement rates. In addition, polynomial functions are the most optimal models for the sharp shrinkage sections in the curves of drying shrinkage-curing time of RAM+SSCT, while exponential functions should be used as the models for the slow shrinkage sections and steady shrinkage sections.
Keywords:demolished concrete; recycled fine aggregates; admixtures; recycled aggregate mortars; mathematical model
Last decade,the amount of construction and demolition waste (CDW) generated by the building industries in China accounted for 30% to 40% of the total waste[1]. Therefore, using the recycled fine aggregates (RFA) produced by CDW to replace natural fine aggregate (NFA), can not only reduce the exploitation of natural sand, which may release a significant amount of CO2into the environment, but also lower the pollution generated by CDW.
However, the disadvantages of RFA from CDW, such as a high water absorption and high micro powder content, have resulted in poor properties of recycled aggregate mortars (RAM), which have led to severe restrictions on its engineering application[2-3]. Thus, for the sake of high-performance RFA, different strengthening methods were used to lower the water absorption and powder content of RFA[4-9]. Unfortunately, the procedures in the aforesaid methods were long and complex. Therefore, admixtures were used to decrease the adverse effects of the micro powder from RFA on RAM. As a result, the properties of RAM were in accord with the requirements of Chinese specifications[10].
Adopting admixtures to overcome the adverse effects of RFA from CDW on RAM can improve the efficiency during actual engineering application. However, fewer mathematical models for the properties of RAM with admixtures were reported. In this paper, different kinds of mathematical models are used to analyze the relationships between the compressive strengthfcu, water retention rateWand consistency lossSof the RAM with two kinds of admixtures, thickening powders (TP) used for normal mortars and powdery admixtures (SSCT) designed for RAM, and the replacement rateRof RFA, respectively. Meanwhile, the models for drying shrinkage and curing time are proposed.
1 Experiments and Mathematical Analyses
1.1 Experiments
P·O 42.5 Portland cement was provided by the Jiangsu Helin Cement Corporation, while the CDW originated from the housings at 1980s was offered by the Jiangsu Zhenjiang Research Institute of Building Science Group Co., Ltd, and the river sand was used as the natural fine aggregate (NFA). Meanwhile, the Zhenjiang Jianbi Power Plants afforded the fly ash (FA), and the mix water stems from laboratory taps. Moreover, the thickening powder (TP) was supplied by the Jiangsu Zhenjiang Research Institute of Building Science Group Co., Ltd, and the SSCT was designed by the authors for the mortars with recycled aggregates from CDW.
The mixture proportions are listed in Tab.1. According to Chinese standard JGJ/T 70—2009, compressive strength was obtained by the 70.7 mm×70.7 mm×70.7 mm specimens after being curried for 28 d. Drying shrinkage was obtained from the 40 mm×40 mm×160 mm specimens, which were placed in the laboratories at a temperature of (20±2) ℃ and humidity of (60±5)%, every day during the time of 2 to 13 d and 17 to 28 d, and every fifth day during the time of 33 to 53 d and 60 to 90 d. The water retention rate at 2 h was obtained by the fresh mortar specimens. According to Chinese specification GB/T 25181—2010, consistency loss was obtained from the fresh mortar specimens which were put into the environment at a temperature of (23 ± 2) ℃ and humidity of (50±5)%.
Tab.1Mixture proportions of mortars at per cubic meters

Mortar typem(cement)/kgm(FA)/kgm(NFA)/kgm(RFA)/kgm(admixtures)/kgConsistency/mmRAM+TP240600 to 1 050450 to 1 50020.070 to 90RAM+SSC240600 to 1 050450 to 1 50022.370 to 90
1.2 Mathematical analyses
By using the software Excel, exponential functions, linear functions, logarithmic functions, polynomial functions and power functions were used to analyze the relationships between the basic properties (compressive strength, water retention rate and consistency loss) of mortars and the replacement rates. Meanwhile, the models for drying shrinkage-curing time were proposed. Furthermore, the correlation coefficientr, average relative errorsδand relative standard errorserof these models were put forward. According to Chinese specification JGJ/T 23—2011, the equations of average relative errors and relative standard errors are as follows:
(1)
(2)
wherenis the amount of experimental data;Ais the values gained from the experiment for the properties of mortars; andBis the values gained from regression equations for the properties of mortars.
2 Results and Discussion
2.1 Compressive strength and replacement rate of recycled fine aggregates
Fig.1 plots the experimental values for the compressive strength of mortars at different replacement rates. After calculation, the equations of the exponential function, linear function, logarithmic function, polynomial function and power function for the compressive strength of RAM+TP at different replacement rates are as follows:
fcu=7.970 2e0.0053R
(3)
fcu=0.061 8R+7.390 4
(4)
fcu=3.344 7ln(R)-2.262 5
(5)
fcu=0.000 7R2-0.035 2R+10.073
(6)
fcu=3.456 4R0.289 3
(7)
Additionally, the equations of the exponential function, linear function, logarithmic function, polynomial function and power function for the compressive strength of RAM+SSCT at different replacement rates are as follows:
fcu=10.264e0.005 8R
(8)
fcu=0.089R+9.372 7
(9)
fcu=4.93ln(R)-4.988 4
(10)
fcu=0.000 7R2-0.000 4R+11.845
(11)
fcu=3.977 9R0.324 4
(12)
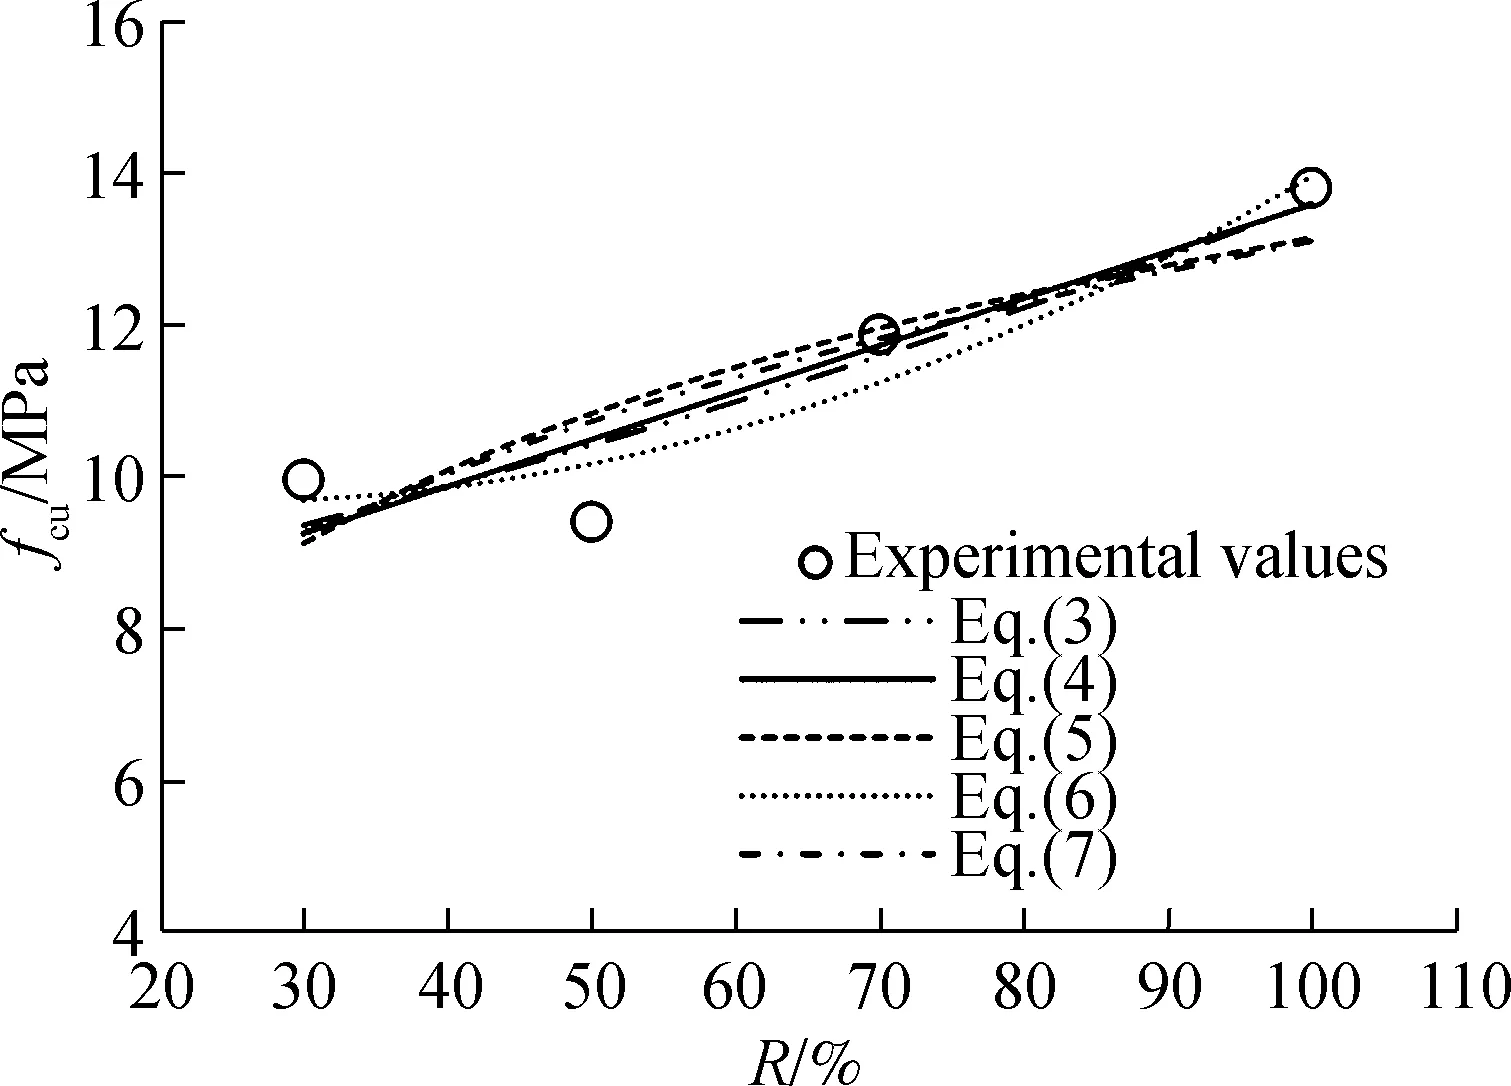
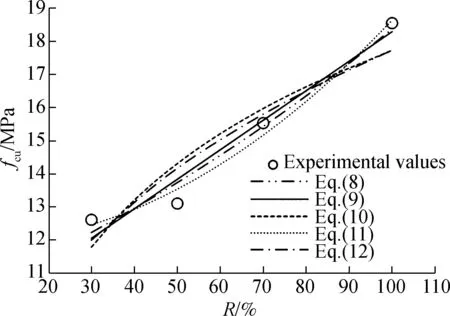
Furthermore, the equational curves of these equations are shown in Fig.1, while the regression coefficient and errors for these equations are listed in Tab.2. It can be seen that the polynomial functions, Eqs.(6) and (11), have the highest regression coefficient and least errors. Hence, they are suggested as the models for the compressive strength of RAM+TP and RAM+SSCT at different replacement rates, respectively.
(a)
(b)
Tab.2Regression coefficient and errors of models for compressive strength of mortars at different replacement rates

EquationEq.(3)Eq.(4)Eq.(5)Eq.(6)Eq.(7)Eq.(8)Eq.(9)Eq.(10)Eq.(11)Eq.(12)Regression coefficient r20.834 70.854 00.735 10.909 80.721 40.964 60.958 40.864 80.984 00.884 4Errorδ/%± 5.18± 5.25± 7.02± 4.78± 6.45± 2.40± 2.97± 5.69± 1.97± 4.71er/%6.947.539.736.158.933.34.167.042.535.94
2.2 Consistency loss at 2 h and replacement rate of recycled fine aggregates
Fig.2 plots the experimental values of the consistency loss of mortars at different replacement rates. After calculation, the equations of the exponential function, linear function, logarithmic function, polynomial function and power function for the consistency loss of RAM+TP at different replacement rates are as follows:
S=30.511e0.005R
(13)
S=0.210 9R+28.819
(14)
S=12.046ln(R)-6.687 8
(15)
S=0.000 2R2+0.187 6R+29.464
(16)
S=13.043R0.287 3
(17)
Additionally, the equations of the exponential function, linear function, logarithmic function, polynomial function and power for the consistency loss of RAM+SSCT at different replacement rates are as follows:
S=9.330 1e0.011 8R
(18)
S=0.232 5R+5.913 1
(19)
S=13.521ln(R)-34.205
(20)
S=0.000 8R2+0.340 8R+2.916 8
(21)
S=1.135 6R0.703 5
(22)
Furthermore, the equational curves of these equations are shown in Fig.2, while the regression coefficient and errors for these equations are listed in Tab.3. It can be seen that the polynomial functions, Eqs.(16) and (21), have the greatest regression coefficient and least errors. Hence, they are suggested as the models for the consistency loss of RAM+TP and RAM+SSCT at different replacement rates, respectively.

(a)

(b)

Equation Eq.(13)Eq.(14)Eq.(15)Eq.(16)Eq.(17)Eq.(18)Eq.(19)Eq.(20)Eq.(21)Eq.(22)Regression coefficient r20.998 70.999 70.959 91.000 00.978 20.954 00.993 00.988 80.998 70.998 2Errorsδ/%±0.46±0.23±2.61±0.23±1.89±6.58±2.74±3.20±1.21±1.11er /%0.550.283.020.312.207.753.633.781.461.53
2.3 Water retention rate and replacement rate of recycled fine aggregates
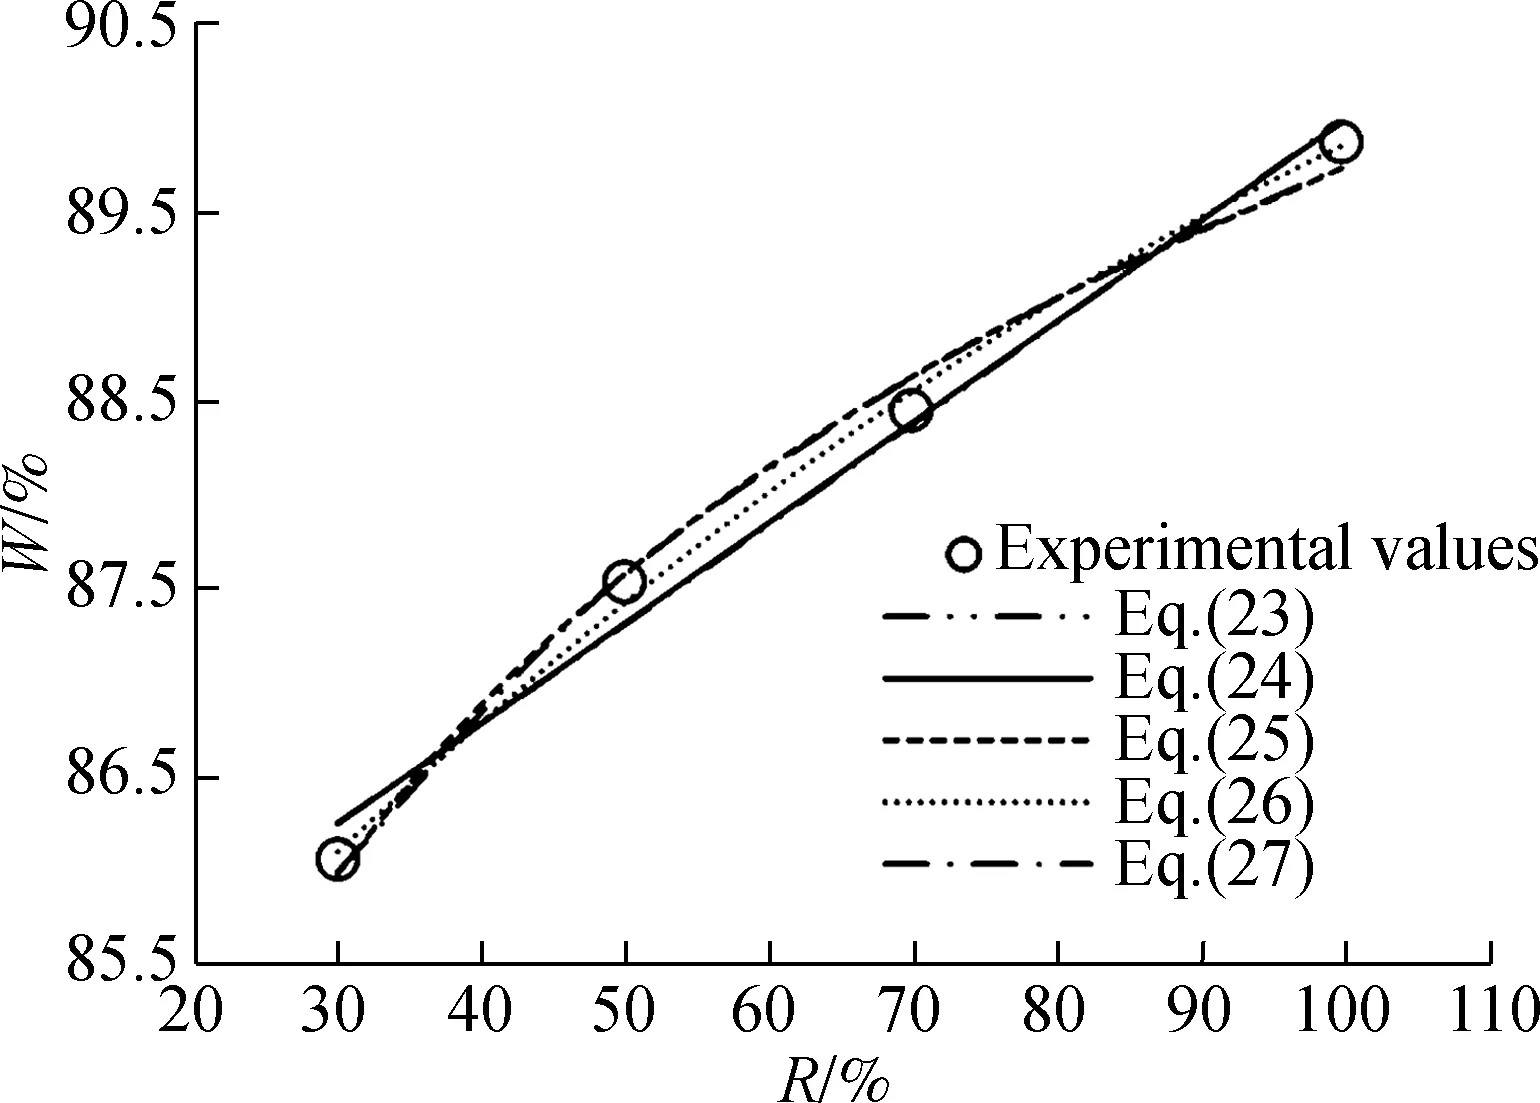
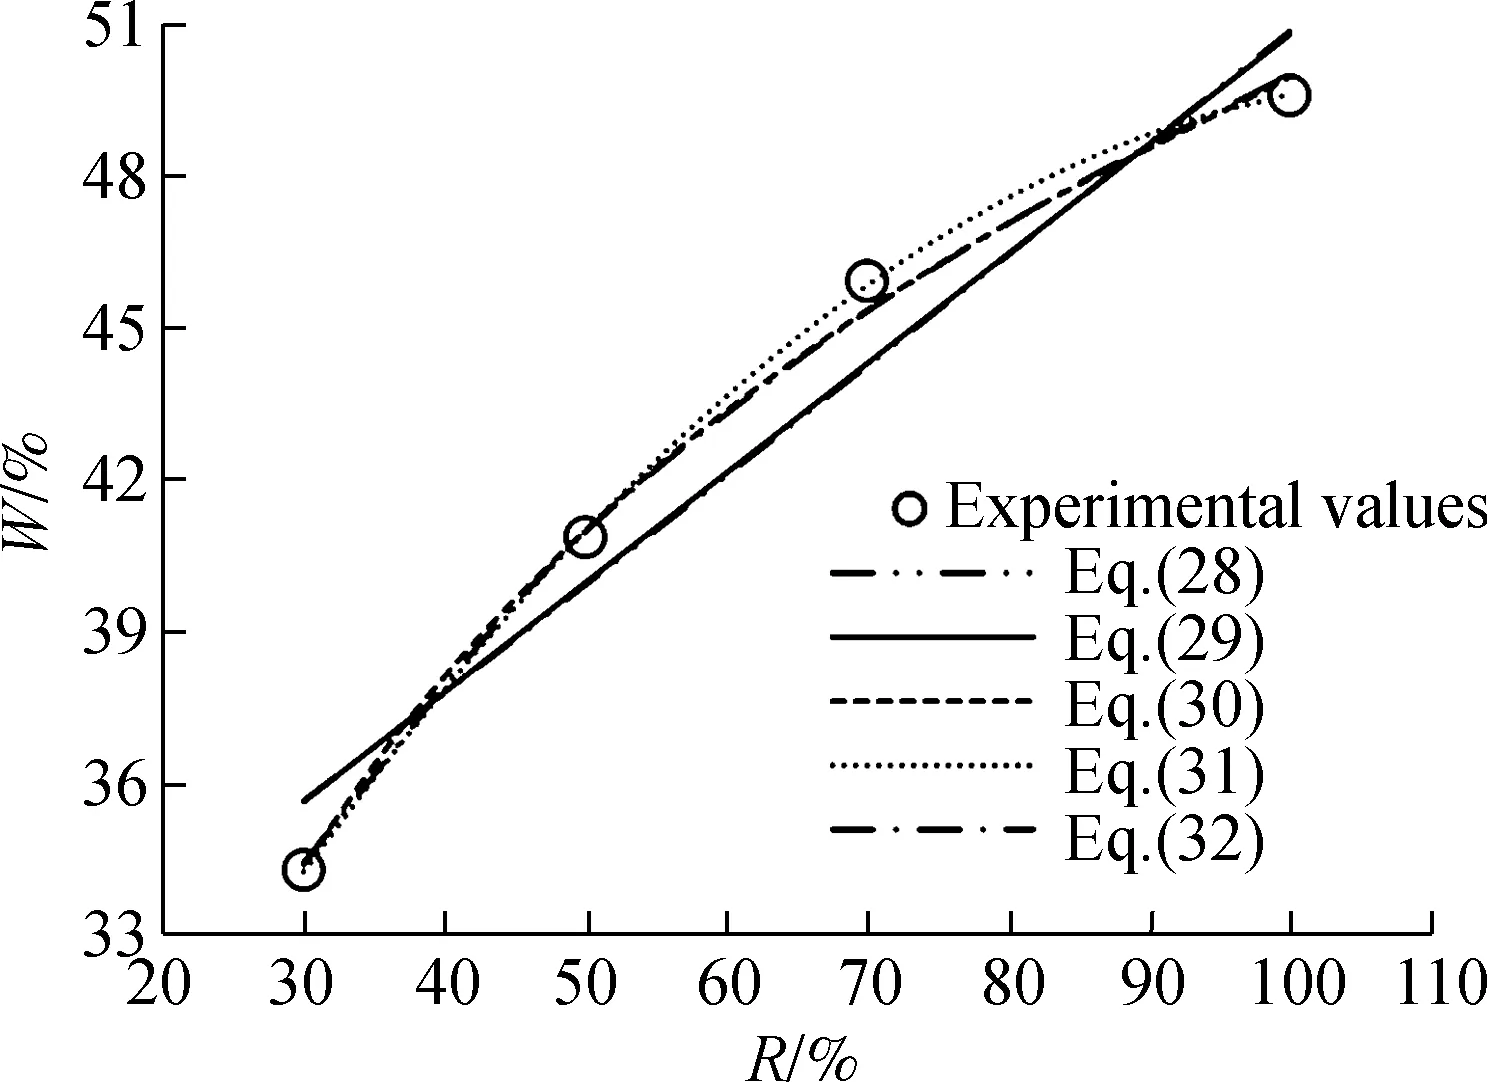
Fig.3 plots the experimental values of the water retention rate of mortars at different replacement rates. After calculation, the equations of the exponential function, linear function, logarithmic function, polynomial function and power function for the water retention rate of RAM+TP at different replacement rates are as follows:
W=84.713e0.000 6R
(23)
W=0.053 1R+84.66
(24)
(a)
(b)
(25)
W=-0.000 2R2+0.085 5R+83.763
(26)
W=76.275R0.035 3
(27)
Additionally, the equations of the exponential function, linear function, logarithmic function, polynomial function and power for the water retention rate of RAM+SSCT at different replacement rates are as follows:
W=89.809e0.000 8R
(28)
W=0.071 7R+89.729
(29)
W=4.279 9ln(R)+76.91
(30)
W=-0.000 8R2+0.173 2R+86.92
(31)
W=78.346R0.045 6
(32)
Furthermore, the curves of these equations are shown in Fig.3, while the regression coefficient and errors for these equations are listed in Tab.4. It can be seen that the polynomial functions, Eqs.(26) and (31), have the greatest regression coefficient and least errors. Hence, they are suggested as the models for the water retention rate of RAM+TP and RAM+SSCT at different replacement rates, respectively.
Tab.4Regression coefficient and errors of models for water retention rate of mortars at different replacement rates

Equation Eq.(23)Eq.(24)Eq.(25)Eq.(26)Eq.(27)Eq.(28)Eq.(29)Eq.(30)Eq.(31)Eq.(32)Regression coefficient r20.985 50.987 10.992 40.996 80.993 50.946 00.949 20.996 20.999 80.995 7Errorsδ/%± 0.17± 0.17± 0.12± 0.24± 0.11± 0.47± 0.45± 0.10± 0.13± 0.11er /%0.220.210.160.360.150.620.530.140.190.15
2.4 Drying shrinkage and curing time
Mi et al.[11]suggested that the curves of drying shrinkage-curing time for RAM+TP should be divided into the sharp shrinkage sections (2 to 7 d), slow shrinkage sections (7 to 21 d) and steady shrinkage sections (21 to 90 d). Also, they suggested that the following polynomial function should be used as the mathematical models for sharp shrinkage sections:
εat=AT2+BT+C
(33)
and the following exponential functions should be used as the mathematical models for slow shrinkage sections and steady shrinkage sections:
εat=AlnT+B
(34)
The experimental values of the drying shrinkage of RAM+SSCT at different curing times are shown in Fig.4. Meanwhile, after Eq.(33) was used to analyze the sharp shrinkage sections and Eq.(34) was used to analyze the slow shrinkage sections and steady shrinkage sections, the equational curves of the shrinkage-curing time of RAM+SSCT at different replacement rates are depicted in Fig.4. Furthermore, the parameters, regression coefficient and errors of these equations are summarized in Tabs.5 and 6.
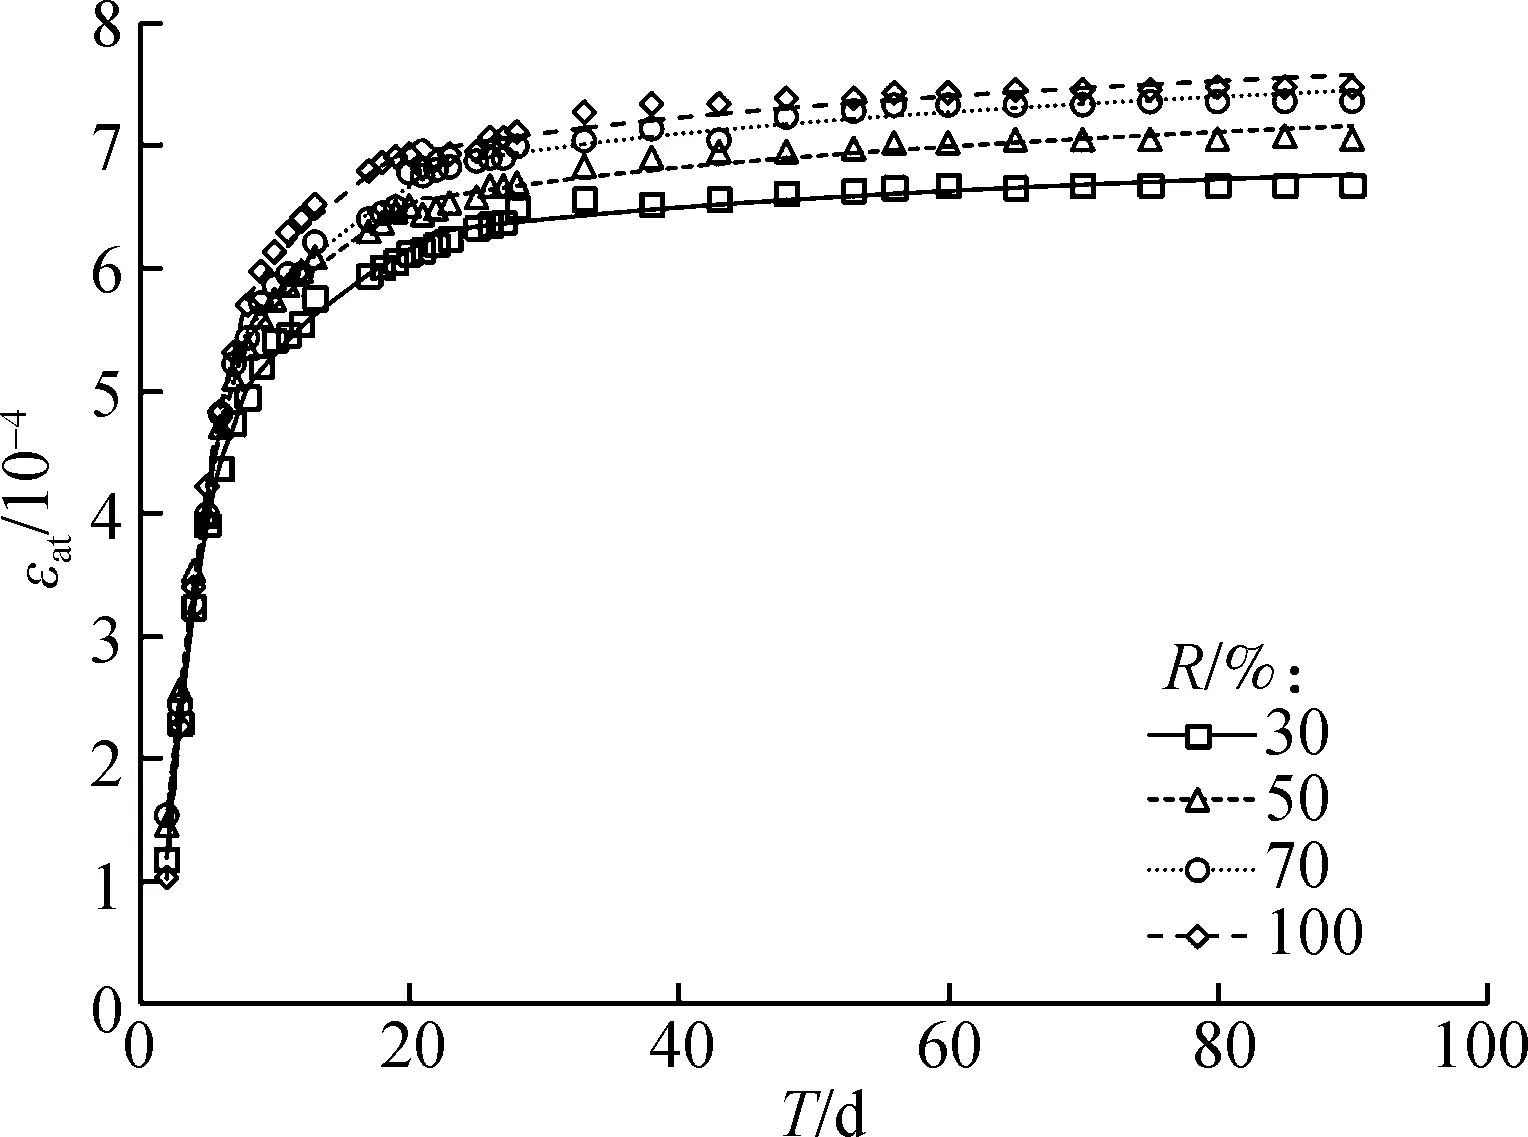
Fig.4 Experimental values and equational curves of drying shrinkage-curing time at different replacement rates

R/%ParametersRegression coefficientErrorsA1/10-6B1/10-4C/10-4r2δ/%er/%30-10.061.611 0-1.635 10.999 6± 0.570.7450 -8.121.447 2-1.080 90.995 8± 1.922.5370 -4.421.148 0-0.604 80.998 1± 1.171.47100-10.451.796 7-2.159 10.999 7± 0.740.99
Tab.6The parameters, regression coefficient and errors of models for RAM+SSCT during 7 to 90 d

T/dR/%ParametersRegression coefficientErrorsA2/10-6B2/10-4r2δ/%er/%7 to 21301232.460.975 8± 0.891.19501202.910.969 8± 0.881.11701292.790.972 6± 1.191.311001342.960.941 8± 1.151.5121 to 903033.35.2610.850 4± 0.791.005041.95.2700.906 4± 0.851.017043.65.4820.943 8± 0.610.7210043.25.6280.889 8± 0.951.22
3 Conclusions
1) Polynomial functions are suggested as the mathematical models for the compressive strength of the recycled aggregate mortars (RAM) with thickening powders (TP) and powdery admixtures (SSCT), and replacement rates of the recycled fine aggregates from demolished concretes, respectively.
2) Polynomial functions are the most optimal mathematical models for the water retention rate and consistency loss of RAM+TP and RAM+SSCT at different replacement rates, separately.
3) Polynomial functions are suggested to be the mathematical models for the sharp shrinkage sections in the curves of drying shrinkage-curing time for RAM+SSCT, while the exponential functions are recommended to be the models for the slow shrinkage sections and steady shrinkage sections.
杂志排行
Journal of Southeast University(English Edition)的其它文章
- Damage evolution analysis of cast steel GS-20Mn5V based on modified GTN model
- Analogy-based software effort estimation using multi-objective feature selection
- A recognition model of survival situations for survivable systems
- A weighted selection combining schemefor cooperative spectrum prediction in cognitive radio networks
- Syntheses and calculation of (E)-4-chloro-4’-ethoxystilbene and (E)-4,4’-dichlorostilbene
- Experimental study of the onset of nucleate boiling in vertical helically-coiled tubes
