Implications of step-chilling on meat color investigated using proteome analysis of the sarcoplasmic protein fraction of beef longissimus lumborum muscle
2018-08-06ZHANGYiminZHANGXiuzeWANGTiantianDavidHopkinsMAOYanweiLIANGRongrongYANGGuangfuLUOXinZHULixian
ZHANG Yi-min, ZHANG Xiu-ze, WANG Tian-tian, David L. Hopkins, , MAO Yan-wei, LIANG Rongrong, YANG Guang-fu, LUO Xin, ZHU Li-xian
1 College offood Science and Engineering, Shandong Agriculturaluniversity, Tai’an 271018, P.R.China
2 NSW Department of Primary Industries, Centre for Red Meat and Sheep Development, Cowra 2794, Australia
3 Shandong Hongan (Group) Co., Ltd., Yangxin 251800, P.R.China
Abstract In order to improve beef color and color stability, step-chilling (SC) was applied on excised bovine longissimus lumborum muscle, with chilling starting at 0-4°C for 5 h, then holding the temperature at 12-18°C for 6 h, followed by 0-4°C again until 24 h post-mortem. pH and temperature were measured during rigor on SC loins as wellas those subjected to routine chilling (RC, 0-4°C, till 24 h post-mortem). Color L*, a*, b* values, metmyoglobin (MetMb) content, MetMb reducing ability(MRA) and NADH content were determined on samples aged for 1, 7, and 14 d. Sarcoplasmic proteome analysis was only conducted on d 1 samples. The results showed muscles subjected to SC maintained a temperature at around 15°C for 5 to 10 h post-mortem, and exhibited a slow temperature decline, but rapid pH decline. Beef steaks treated with SC had higher L*, a*, b* and chroma values than those of RC samples at 1 and 7 d chilled storage (0-4°C), while showing no significant difference for a*, b* and chroma values at d 14. The SC samples also exhibited a lower relative content of surface MetMb,higher MRA and NADH content, compared with RC beef steaks during storage, indicating the SC-treated beef showed an improved color stability. Eleven differential protein spots/nine proteins were identified by two-dimensional gel electrophoresis and mass spectrometry, and those proteins were mainly involved in redox, chaperone binding, metabolic and peroxidase activity. Oxidoreductases play a role in decreasing the oxidation-induced myoglobin oxidation and benefiting the production of NADH, andfinally improving the colour of beef. Of these, pyruvate dehydrogenase E1 component subunit beta showed a positive correlation with color L*, a*, b* values and accounted for more than 60% of the variation in color values; this protein can be considered as a potential beef color biomarker. The present study provided valuable information for studies on the molecular mechanism of color improvement from step-chilling, as wellas for identifying markers associated with beef color.
Keywords: step-chilling, beef color, proteomics, oxidoreductase
1. Introduction
Meat color is a very important meat quality trait, as it in fluences the first impression and the following purchasing decision of consumers when buying meat (Cornforth 1994).Meat color is mainly determined by the content and the status of myoglobin, and it is affected by lots offactors,including intrinsic factors such as animal species/breed, age,musclefibre types, glycogen storage; extrinsic factors such as dietary regime, animal management, packaging methods,aging time, storage temperature, meat processing additives(Mancini and Hunt 2005; Suman et al. 2014). Among these factors, muscle chilling rate/pH-temperature decline is seldom mentioned, as controlling the rigor process has been mainly aimed at improving beef tenderness. For example,the Meat Standards Australia (MSA) beef grading system established an ideal pH/temperature window to improve beef tenderness, so that the temperature should be between 12 and 35°C when the pH drops to 6.0 (Thompson 2002).
Having said this, several previous studies did report an improved beef color concurrently with better tenderness via controlling pH/temperature decline during rigor. Li K et al.(2012) tested several different pre-rigor temperatures to improve beef quality, and found beef samples held at 14°C within 10 h of animal death, exhibited the highest a* and b*values during the early aging time. Liu et al. (2015) also found that beef steaks from carcasses subjected to stepchilling (SC) ((-11±1)°C, for 2 h; then held at a carcass temperature of 12-18°C till 10 h post-mortem, and followed by (1±1)°C to 48 h post-mortem), showed higher a* and b*values, compared with steaks subjected to a routine chilling procedure. So it appears that there may be some benefits for colour by applying step-chilling, but this remains to be elucidated.
With rapid development of “omics” techniques, proteomics has been applied in meat color research successfully, to discover differential expression of proteins among different animal species or muscle types, or color biomarkers during different storage times. The color-related differential proteins are mainly grouped into metabolic enzymes,oxidoreductases, peroxidase and chaperone proteins. Of these, Yu et al. (2017) found four oxidoreductases and two metabolic enzymes that were positively correlated with beef a* values. Canto et al. (2015) found three glycolytic enzymes that were over-abundant in color stable beef and significantly positively correlated to color stability and a*values (redness). Nair et al. (2016) found a differentialabundance of glycolytic enzymes related to intramuscular color stability variations in beef semimembranosus, where the outside (OSM) and inside (ISM) of semimembranosus muscle displayed different chilling rates during rigor. We hypothesize that the sarcoplasmic proteome profiles of beef muscles subjected to step-chilling (starting at 0-4°C for 5 h,then holding the temperature at 12-18°C till 11 h postmortem, followed by 0-4°C again until 24 h post-mortem)and routine chilling will be different, and impact via the variation in pH decline on color stability.
Thus, the objective of current study was to explore the possible underlying mechanisms of improved color which resulted from the step-chilling procedure by using proteomics analysis combined with meat color biochemistry analysis.
2. Materials and methods
2.1. Sample collection
Six carcasses of Chinese yellow cattle (Luxi×Simmental,22 months old) were randomly selected on the slaughtering line.The M. longissimus lumborum (LL, the part of striploin) from both sides were removed immediately, commercially vacuum packaged and then transferred (0-4°C) to the lab immediately.The left loins of each carcass were subjected to step-chilling(stored in an incubator with the temperature at 0-4°C till 5 h post-mortem, and then transferred to another incubator at 14°C, holding for 6 h, followed by 0-4°C chilling again to 24 h post-mortem). The right side LL loins were chilled by a routine procedure (kept in 0-4°C till 24 h post-mortem).
Six beef steaks (2.54 cm thick) were cut from each loin at 24 h post-mortem, vacuum packaged and then stored at 4°C. Two steaks (as replicates) were selected randomly to determine color values, metmyoglobin (MetMb) content,NADH at each of three ageing periods, 1, 7 and 14 d.Samples for protemics analysis (2 g) were removed from d 1 samples (n=3) without replication, frozen in liquid nitrogen immediately and stored at -80°C.
2.2. Temperature and pH
Temperature and pH were measured at 1, 5, 8, 10 and 24 h after slaughter using a digital thermometer (DM6801A,Shenzhen Victor Hi-Tech Co., Ltd., China) and a portable pH probe with temperature compensation (Senven2Go-S2,Mettler-Toledo, Switzerland) which was calibrated in buffers with pH 4.0 and 7.0 before use. The probes were inserted into the geometrical center (about 3 cm) of the LL muscles.Measurements were taken three times for each loin and averaged.
2.3. Color
The meat color L*, a* and b* values, and re fl ectance on the surface of each beef steak were determined by an X-Rite spectrophotometer-SP62 (Grand Rapids, USA, 8 mm diameter aperture, Illuminant A, 10° observer), after blooming for 30 min at 4°C. The color meter was calibrated by a black and a white plate before use. Each steak was read 3 times, and the re fl ectance values were recorded in the range of 400 to 700 nm at 10-nm intervals. The Kubelka-Munk K/S ratio of MetMb was transformed to [2-(K/S572)/(K/S525)] according Li X et al. (2012).
2.4. MetMb reducing activity
MetMb reducing activity (MRA) was determined based on the procedure of Sammel et al. (2002) with some modifications as described by Liu et al. (2014). The Kubelka-Munk K/S ratios and the content of MetMb were estimated sequentially,according to the equation of AMSA (2012). The MRA was then calculated following the equation: [(Initial %MetMb-Final %MetMb)/Initial %MetMb]×100.
2.5. NADH concentration
The NADH extraction followed the protocol described by Klingenberg (1974). The NADH concentration was determined based on the spectrophotometric recycling method of McCormick and Lemuel (1971). In this study, the absorbance at 600 nm was recorded (T6; Purkinje General Instrument Co., Ltd., Beijing) and the NADH concentration(nmol g-1) was obtained based on the standard curve by using known amounts of NADH.
2.6. Proteomics analysis
Sarcoplasmic proteome extraction Beef samples were homogenized in the extraction buffer (pH 8.0) with 40 mmol L-1Tris (pH 7.0) and 2 mmol L-1EDTA, and 120 μL 2 mmol L-1dithiothreitol (DTT) at the ratio of 1:5 (w/v) at 4°C. The homogenate was then centrifuged (10 000×g) for 15 min at 4°C. And the supernatant (sarcoplasmic extract) was collected and then stored at -80°C.
Two dimensional gel electrophoresis The protein concentration was determined by the BCA Protein Assay Kit(Sangon Biotech, Shanghai, China). Sarcoplamic proteins(800 mg) were mixed with rehydration buffer, containing 7 mol L-1urea, 2 mol L-1thiourea, 4% CHAPS, 1% DTT,0.5% IPG buffer and 0.05% bromophenol blue. After loading the protein samples onto immobilized pH gradient strips(IPG, 24 cm, pH 3-10), gels were subjected to passive rehydration for 24 h. The isoelectric focusing (IEF) was performed on IPGphor®(GE Healthcare, USA) by applying a linear increase in voltage initially and afinal rapid voltage ramping to attain a totalof 80 kV. Then the IPG strips were equilibratedfirst with buffer I (1.5 mol L-1Tris-HCl, pH 8.8,6 mol L-1urea, 2% SDS, 30% glycerol, 1% (w/v) DTT) followed by buffer II (1.5 mol L-1Tris-HCl, pH 8.8, 6 mol L-1urea, 2%SDS, 30% glycerol, 4.5% (w/v) iodoacetamide), each for 15 min. The proteins were separated in the second dimension on 12% SDS-PAGE (acrylamide:bis-acrylamide=37.5:1)using a Ettan DALT System (GE Healthcare, USA). The gels were stained with colloidal Coomassie blue for 48 h and destained until sufficient background clearance was obtained.
Image analysis PDQuest software was adopted to analyze the gel images (Bio-Rad, USA). Each gelof SC samples on d 1 was compared with the relevant gel in the RC group.Proteins were considered differentially abundant between SC and RC treatments, if the spot density ratio was greater than 1.5, and the P-value was below 0.05.
Protein identification The protein identification was based on the procedure described by Wu et al. (2015) with minor modification. The protein spots of interest, based on image analysis, were carefully excised from the gels using pipette tips, and washed by using 25 mmol L-1NH4HCO3/50%CH3CN. The gel pieces were dried in vacuum centrifuge and then swollen in the following buffer for 40 min at 4°C (25 mmol L-1NH4HCO3, 10 ng μL-1trypsin). After discarding the extra buffer and replenishing the 25 mmol L-1NH4HCO3solution,the gel pieces were incubated at 37°C for 16 h. Then the peptides were extracted and proteins were identified using a 4800 Plus MALDI-TOF-TOF Mass Spectrometer (AB SCIEX,USA). The mass and mass/mass spectra were combined to search using Mascot and matched in the National Center for Biotechnology Information database.
2.7. Statisticalanalysis
Temperature and pH values measured over the 24 h postmortem period were analyzed by one-way ANOVA, and the differences among means were detected by the Duncan’s multiple range test at P<0.05. Meat color attributes were analyzed by the MIXED procedure (SAS, ver. 9.0), with storage time, chilling method and their interactionfitted asfixed effects, while animal (carcass) was included as a random effect. The PDIFF statement was applied to test the differences between predicted means, and significant differences were set at P<0.05. Proteins with a minimum fold change of 1.5 were detected (P<0.05) by comparing the averaged spots intensities of the samples between step-chilling and routine chilling at d 1 of storage. The relationship between color traits and each protein marker were evaluated in Genstat (19th edition, VSN International Ltd., https://www.vsni.co.uk) using general linear regression analyses which accounted for the effect of treatment. Levelof significance was set to P<0.05. Principal component analysis was applied to L*, a* and MetMb data against the main proteins identified by regression.
3. Results and discussion
3.1. pH/Temperature
It was shown that step-chilling (SC) resulted in a lower temperature decline and faster pH drop, compared with routine chilling (RC; Table 1). The temperature dropped from the initial temperature at around 39 to 16°C at 5 h,then muscles subjected to SC maintained the temperature of 14.6°C at 10 h post-mortem, while RC muscles showed a temperature below 12°C even at 8 h post-mortem. The pH of SC muscles was significantly (P<0.05) lower than those subjected to RC at 8 h post-mortem as wellas at 10 h postmortem, but there was no effect on the ultimate pH (P>0.05).
The pH/temperature rate of decline during chilling has been reported to impact on meat quality (Hwang and Thompson 2001), with the ideal pH/temperature window established by MSA being described as when pH drops to 6.0 the temperature should be between 12-35°C (Thompson 2002). As such in the current study, the SC muscles hit the ideal “window”, whereas the pH of the RC muscles was around 6.0 at 8 h post-mortem, with a temperature lower than 12°C, thus “missing” the window.
3.2. Color and color-related traits
Beef steaks subjected to SC exhibited higher color values and greater color stabililty. The initial lightness (L* values),redness (a* values), yellowness (b* values), and chroma of SC beef was higher than for RC samples, and these differences persisted during ageing, except for a*, b* values and chroma at 14 d (Table 2). L* values slightly increased at d 7 for steaks treated with both chilling methods, as wellas a*, b* and chroma values, but most of the color values decreased at d 14, to lower levels than the initial values.The color differences between the two chilling procedures can be explained by the lower relative content of surface MetMb, higher MRA and NADH content in SC-treated beef steaks (Table 2), which resulted in the higher color stability of SC steaks. Additionally, the MetMb accumulation and NADH content decreased as storage time extended for steaks treated by both chilling procedures; MRA of RC steaks increased on d 7 and reduced on d 14.
An improved beef color was found in previous studies,by setting the rigor temperature to 14°C (Li K et al. 2012),or 12-18°C (Liu et al. 2015), which showed relatively rapid pH declines. Mungure et al. (2016) reported beef L* and a*values increased as rigor temperature increased from 5 to 25°C. Sikes et al. (2017) also discovered a slower pH fall in hot-boned beef loin treated with very fast chilling resulted in lower L*, a* and b* values. Further it has been reported that the color of thawed meat was better when chilled at a higher temperature and showed a rapid pH decline during rigor (Farouk and Lovatt 2000), compared with a routine chilling procedure, and the authors assumed the improved color was related to the increased activity of MetMb-reducingenzyme due to the higher rigor temperature, which is consistent with the current study. However, the hypothesis that the increased activity of the reducing enzymes early post-mortem would deplete the reducing capacity of the meat during storage resulting in higher accumulation of MetMb and decreased colour stability (Ledward 1985), was not found in this study. This is because the MRA of SC-treated meat was still higher (P<0.05) and the percentage of surface MetMb was lower than RC steaks on 14 d; maybe the differences would disappear with extended storage time.
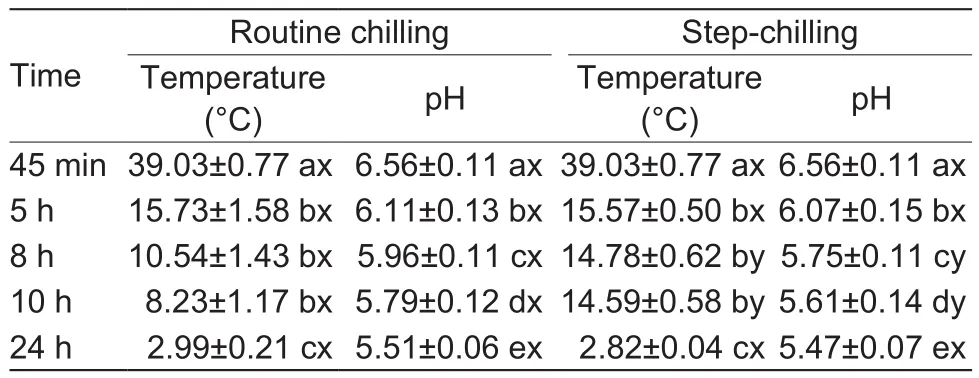
Table 1 Effect of step-chilling on the temperature and pH declines of M. longissimus lumborum within 24 h post-mortem
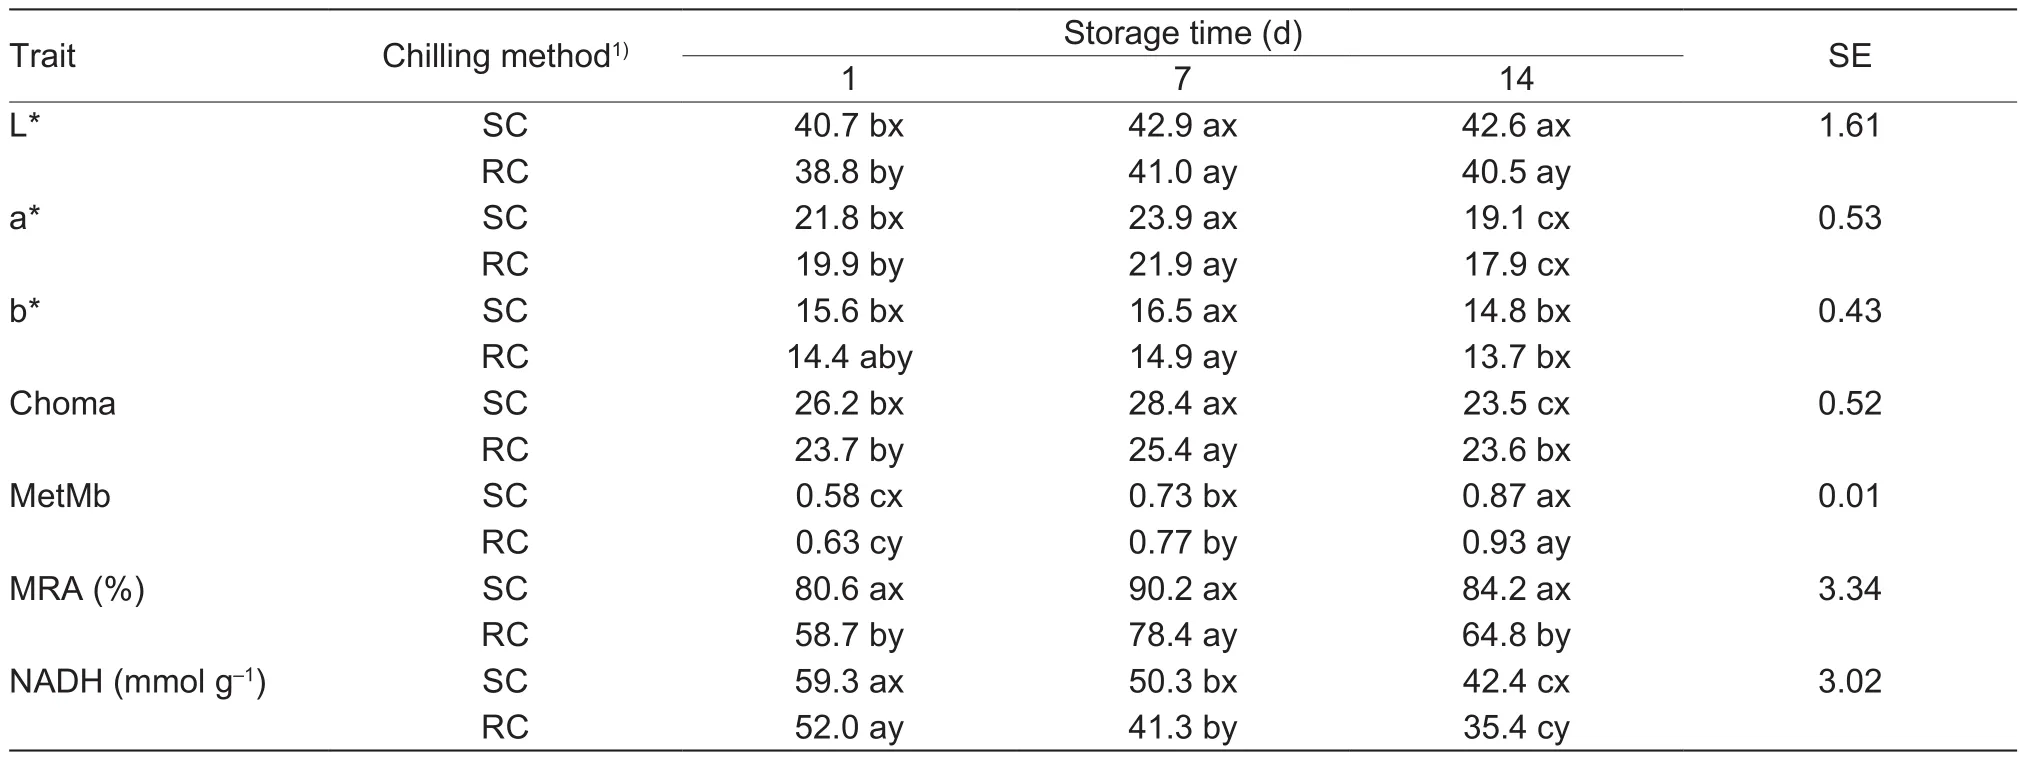
Table 2 Effect of chilling methods on the color and color-related traits of beef steaks from M. longissimus lumborum muscle during aging for 14 d
3.3. Proteomics and relationships with color
Eleven protein spots were identified to be differentially abundant between SC- and RC-treated beef steaks (Fig. 1),of which both spots 0719 and 1640 were identified as alphaaminoadipic semialdehyde dehydrogenase (ALDH7A1),while spots 2116 and 3108 were identified as heat shock protein, alpha-crystallin-related, B6 (HSPB6); therefore, nine proteins were identified to be differentially abundant between the two chilling methods. Of these, ribonuclease/angiogenin inhibitor 1 (RNH1), ALDH7A1, acireductone dioxygenase 1(ADI1), pyruvate dehydrogenase E1 component subunit beta (PDHB), and HSPB6 were over-abundant in SC-treated samples, whereas FK506 binding protein 4 (FKBP4),adenosine kinase (ADK), adenylate kinase 1 (AK1) and peroxiredoxin 1 (PRDX1) were over-abundant in RC steaks(Table 3).
Regression analysis results showed the percentage variance in colour traits which each identified protein marker accounted for when the analysis was conducted on an individual basis. Proteins PDHB, FKBP4 and PRDX 1 were the top three proteins accounting for the variance (Table 4).The PCA results of the score plots showed that 99.76% of the variability of L*, a* or MetMb was explained by the first principal components, composed of PDHB, FKBP4 and PRDX1, which can distinguish the SC and RC samples.
ALDH7A1 belongs to the aldehyde dehydrogenase family. It is an important cellular osmolyte and methyl donor,mediating important protective effects with multifunction,i.e., it protects cells from oxidative stress mainly by metabolizing a number of lipid peroxidation-derived aldehydes. This enzyme is also involved in the subpathway that synthesizes betaine from betaine aldehyde, which results in an accumulation of NADH. ALDH7A1 was also detected by Sayd et al. (2006), and was named as antiquitin,being highly expressed in pig semimembranosus muscles showing light color. ADI1, belongs to the acireductonedioxygenase family, catalyzes the formation offormate and 2-keto-4-methylthiobutyrate (KMTB) from 1,2-dihydroxy-3-keto-5-methylthiopentene and O2, indicating its function in oxidoreduction. PDHB, the pyruvate dehydrogenase complex catalyzes the overall conversion of pyruvate to acetyl-CoA and CO2, and thereby links the glycolytic pathway to the tricarboxylic cycle pyruvate dehydrogenase (NAD+)activity, which promotes the production of NADH; it was found positively correlated (P<0.05) with L*, a*, b* values and negatively correlated with MetMb content in our study.Similar with our results, previous studies also found some oxidoreductases were over abundant in beef samples during early storage, and reported that they are positively correlated with a* values (Yu et al. 2017). The over expression of these oxidoreductive enzymes plays a role in minimizing lipid oxidation-induced myoglobin oxidation, leading to an improved beef color and color stability; or benefiting the production of NADH, which further promotes the conversion of MetMb to Mb.
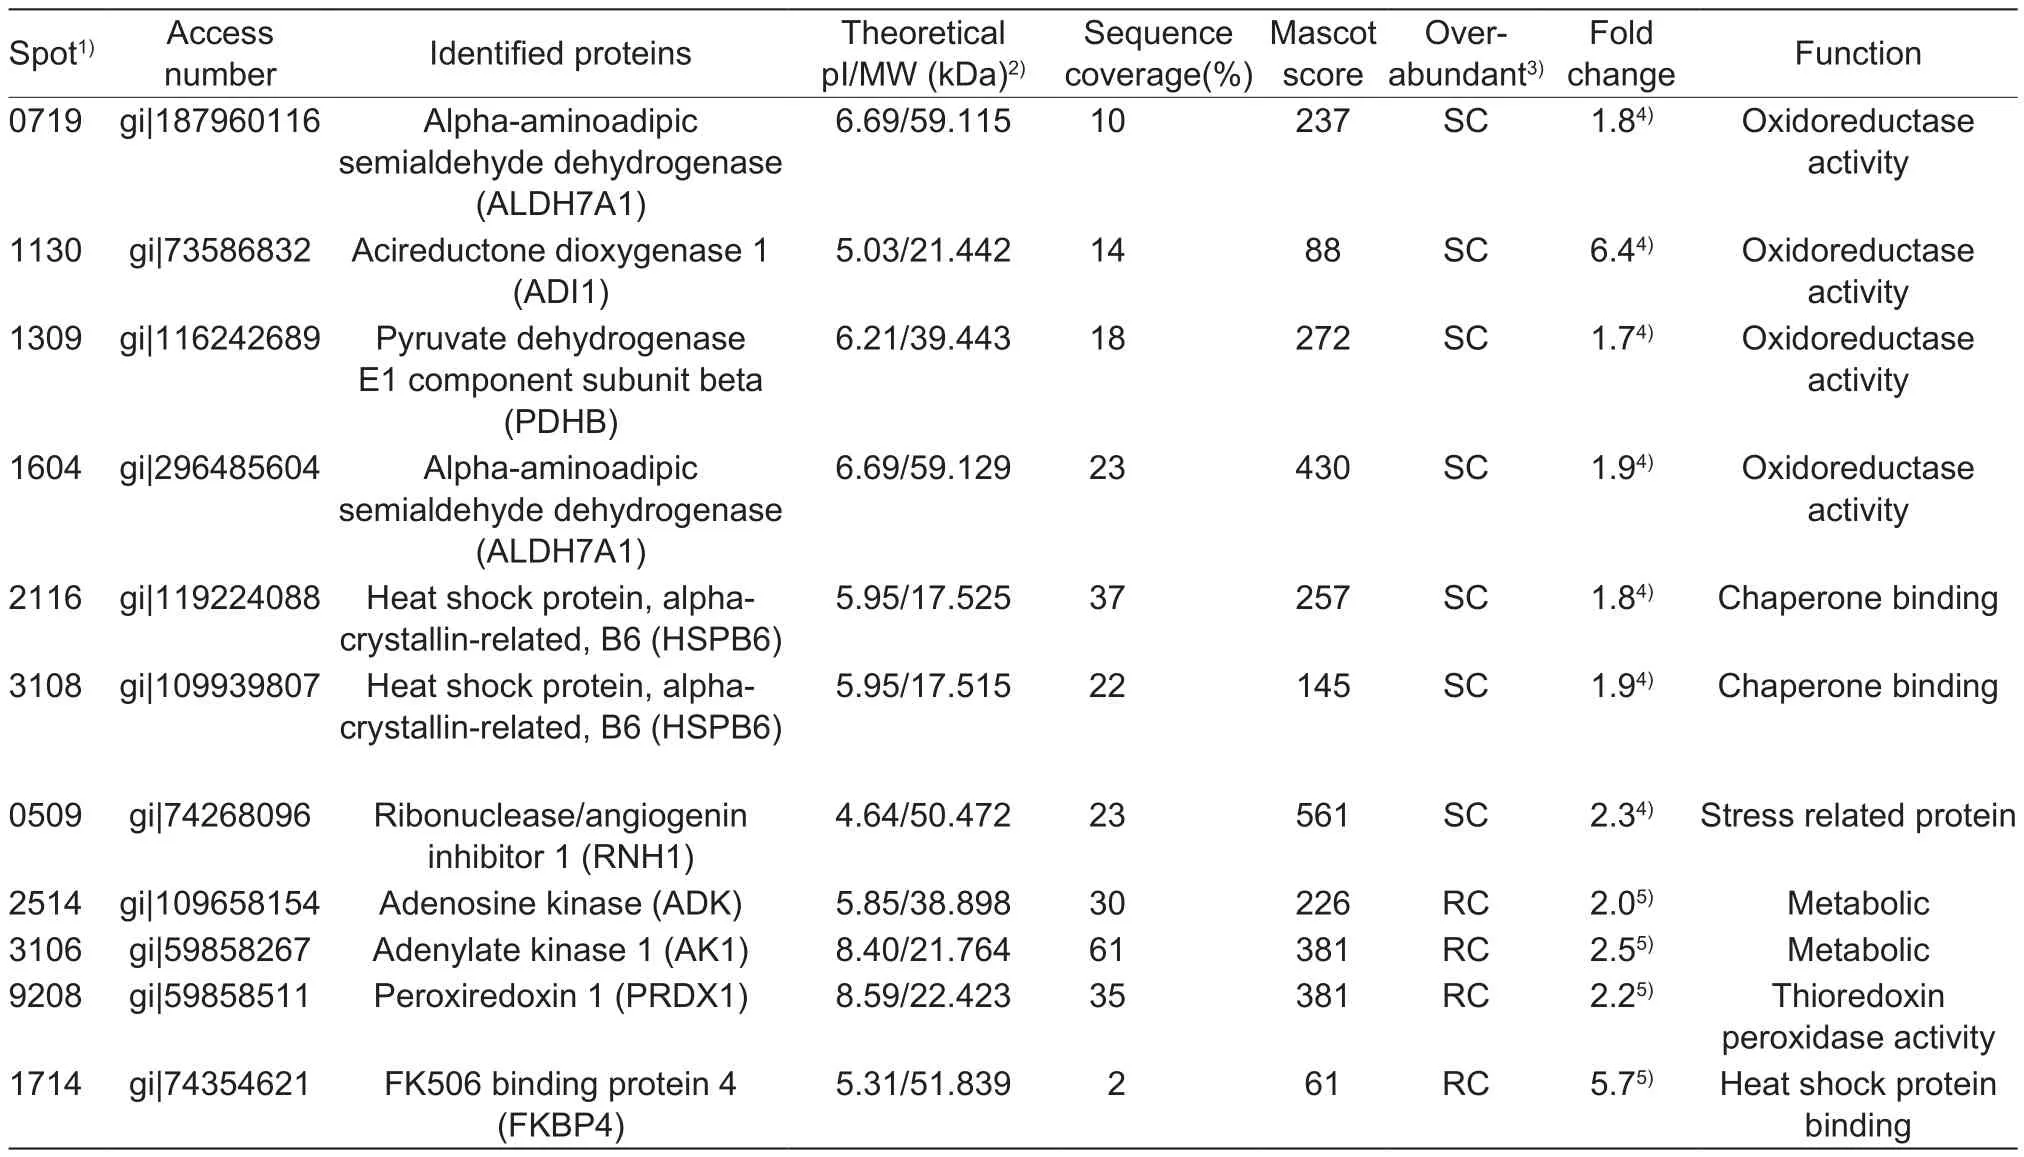
Table 3 Differentially abundant sarcoplasmic proteins in beef longissimus lumborum steaks applied by step or control chilling
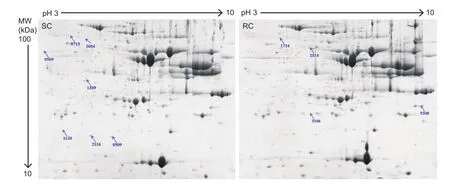
Fig. 1 Two-dimensional gel images of the sarcoplasmic proteome extracted from beef M. longissimus lumborum muscle treated with step-chilling (SC) or routine chilling (RC). Seven protein spots abundant in SC and four in RC, are numbered. MW, molecular weight. The identified proteins were listed in Table 3.
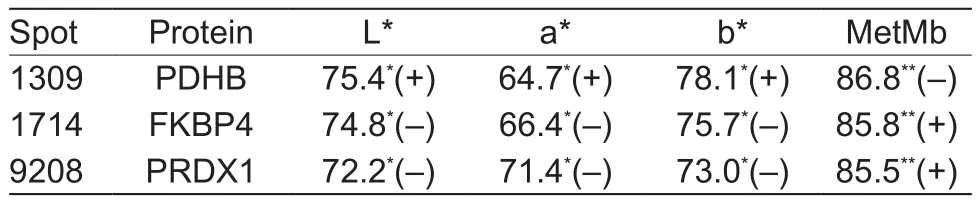
Table 4 The variance (%) of color L*, a*, b* values and MetMb as explained by each protein marker and treatment
HSPB6 belongs to the family of small heat shock protein(HSP20), sharing significant sequence similarity within the“alpha-crystallin domain”, but exhibiting different patterns offunction. It seems to have versatile functions in various biological processes, such as to mitigate protein misfolding and denaturation triggered by noxious environmental stimuli such as decreased pH (Taylor and Benjamin 2005). In the current study, HSPB6 was probably triggered by the fast pH decline resulting from step-chilling, which is supported by previous studies, showing its response to metabolic activity and pH decline, to stabilize myofibrillar proteins (Golenhofen et al. 2000; Gagaoua et al. 2015). It was also reported that another small HSP of the same family, αB-crystallin, was discovered to bind to the myofibril, induced by a slight pH decrease in postmortem muscle (Lomiwes et al. 2014). The direct relationship between HSPB6 and meat color is not clear yet, its function to maintain denatured proteins in a folding-competent state, may facilitate color development.
RNH is a family member of proteinaceous cytoplasmic proteins, and this inhibitor may have a role in the regulation of angiogenin. When cells are stressed, RNH1 is associated with angiogenin to inhibit enzymatic activity so no unnecessary rRNA is produced to save anabolic energy(Pizzo et al. 2013). No previous color-related proteomics study was found to detect this protein, and its relationship with meat color study needs further exploration.
Both adenosine kinase (ADK) and adenylate kinase 1(AK1) were over abundant in RC-treated steaks. They are involved in purine metabolism, while AK1 displays broad nucleoside diphosphate kinase activity. AK1 catalyzes the reversible conversion of ATP to ADP, playing an important role in energy homeostasis, and one of its molecular functions is defined as ATP-binding. Consistent with the current study, Canto et al. (2015) found AK1 was abundant in color-labile beef steaks and Mahmood et al. (2018) found it was over-expressed in beef carcasses with a lower pH decline (dark cutting), while the expression of this enzyme was reported to have no correlation with bovine and swine meat color parameters (Kwasiborski et al. 2008; Canto et al. 2015), but was positively related (P<0.05) with a*value and negatively with surface MetMb content of ovine meat (Li et al. 2018). The mechanisms through which AK1 affects color stability are not clear, and in this study no relationship was found between the expression of ADK, AK1 and beef color traits. However, the higher expression of both enzymes in RC-treated steaks could probably re fl ect the lower metabolism rate due to the slower pH decline during rigor, resulting in relatively more energy in the early postrigor period, which further induced higher enzyme activity in ATP conversion at 24 h post-mortem. Further study, such as the comparison energy leveland the activity of other enzymes involved in energy metabolism between SC- and RC-treated beef steaks should be explored. FKBP4 is a chaperon binding protein, which interacts with heat shock factor protein 1 in the HSP90 complex, assisting the proper folding, stabilization and activation of target proteins. It promotes the recruitment of ATP, and was over-abundant in RC samples consistent with the expression of AK 1 and ADK. FKBP4 was found to be related to color values in our study, and could explain 74.8, 66.4 and 75.7% of the variation of L*, a*, b* values, respectively when treatment was in the model (Table 4). However, the direct pathway of how this protein is involved in meat color remains to be discovered in future studies.
PRDX 1 belongs to the peroxiredoxin family and is able to detoxify peroxides, protect cells against oxidation and act as a sensor of hydrogen peroxide-mediated signaling events.Our results showed that this protein accounted for 72.2,71.4, and 73.0% of the variance of L*, a*, b* values when treatment was in the model (Table 4), and was negatively correlated (P<0.05) with these color traits. In previous proteomics studies, researchers found other members of the peroxiredoxin family, such as peroxiredoxin-6 (PRDX 6)exhibited a negative relationship with beef a* values (Wu et al. 2015), while peroxiredoxin-2 was correlated with R630/580 (Joseph et al. 2012). Glutathione peroxidase 1 has also been reported to be negatively related with beef color (a*) (Yu et al. 2017). These peroxiredoxins were all reported to eliminate hydrogen peroxide and served as antioxidants to protect meat against discoloration.A previous study stated that the role of peroxiredoxin eliminating peroxides could inhibit lipid oxidation, and then improve meat color (Joseph et al. 2012). PRDX 1 interacts with PRDX5 and catalase (CAT), involved in the hydrogen peroxide catabolic process, as a response to reactive oxygen species and a response to oxygen-containing compounds. It seems it could benefit the formation of a reduction environment in the meat, however, its function on decreasing the meat color and color stability, especially after SC treatment remains to be clarified.
4. Conclusion
The step-chilling procedure we applied successfully promoted the color improvement of bovine M. longissimus lumborum muscle. This improvement was a result of a lower MetMb content; higher MRA and accumulation of NADH in SC-treated beef, due to the fast pH decline. The proteomics results further explain the reason for the improvement. It is mainly because three oxidoreductases (ADI1, PDHB,ALDH7A1), were over-abundant in SC beef, which can minimize lipid oxidation-induced myoglobin oxidation and benefit the production of NADH, and then facilitate color improvement. Of these PDHB is positively correlated with color values, and is proposed as a potential biomarker for beef color. Severalother proteins were also found related with color traits, such as PRDX1 and FKBP4 and their roles in color development are worthy of exploration in future studies.
Ackonwledgements
This work was supported by the earmarked fund for the China Agriculture Research System (beef) (CARS-37), the Special Fund for Innovation Team of Modern Agricultural Industrial Technology System in Shandong Province, China(SDAIT-09-09) and the Funds of Shandong “Double Tops”Program, China (SYL2017XTTD12).
杂志排行
Journal of Integrative Agriculture的其它文章
- ldentification and characterization of Pichia membranifaciens Hmp-1 isolated from spoilage blackberry wine
- Spatial-temporal evolution of vegetation evapotranspiration in Hebei Province, China
- Design of a spatial sampling scheme considering the spatialautocorrelation of crop acreage included in the sampling units
- Comparison of forage yield, silage fermentative quality, anthocyanin stability, antioxidant activity, and in vitro rumen fermentation of anthocyanin-rich purple corn (Zea mays L.) stover and sticky corn stover
- Synonymous codon usage pattern in model legume Medicago truncatula
- The biotypes and host shifts of cotton-melon aphids Aphis gossypii in northern China