Spatial-temporal evolution of vegetation evapotranspiration in Hebei Province, China
2018-08-06WANGQianfengTANGJiaZENGJingyuQUYanpingZHANGQingSHUlWeiWANGWulinYlLinLENGSong
WANG Qian-feng , TANG Jia ZENG Jing-yu QU Yan-ping, ZHANG Qing, SHUl Wei WANG Wulin Yl Lin, LENG Song
1 Fujian Provincial Key Laboratory of Remote Sensing of Soil Erosion and Disaster Protection/College of Environment and Resources, Fuzhou University, Fuzhou 350116, P.R.China
2 Research Center on Flood and Drought Disaster Reduction, China Institute of Water Resources and Hydropower Research,Beijing 100038, P.R.China
3 Key Laboratory of Digital Earth Science, Institute of Remote Sensing and Digital Earth, Chinese Academy of Science, Beijing 100094, P.R.China
4 Geospatial Information Center, Shenzhen Institutes of Advanced Technology, Chinese Academy of Sciences, Shenzhen 518055,P.R.China
5 Climate Change Cluster, University of Technology Sydney, New South Wales 2007, Australia
Abstract Evapotranspiration (ET) is the sum of soilor water body evaporation and plant transpiration from the earth surface and ocean to the atmosphere, and thus plays a significant role in regulating carbon and water resource cycles. The time-series data set from the remote sensing MOIDS product (MOD16) was used to study the spatial-temporal evolution of vegetation evapotranspiration in salinized areas during 2000-2014 by analyzing the variability, spatial patterns and Mann-Kendall (MK)nonparametric trends for the time series. The results indicate that inter-annualand intra-annual variations of ET across various vegetated areas show seasonal changes, with the abnormal months identified. The cultivated land displays a greater degree of spatial heterogeneity and the spatial pattern of ET in the area covered by broadleaved deciduous forests corresponds to a higher ET rate and increased water consumption. A widespread decline of ET is observed only in cultivated areas. However, agricultural cultivation doesn’t worsen water shortage and soil salinization problems in the region, and water shortage problems are worsening for other vegetated areas. This research provides a basis of reference for the reasonable allocation of water resources and restructuring of vegetation patterns in salinized areas.
Keywords: evapotranspiration, Hebei Province, MODIS, spatial pattern, vegetation, spatial-temporal evolution
1. lntroduction
The biosphere, as the intermediate zone of life on the earth between the lithosphere and the atmosphere,plays a central role in earth’s material cycle and energy exchange, particularly in the regulation of carbon and water cycles (Chong et al. 1993). Evapotranspiration (ET) is an important component of hydrologic and climate changes in the biosphere (Seevers et al. 1994), accounting for the movement of surface or subsurface water through soil evaporation and plant transpiration (Rey 1999) due to internal (biological) and external (physicaland atmospheric)factors (Stoy et al. 2006). These factors contribute to spatial-temporal heterogeneity and the evolution of ET due to combined effects of climate change and ecosystem management (Wear and Greis 2002; Foley et al. 2003).Therefore, in order to response to climate change, analyzing the spatial-temporal evolution of ET in different complex ecosystems is essential to understand and reshape water resource cycles in region scale.
Currently, evapotranspiration (ET) can be measured by several methods. ET at the global scale can be measured by using land-surface parameters, such as net land surface radiation, temperature, vegetation index, and soil moisture(Wang and Liang 2008), and the ET of natural vegetation and crop can be simulated using water balance or crop growth models (Consoli and Vanella 2014; Wang et al. 2017).Satellite remote sensing is widely adopted to estimate ET using vegetation index (VI) alone (Parmar and Gontia 2016;Zhang et al. 2016; Li et al. 2017), and to gether with other land-surface parameters (e.g., vegetation coefficient, crop coefficient) (Ghilain et al. 2014; Lei and Yang 2014; Howes et al. 2015; Liu 2016). Remote sensing-based methods are cost-effective, efficient, and provide up-to-date information,and these methods are used to estimate ET in this research.
Different types of vegetation (forest, grass or cropland)have diverse ET rates and structures of canopy covers(Suzuki et al. 1998). For different categories of vegetation,there may be changes in ET rate in response to the surrounding environment. For example, increasing carbon dioxide in grassland ecosystems can lead to a decrease in ET (Polley et al. 2011). Against the background of climate change, the conversion from forests, shrublands,to grasslands in southern China during 1967 to 1993 resulted in an increase in ET (Sun G et al. 2010). Climate change has an even stronger impact on ET, as climate and vegetation coverage were shown to respectively account for 85.18 and 14.82% of the impact on ET in Yunnan of China(Yang et al. 2015). Consequently, there is an urgent need to explore the spatial-temporal evolution of ET driven by environmental factors in agriculturalareas to allow effective implementation of regional climate change adaptation and vegetation coverage projects at the beginning of the 21st century.
The shortage offresh water resource is one of the major factors adversely affecting the sustainability of the ecological system, and socialand economic development in the study area (Maas et al. 2017; Zhou et al. 2017). Due to exploding population growth and global warming, soil salinization associated with irrigation is worsening (Yeo 1998). According to the statistical research of the Hebei Academy of Agriculture and Forestry, China, the area of saline and alkaline soil in Hebei is 7.8×10³km2, accounting for 10.4% of the cultivated land of the province. The regions with soil salinization are mainly in the low and coastal plains in the eastern part of Hebei as a result offarm irrigation,overgrazing of existing meadows, and the overexploitation of groundwater in superficial zones. In this study, the main land coverage types in Hebei are considered as vegetation,vegetation ET is a main driver of water consumption and salinization.
In this research, we used the time-series data set from the MODIS remote sensing product MOD16 for the heavily salinized agriculturalareas in Hebei to analyze the variation of ET for different types of vegetation for the years 2000-2014. We explored the characteristics of spatial heterogeneity, patterns, and variability of ET using spatial pattern method. The research provides a certain basis of reference for the reasonable allocation of water resources of effective regional climate change strategies.
2. Data source and study area
2.1. Data source
The ET data used in this research were the land surface ET data with spatial resolution of 1 km under the MODIS sensor covering Hebei Province (MOD16), as provided by Numberical Terradynamic Simulation Group of the University of Montana, USA (http://www.ntsg.umt.edu/project/mod16#data-product). The temporal resolution of MOD16 data were categorized at 8-day, monthly and annual intervals, using the Penman-Monteith estimation modelof ET. In addition, we also applied time series of meteorological data including observed ET factor from the China Meteorological Data Network, covering 11 weather stations across the whole study area, we converted the daily ET data into monthly by summing the daily data in each month at each station from 2000 to 2014. The observed ET data were obtained from evaporation pan,we called observed ET as evaporation pan-PET (potential evaporation). The evaporation pan-PET data only include evaporates from water body without transpiration from the plant, thus the pan-PET data can be used as auxiliary data. In order to investigate the accuracy of MOD16, we compared the consistency between evaporation pan-PET and MOD16-PET (Fig. 1), we also conducted the scatter plot and the linearfitting between evaporation pan-PET and MOD16-PET, the performance of the linearfitting is better(P<0.001 and slope=1.02). Furtherly, we calculated the correlation coefficient (R) between evaporation pan-PET and MOD16-PET for each station at 11 stations (Table 1), R was high from 0.82 to 0.92 for each station and R was close to 1 for the whole study area, the consistency was better between evaporation pan-PET and MOD16-PET, therefore,the result showed the accuracy.
MOD16 PET were potential evaporation data, the data employed in our study were calculated by including transpiration function from plants in land coverage. The ET product is verified by comparing observed ET in North China Plain, and the accuracy of MOD16 ET data is higher(Sun Z et al. 2010), MOD16 ET product based on remote sensing images can provide the ET data with reasonable accuracy (Kim et al. 2012). Fourteen types of land coverage were included with the corresponding land surface variables offraction of absorbed photosynthetically active radiation (FPAR), leaf area index (LAI), and albedo, or how much sunlight is reflected from the earth at the top of the atmosphere under all-sky condition (both clear and cloudy situations) (Mu et al. 2011). The data provide accurate precision of estimation that serves the requirement of this research (Alemu et al. 2014). To reduce the noise in time and the impact of mixed pixels on the quality of images in space, we used the MOD16 data with monthly temporal resolution and a spatial resolution of 0.05 degrees.

Fig. 1 The scatter plot between evaporation pan-PET and MOD16-PET.
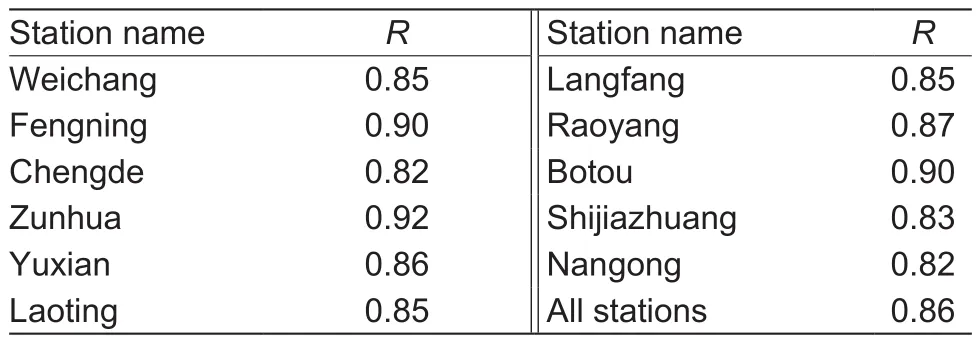
Table 1 Correlation coefficient (R) between evaporation pan-PET and MOD16-PET at 11 stations in Hebei Province, China
Given the significant impact of different types of vegetation coverage on ET, we used the GLC2000 global land cover data set provided by the European Commission’s Joint Research Centre to differentiate the characteristics of spatial-temporal evolution of ET under different vegetation coverages. This dataset was completed collaboratively by more than 30 international research institutions, providing a higher degree of accuracy for interpretation on a global scale (Bartholome et al. 2005). In order to match the spatial resolution of the ET data, the GLC2000 data were resampled as a gridded data set at the same spatial resolution of 0.05 degrees, and was masked by a boundary map of the study area. We extracted four types of vegetation with the largest coverage area in the study area, farmland,broadleaved deciduous forest, meadow and needleleaved evergreen forest, which to gether account for 89.6% of the whole study area (other types of land coverage, representing the remaining 10.4%, are not discussed further here). We used the MODIS data of 2001 and 2014 to analyze the change of vegetation coverage in the study area, and found that there are only 5.3% regions where the types of vegetation coverage changed in our study area. Therefore,there would be only a slight impact of ET caused by the change of vegetation and this was not considered further.
2.2. Study area
Located in the northern part of the North China Plain, Hebei Province, 113.45°-119.83°E and 36.08°-42.67°N, borders Inner Mongolia and Liaoning to the north, and Henan and Shandong to the south, and consists of 11 municipal prefectures a total coverage area of 1.89×10⁵km2. As one of China’s major producers of agricultural crops and vegetables, Hebei has a humid, semi-arid, and temperate continental monsoon climate, cold and dry in winter and spring and hot and rainy in summer, with typicalannual precipitation of averaging between 300-800 mm and notably uneven spatialand temporal distribution. The vegetation coverage in the study area is mainly comprised offarmland,broadleaved deciduous forest, meadow and needleleaved evergreen forest (Fig. 2), and the eleven meteorological stations is distributed in the whole study area (Table 2).
3. Methods
3.1. Time-series variability characteristics method

Fig. 2 Study area of Hebei Province, China and types of vegetation coverage in 2000.

Table 2 Basic information table of 11 meteorological stations in Hebei Province, China
With the time-series variability characteristics method, we can effectively extract the evolution of environmental factors in temporaland identify inter-annualand intra-annual ET variations and abnormalities. In this research, we used the monthly ET data from January 2001 to December 2014 as the data sequence, and the mean value and standard deviations of the monthly grid-based ET rates in statisticalunits as the statistical index. The statisticalunits were divided over the whole study area and the areas with the four types of vegetation coverage. In this way, we studied the time-series variability characteristics of each sub-region.
3.2. Trend analysis approach
Mann-Kendall (MK) trend test is a nonparametric test method (Mann 1945; Kendall 1948). This method does not require a normal distribution of data, and is widely used in the field of meteorology, ecology, and agriculture (Burn et al.2002; Xu et al. 2004; Wang et al. 2015). The null hypothesis H0 is that the data series xk(k=1, 2, 3...n) are independent from one another and have the same distribution, and the alternative hypothesis H1 is that there is a monotonic trend in the data series. The MK trend test is calculated as follows:

Where, xjis the sequential data value, n is the size of the dataset, and sgn is calculated as follows:

According to Mann (1945) and Kendall (1948), when n≥8,the test statistics S is approximately normally distributed with the mean and variance as follows:

Where, tmis the number of extent m. The standardized test statistics Z is calculated using the following formula:

|Zα|=1.65, 1.96, and 2.58, which correspond to the critical values at the significance level P=0.1, 0.05, and 0.01, respectively. If |Z|>|Zα|, the null hypothesis H0 is rejected and values of P=0.05 and 0.01 were considered in our research.
To analyze the trend of the time series variable, we used the robust estimator for the amplitude of trend slopes as proposed by Sen (1968):

Where, slope is the monotonic increase or decrease rate, or the linear slope, of the entire data series xk(k=1,2, 3, ..., n) or any segmentation xw(w=i, i+1, i+2, ..., j). If this value is positive, the series monotonically increase;and if it is negative, the series monotonically decrease.Median denotes the function to take the median value, and conducted a significance test on the result of the Sen’s trend analysis using the MK approach.
3.3. Spatial characteristics method
In this research, the expression of spatialand temporal characteristics is depicted in terms of the spatial pattern and trend of elements in the study area (Wang et al. 2014).For the spatial pattern, the annual mean values of ET during 2000-2014 were computed for each grid to identify the hotspot areas associated with each factor. For the spatial trend, the change of ET trend during 2000-2014 was determined for each grid to identify areas with significant changes. Specifically, spatial pattern and trend are analyzed according tofive types of statisticalunit with the whole study area and four types of vegetation coverage.
In order to quantitatively understand ET responses to environmental factors such as vegetation coverage and precipitation. In order to understand the effects of environmental factors on the ET for 2000-2014, a spatial correlation analysis is conducted. Data on vegetation coverage are calculated based on the NDVI and vegetation types, the detailed calculation process can refer to the previous studies (Mu et al. 2013; Wen et al. 2013).
4. Results and discussion
4.1. Time-series variability characteristics of ET during 2000-2014
Using the ET time-series data, the inter- and intra-annual variations and abnormalities of ET can be effectively identified by the analysis of variability. Fig. 3 shows the monthly mean values and standard deviations of ET during 2000-2014, where the mean values and standard deviations represent water consumption in the region and its dispersion degree, respectively. As illustrated in Fig. 3, ET rates varied seasonally and showed a certain variation in inter-annual ET. ET peaks were above 75 mm in July and August every year, and low ET rates, i.e., below 25 mm, were observed in January, February, March, April, October, November and December due to the lower temperatures. Inter-annual variations indicate that ET rates were above 80 mm in July and August in six years, 2004-2007 and 2012-2013,probably due to higher levels of summer precipitation in those years. The annual maximum value of ET was relatively low during July and August 2009, potentially due to less precipitation during summer.

Fig. 3 Variability of evapotranspiration in the whole study area in Hebei Province, China during 2000-2014. White line between gray area and black area represents monthly mean value. Gray area represents monthly mean value+standard deviation, back area represents monthly mean value-standard deviation.
The characteristics of inter- and intra-annual variations of ET for each type of vegetation coverage area were consistent with the change for the whole study area, the mean values were higher and there was greater variation of ET in July and August every year, mainly due to the uneven distribution of summer precipitation. As illustrated in Fig. 4, Fig. 4-A and C show larger ET variations than Fig. 4-B and D in low-value months, primarily because the fact that broadleaved and needleleaved forests can effectively take up underground water for plant growth, but crops and grass rely on surface water and heat, resulting in higher spatial variability. A comparison of the four different types of vegetation manifests that herbaceous plants and woody plants show consistent spatial variability in summer,although differing in how they take up water.
4.2. Spatial pattern characteristics of ET during 2000-2014

Fig. 4 Variability of evapotranspiration for different types of vegetation during 2000-2014. A, farmland. B, broadleaved deciduous forest. C, meandow. D, needleleaved evergreen forest. White line between gray area and black area represents monthly mean value. Gray area represents monthly mean value+standard deviation; black area represents monthly mean value-standard deviation.
We analyzed the spatial pattern to quantitatively evaluate spatial heterogeneity and variability of ET by equalizing the ET rate of each year from 2000 to 2014 on a grid scale. As shown in Fig. 5-A, four ET levels (lower, low,high, and higher) were regionally aggregated. In particular,the northeastern part of the study area showed a higher levelof ET and the northwestern and southeastern parts showed lower values, indicating a larger amount of water consumption per unit area in the northeast and a lower amount in the northwest and southeast, mainly due to the variation of vegetation coverage in the region. The pattern is similar to the study of Tang et al. (2011).
The spatial pattern of ET for the different types of vegetation was determined and is illustrated in Fig. 5-B-E.Fig. 5-B revealed a higher spatial heterogeneity and a mixture offour levels of ET, mainly due to the change in foliage surface and water consumption associated with crop rotation in the cultivated areas. Fig. 5-C showed that ground coverage mainly comprised of broadleaved deciduous forest has a higher levelof ET, principally because groundwater is the main source of ET in forests. Fig. 5-D showed grasslands have a lower ET level, largely because precipitation is the main source of ET in grasslands with little low ET. Fig. 5-E showed that needleleaved forests have a higher ET level, mainly because groundwater recharge is the primary source of ET for a ground coverage of tall trees, but there is little evidence of the highest ET due to thin foliage. The spatial pattern of ET varies for the different types of vegetation, because leaf transpiration and stomatal conductance at the lower part of the canopy was lower than those at the middle and upper parts of the canopy (Zhang et al. 2016).

Fig. 5 Pattern of evapotranspiration during 2000-2014. A, all the vegetation types. B, farmland. C, broadleaved deciduous forest.D, meandow. E, needlelevaved evergreen forest.
4.3. Spatial trend characteristics of ET during 2000-2014
The analysis of spatial trend characteristics is a key technology to identify regions with abnormal variation based on the grid scale. In Fig. 6-A, the variation trend demonstrates sheet distribution over all the whole study area, mainly associated with the types of vegetation coverage. Spatial heterogeneity is obvious in the study area,with an increase in ET in the north where the dominated trends occur for the whole study area and a generally downward trend in the south, the trend is consistent with previous studies (Chen et al. 2014; Mo et al. 2017). ET conditions have trended significantly in the northeastern(P<0.01) and other parts (P<0.05).
The spatial trends and significances of ET for the different types of vegetation were determined and is illustrated in Fig. 6-B-E. There was a widespread decline in the size of cultivated areas (Fig. 6-B), but there was a general increasing trend for the area offorests (Fig. 6-C and E)and grasslands (Fig. 6-D) which would result in reduced water consumption due to human activities and increased water consumption for natural vegetation, this result is is in line with Yang et al. (2012), decreasing trend with water-consuming crops for farmland can help reduce soil salinization in the region. An increasing trend in ET in the areas covered by forest and grass is likely to increase higher water consumption by growing roots and above-ground biomass.

Fig. 6 Trend of evapotranspiration during 2000-2014. A, all the vegetation types. B, farmland. C, broadleaved deciduous forest.D, meandow. E, needlelevaved evergreen forest.
4.4. Correlations between environmental factors and ET
A spatial correlation analysis measures the in fluences and responses between two spatial elements. In this study, to determine how environmental factors in fluence the ET in Hebei Province, we investigated the correlations of ET with two environmental factors including vegetation coverage and precipitation for 2000-2014.
The correlation coefficient and significant level between vegetation coverage and ET are illustrated in Fig. 7-A, the correlation coefficient is positive in the whole study area,which showed that vegetation coverage is higher and the ET is higher, because the plant canopies with vegetation coverage can lead to plant transpiration. However, only very few areas which sparsely distributed in the farmland show the significant negative correlation (P<0.05), this may be caused by the coarse spatial resolution with mixed pixels and irrigation.
The correlation coefficient and significant level between precipitation and ET are illustrated in Fig. 7-B, the correlation coefficient is positive in the whole study area, which showed that precipitation is higher, the ET is higher, and precipitation is a key factor to impact ET. The absolute values of the correlation coefficient are great than 0.51 (P<0.05) for most of the north areas, it indicates that precipitation in fluences the ET in broadleaved deciduous forest.
5. Conclusion
Vegetation ET is an important component of hydrologic and climatic changes in the biosphere and insights into ET are vital to address issues of water resource shortage. We selected a typical salinized region as the study area in Hebei to explore the spatial-temporal evolution of vegetation ET,the following conclusions can be drawn:
(1) Inter- and intra- annual variations of ET for each type of vegetation are consistent with the variation characteristics in the whole study area, the cultivated areas have a greater degree of spatial heterogeneity. (2) The area covered by broadleaved deciduous forests indicates higher ET levels and generally higher ET rates; and the area covered by grass shows lower ET levels and generally lower ET rates;vegetation coverage and precipitation are key factors in fluencing the ET with positive effects in the whole study area. (3) A widespread decline of ET was found only in cultivated areas, which can help relieve soil salinization in the region and ET displays an uptrend trend in other areas of vegetation.
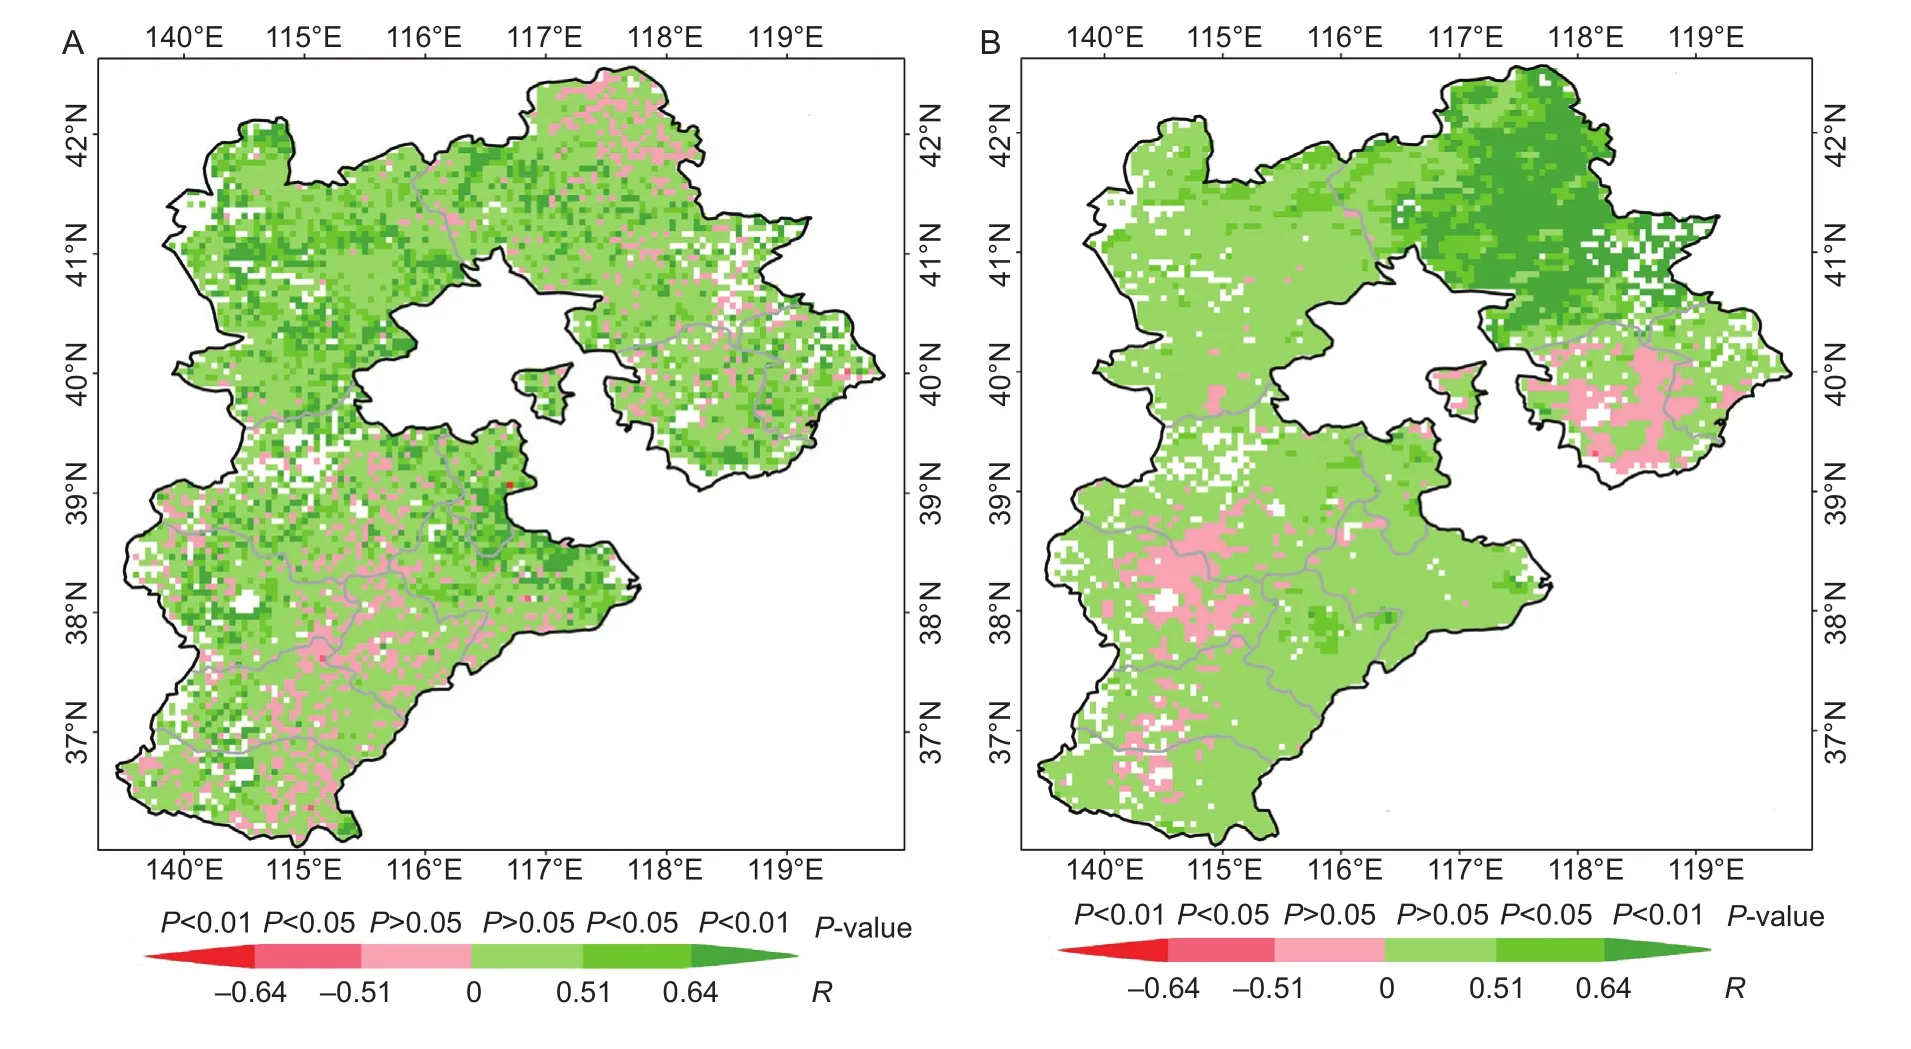
Fig. 7 Spatial correlation coefficient (R) during 2000-2014. A, R between vegetation coverage and evaportranspiration. B, R between precipitation and evaportranspiration.
This study can provide a scientific understanding for the management of water resources management on a regional scale. However, it may be more productive to apply this method to agriculturaland forest sectors to further investigate evolution of vegetation ET into the relevant researchfields, such as agricultural yield and vegetation net primary production.
Acknowledgements
This research receivedfinancial support from the National Key Research and Development Program of China(2017YFC1502404), the National Natural Science Foundation of China (41601562 and 41761014), the China Institute of Water Resources and Hydropower Research Team Construction and Talent Development Project(JZ0145B752017), and the Research Project for Young Teachers offujian Province, China (JAT160085).
杂志排行

Journal of Integrative Agriculture的其它文章
- ldentification and characterization of Pichia membranifaciens Hmp-1 isolated from spoilage blackberry wine
- Implications of step-chilling on meat color investigated using proteome analysis of the sarcoplasmic protein fraction of beef longissimus lumborum muscle
- Design of a spatial sampling scheme considering the spatialautocorrelation of crop acreage included in the sampling units
- Comparison of forage yield, silage fermentative quality, anthocyanin stability, antioxidant activity, and in vitro rumen fermentation of anthocyanin-rich purple corn (Zea mays L.) stover and sticky corn stover
- Synonymous codon usage pattern in model legume Medicago truncatula
- The biotypes and host shifts of cotton-melon aphids Aphis gossypii in northern China