Effects of tide-surge interaction and wave set-up/set-down on surge: case studies of tropical cyclones landing China's Zhe-Min coast
2018-07-27QingyongWuxiJiachunLiBingchuanNie
Qingyong Wuxi, Jiachun Li,*, Bingchuan Nie*
a Key Laboratory for Mechanics in Fluid Solid Coupling Systems, Institute of Mechanics, Chinese Academy of Sciences, Beijing 100190, China
b School of Engineering Science, University of Chinese Academy of Sciences, Beijing 100049, China
c School of Civil Engineering, Beijing Jiaotong University, Beijing 100044, China
Keywords:
ABSTRACT Storm surge along the China's Zhe-Min coast is addressed using the tightly coupled surge model of ADCIRC+SWAN. In this study, we primarily focus on the effects of surge-tide interaction and wave set-up/set-down. And the influences of intensity and landing moment of tropical cyclone (TC) are also presented. The results show that: water elevation without considering tide-surge interaction tends to be underestimated/overestimated when TC lands during astronomical low/high tide;tide-surge coupling effect is more pronounced north of TC track (more than 0.7 m in our cases);irrelevant to TC's intensity, wave set-up south of TC track is negligible because the depth-related wave breaking doesn't occur in water body blown towards open seas.
Storm surge is an abnormal rise of water surface generated by a storm, over and above the predicted astronomical tide. It could be caused by extra-tropical cyclone in winter/spring or tropical cyclone (TC) in summer/autumn, and the latter tends to be more severe. Globally, storm surge ranks as the deadliest of all marine hazards. Before the development of routine operational forecast, thousands of death toll can be easily claimed by a single storm surge event, say more than five thousand death toll was caused by the storm surge in Yishi Bay, Japan on Sep. 26 of 1959; about 300 thousand people lost lives due to the storm surge in Bangladesh on Nov. 13 of 1970. With the aid of operational forecast and warning system of storm surge started around 1950s, the death toll in a single storm surge event has been considerably reduced to less than tens in the last decades.However, the economic losses were still shocking due to rapid industrialization and urbanization in coastal regions. The China Marine Hazards Communique (CMHC) reported that the annual direct economic losses exceeded 1.7 billion USD was by marine hazards in China in last five years (2012-2016) and 93% of them were attributed to storm surge. What more reluctant to see is that a few individual storm surges responsible for abnormally massive lives still exist due to the erroneous forecast. For example, more than 300 people lost lives in China during 2006 due to storm surge.
Li and Nie [1] reviewed the present status of storm surge prediction and concluded that comprehensive study on hydrometeorologic disasters including deepening the understanding of the coupling effects in storm surge events is one of the major challenging issues to enhance the forecast accuracy. Taking the hurricanes in the Gulf of Mexico as an example: the wave period varies over 5-25 s, and its significant wave height is as high as 20-25 m closer to the TC track and decreases to 1.5 m due to depthinduced breaking and bottom friction. It implies that the accuracy of storm surge prediction will be greatly influenced by the coupling effect between surge and wave, i.e. wave set-up/setdown. Besides, the surge-tide interaction may also play a role in storm surge prediction. Taiwan Strait, North Sea, Gulf of Mexico,Gulf of St. Lawrence, Bay of Bengal, South Korean and Australian coasts are regions where significant tide-surge interactions occur. It is capable of bringing about deviation of the water elevation from decimeters to more than one meter [2]. In addition,the magnitude of tide-surge interaction can vary in a wide range,the mechanism behind also differs from region to region. Zhang et al. [3] reported that the effect of bottom friction dominates the tide-surge coupling in Taiwan Strait. Rego et al. [4] examined the tide-surge interaction around Louisiana-Texas coasts and found that the role of nonlinear advection is more pronounced. In contrast, Zhang et al. [2] addressed the issue of tide-surge modulation for Leizhou Peninsula and concluded that the contribution of nonlinear advection term is negligible though the shallow water effect considerably intensifies it.
To predict storm surge, various hydrodynamic models have already been developed. Jelesanski et al. [5] proposed SPLASH for estimating peak surge of a storm, and now it has become a popular tool in the operational forecast of temporal and spatial surge fields. Other numerical models such as ADCIRC [6], ELCIRC [7], SELFE [8], CH3D [9], POM [10], FVCOM [11] and ROMS [12] have also been relied on for studying storm surge.Those hydrodynamic models usually solve the horizontal transport equation system derived from the vertical-integrated incompressible N-S equation, and the driven forces are mainly wind stress, atmospheric pressure and Coriolis force. Among those numerical models, SLOSH, POM, CH3D and ROMS use the structured grid, while ADCIRC, SELFE, and FVCOM use the unstructured triangular grids which seem to have better adaptability to the complex coastlines. Dietrich et al. [13, 14] has integrated the unstructured-mesh SWAN of spectral wave model and the ADCIRC model into a tightly coupling software. Within each coupling interval: 1) radiation stresses and their gradients are obtained firstly by solving the SWAN model and passed to the ADCIRC model; 2) water elevation is updated by solving the generalized wave continuity equation (GWCE) in the ADCIRC model; 3) a wetting and drying algorithm is implemented to activate and deactivate the elements during inundation; 4) currents and fluxes are computed by solving the depth-integrated momentum equations in the ADCIRC model, thus SWAN are ready to be solved using the updated currents. In this ADCIRC+SWAN coupled model, SWAN and ADCIRC are run on the same computational core and the same unstructured sub-mesh. Therefore, no interpolation is required and water elevations, currents,wind velocities and radiation stress gradients can be passed directly through local cache or memory resulting in high computational efficiency.
The governing equations of the ADCIRC+SWAN coupled model are written as Eqs. (1) to (4) [13, 14]. Equations (1) to (3)are the governing equations of ADCIRC model, while Eq. (4) is the governing equation of SWAN model, one of the third-generation wave models, which exhibits more robust and economic in shallow water than other third-generation wave models, say WAM cycle 3.
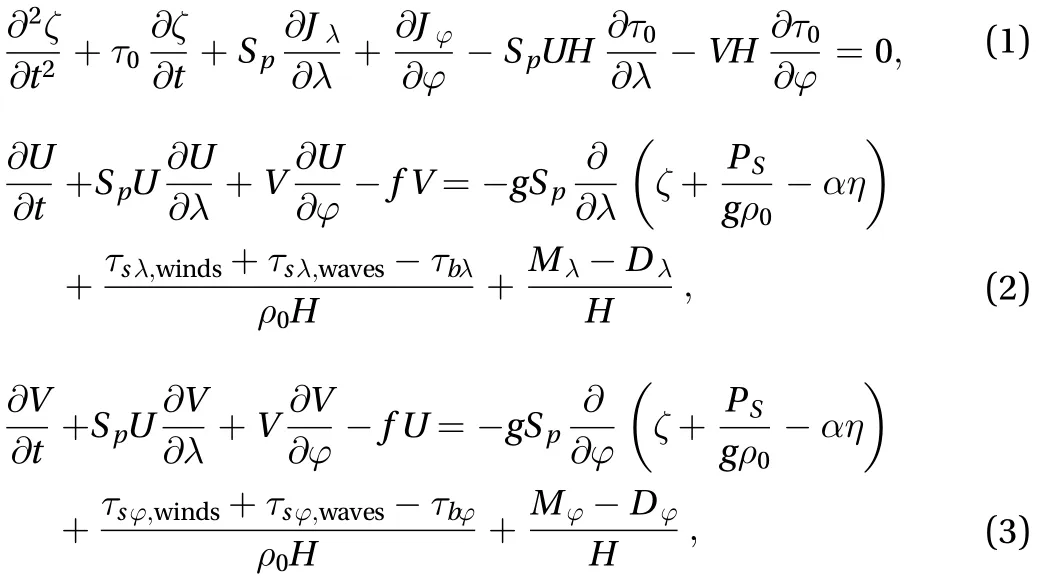

The wind and pressure fields of TC in this work are reconstructed based on the Holland model [15]. The wind stress() is the product of the square of current U (V),densityand the drag coefficient Cd. Cdhere we adopted is the linear formula proposed by Garratt [16]. The stress due to bottom2frictionis the product of the square of current U2(V), densityand bottom friction coefficient, which is variable depending on water depth along with some parameters suggested by Luettich et al. [17]. The tidal evolutions and the depth-averaged velocity of tidal currents are exerted on the open boundary. The tidal constituents we used are K1, K2, M2, N2, O1, P1,Q1 and S2 from the Le Provost tidal database FES95.2.
As for the source term of the wave model, six processes contribute to Stot, i.e. wave growth by the wind Sin, wave decay due to white capping Sds,w, bottom friction induced wave breaking Sds,b,depth-induced wave breaking Sds,br, and nonlinear transfer of wave energy through three-wave interaction Snl,3and four-wave interactions Snl,4. Wave energy are mainly inputted by wind and dissipated by white capping, bottom friction and depth-induced wave breaking in the shallow water. Those four source terms are expressed as Eqs. (5) to (8).
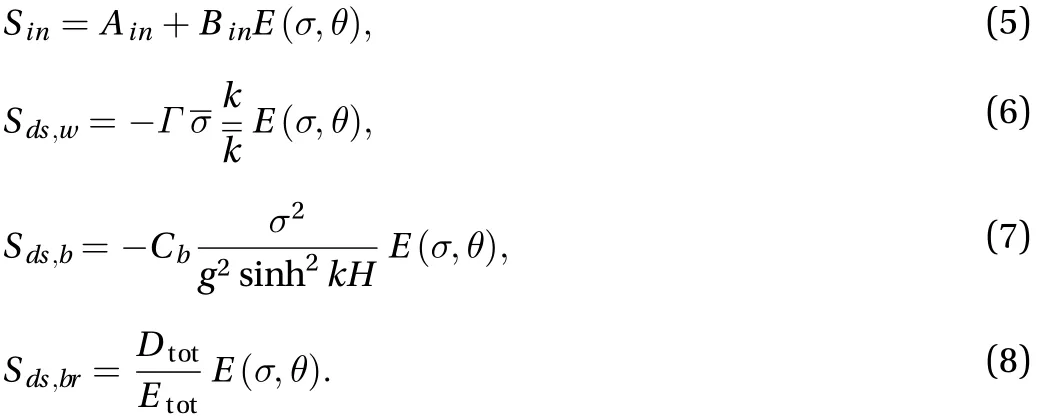
where Ainand Bindepend on wave frequency and direction, and wind speed and direction, and they satisfy the linear growth formula by Cavaleri et al. [18] and exponential growth formula by Kormen et al. [19], respectively.in the whitecapping dissipation term is a depth dependent coefficient. Cbis the socalled bottom friction coefficient. Etotis the total wave energy.Dtotis the rate of dissipation of the total energy due to wave breaking, it depends critically on the break parameter, i.e. the ratio of the maximum wave height and local water depth.
The aforementioned tightly-coupled ADCIRC+SWAN model and its parameterization schemes are applied firstly to TC Thane and then to Saomai (200608). The simulation results are compared with data from in-situ observation for validation of the model.
Thane initially developed as a tropical disturbance within the monsoon trough to the west of Indonesia on Dec. 23 UTC and finally made its landfall on the north Tamil Nadu coast between Cuddalore and Puducherry. Its 1-minute sustained wind speed was as high as 165 km/h on Dec. 29 UTC. The simulated water elevation at stations Ennore and Nagapattinam are compared with numerical results and in-situ observations from Ref. [20] as presented in Fig. 1. It shows that the tide, surge and wave coupling induced water elevation are well reproduced.
Saomai formed on Aug. 5, 2006 UTC on the NWP, and it was upgraded to a severe tropical storm on Aug. 6. It moved toward the northwest, and finally struck town Cangnan in the southern of Zhejiang Province coast directly. It maintained a small and clear eye during landing with maximum wind speed exceed 216 km/h and central pressure as low as 920 mbar. The China Meteorological Administration (CMA) considered Saomai as the strongest TC on record to strike the mainland. In-situ records at Damutu, Wave Buoy Donghai-18 and Shacheng are collected to validate the simulated results. The locations of the three stations are marked as the red dots in Figs. 3(a) and 3(c). Tide gauge Damutu is about 170 km away from the TC track implying the water elevation there is mainly due to the astronomical tide. Wave Buoy Donghai-18 is located near the TC track but far away from the shore. It can be used to assess the quality of wave simulation.While, Shacheng located just right near the landing area can be used to validate the storm surge. As shown in Fig. 2, the storm surge (see Fig. 2 (a)) and tide evolution (see Fig. 2 (b)) are well reproduced in our simulation. The amplitude of the maximal significant wave height is well captured as well (see Fig. 2 (c)).The deviation of significant wave height before Aug. 9 is due to our model runs from an initially calm sea state. In general, a satisfactory result for wave simulation is obtained considering the mesh size at location of Wave Buoy Donghai-18 is coarse.
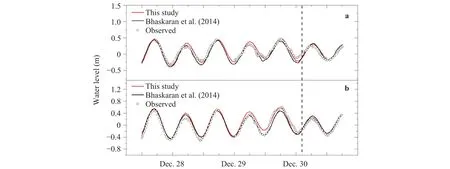
Fig. 1. Water elevation at stations Ennore and Nagapattinam during TC Thane made its landfall at Tamil Nadu region of India. a station Ennore, b station Nagapattinam. The red line is the simulated results in this study, the black line and circles are numerical results and in-situ observations from Ref. [20]. The dash lines denote the landing of Thane. The observation data is incomplete due to data in the last six hours of Dec.28 is missing [20].

Fig. 2. Comparison of tide, wave and surge during Saomai. a Water elevation rise due to storm surge at Shacheng station which means the regular tide is deducted; b water elevation evolution at Damutu station; c significant wave height at Wave Buoy Donghai-18.
Using the validated ADCIRC+SWAN model and parameterization schemes, the coupling effect between tide and surge, and wave set-up/set-down are addressed along the China coast.Without the shield of islands chain and the buffer of vast East China Sea, most of Zhe-Min coast turns out to be area heavily damaged by storm surge in China. TCs landing there usually have larger wind speed and lower central pressure. On the other hand, the economic loss due to storm surge in this newly developed economic region has become more enormous. According to CMHC, the direct economic loss of Fujian Province are 0.25 (in 2016) and 0.48 (in 2015) billion USD ranked first among the coastal provinces. Finally, Zhe-Min coast also belongs to a region where storm surge hazard hasn’t been well studied compared with the South and East China coasts, let alone the analysis of the coupling effects. The probable reason is that the degree of economic and population aggregations there are less than that at the Yangtze River delta and Pearl River delta.
Four cases totally as shown in Table 1 have been designed based on TC Saomai. Cases 1 and 2, in which TC landed during astronomical low and high tide, respectively, can be used to examine the influence of landing moment on the tide-surge interaction. The intensity of TC in Case 3 and 4 are designed to be 5%and 10% larger than that of Saomai considering the tendency of increasing TC intensity [21]. They can be used to examine the influence of TC intensity on the coupling effects. The TC tracks in the four cases are the same as that of Saomai as shown by the red solid line in Figs. 3(b) and 3(c).
According to the TC track, the area of interest is shown as the red rectangle in Fig. 3(a) with the unstructured mesh presented as shown in Fig. 3(c). The total computational domain is extended to the whole Bohai sea, East China sea, the northeast of South China sea, the sea area around the Ryukyu, Taiwan and north Philippine islands to reduce the impacts of the open boundaries, see Fig. 3(a). The bathymetry for the area of interest is presented as shown in Fig. 3(b), and its bathymetry data is from GEBCO database with resolution of 30 arc second.
The distribution of water elevation at two moments for Case 1 is presented as shown in Fig. 4 firstly. From Fig. 4, water elevation north of TC track rises, whereas water elevation at the south drops. As for the north area, water body trends to gather at the bays resulting high water elevation at the south coastlines of each bay (3.24 m maximal). Those areas are at high risks of inundation. Water body south of TC track tends to be blown towards open seas.
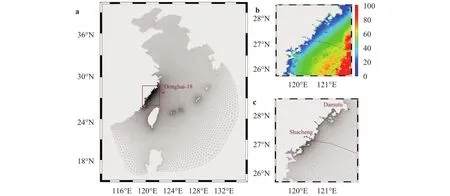
Fig. 3. Bathymetry and computational unstructured mesh for Zhe-Min Coast. a Whole computational domain with the area of interest marked by the red rectangle, b and c are the bathymetry and mesh of the interested area. The red solid lines in b and c are the TC tracks, while the red dots in a and c are the locations of observation stations Donghai-18, Damutu and Shacheng, respectively.

Table 1 Cases designed to observe the coupling effects at Zhe-Min Coast during storm surge events. TCs in the four cases have the same track as Saomai but different landing moment and intensity. TCs in Case 1 and Case 2 land during the period of astronomical low and high tide,respectively; while wind speeds in Case 3 and 4 are 5% and 10% larger than Saomai, respectively.
To quantify the coupling effects, two dimensionless number CTSand CWSare defined. CTSexpressed as Eq. (9) is for the tidesurge interaction, while CWSexpressed as Eq. (10) is for the wave-surge interaction, i.e. wave set-up/set-down,

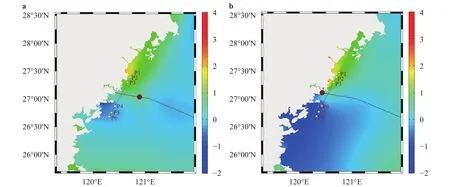
Fig. 4. Distribution of water level (m) for Case 1. a 07:00 Aug. 10, i.e. two hours before the landfall moment; b 09:00 Aug. 10, the landfall moment. P1-P6 are six locations chose to observe the coupling effects quantitatively. The coordinate information of P1- P6 are (120.78°E, 27.52°N),(120.73°E, 27.43°N), (120.66°E, 27.31°N), (120.42°E, 26.88°N), (120.34°E, 26.74°N) and (120.28°E, 26.64°N), respectively. The red solid line and dot are the TC track and TC eye, respectively.
We have analyzed quantitatively CTSand CWSat six locations,P1-P6 in a line about 3-10 km away from the coastline as shown in Fig. 4. P1-P3 are located in the north of the TC track, whereas P4-P6 in the south of the TC track. P3 and P4 are almost right on the radius of maximal wind speed.
The variation of CTSfor Case 1 and Case 2 are presented as shown in Fig. 5, demonstrating that CTSexperiences three phases in a storm surge event: 1) insignificant premonitory fluctuation at early period; 2) a remarkable rise/drop when the maximal wind speed arrives; 3) residual oscillating at the astronomical tidal period with a gentle magnitude decay when TC passes over.For Case 1, the magnitude of CTSfor P1-P3 range as high as 0.25-0.28, and those for P4-P6 from 0.13 to 0.16; while that for Case 2 range from -0.17 to -0.13 and -0.13 to -0.10, respectively. More specifically, deviation of water elevation introduced by tidesurge interaction are about 0.60 to 0.70 m at P1-P3 for Case 1;while those at P1-P3 for Case 2 are from -0.57 to -0.71 m. The facts demonstrate that: 1) a model without considering the tidesurge coupling effect, say estimating the water elevation simply by superimposing the wind-induced surge on the astronomical tide, trends to underestimate/ overestimate them when TC lands during astronomical low/high tide; 2) tide-surge coupling effect is more pronounced north of TC track, and that at south is not negligible as well.
Figure 6 represents the variation of CWSfor Case 1 and Case 2. CWSat P1-P3 are about 0.09-0.11 for Case 1 (see Fig. 6(a)) corresponding to wave set-up of 0.21-0.27 m. Whereas, CWSat P1-P3 are about 0.05-0.06 for Case 2 which seems much smaller than that of Case 1. However, wave set-up at P1-P3 for Case 2 can still as high as 0.21-0.26 m, sinceSWTat P1-P3 for Case 2 are much larger (about 4.40 m). The magnitude of CWSat P4-P6 are much smaller corresponding to wave set-down of only a few centimeters, which suggests that the wave set-up of south TC track is insignificant, for which the water body there blown towards open seas is responsible. And thus wave set-up taking place behind breaking point [22], cannot be observed. From Fig 6, we can also find that the peak of wave set-up appears at 3 hours before TC arrives, whereas the tide-surge interaction reaches its maximum when TC landing (see Fig. 5). The reason may be that the wave propagation faster than the translation speed of TC.
The magnitudes of CTSand CWScan be affected by the TC intensity, but not for the phases of CTSand CWS. Fig. 7(a) illustrates that all of CTSin P1-P6 rise with wind speed. Quantitatively, CTSfor Case 3 (Case 4) is 5%-8% (10%-15%) larger as compared to Case 1. Fig. 7(b) shows that the influence of TC intensity on the wave set-up south of TC track is not distinct. CWSat P5 and P6 even diminish with TC intensity. From the colored columns in Figs. 7(a) and 7(b), the deviation in water elevation due to tidesurge interaction is almost twice that of wave set-up/set-down.
Coupling effects play a role in the accuracy of storm surge prediction. In this work, the tide-surge interaction and wave setup/set-down at Zhe-Min coast during storm surge event are investigated based on the tightly coupled model of ADCIRC+SWAN. The results show that: 1) water elevation without considering tide-surge interaction tends to be underestimated /overestimate when TC lands during astronomical low/high tide, and tide-surge coupling effect is more pronounced north of TC track (more than 0.7 m in our cases), but that at south of TC track is not negligible as well (more than 0.35 m in our cases); 2) wave set-up is significant north of TC track,while that south of TC track is negligible since depth-related wave breaking doesn’t occur in water body blown towards open seas there.
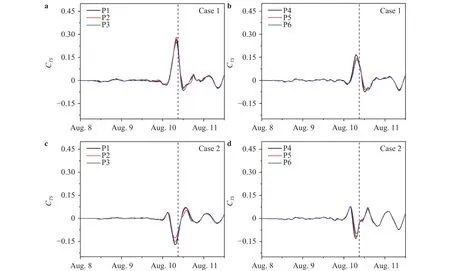
Fig. 5. Tide-surge coupling effect at P1-P6. a and b are CTS for Case 1 at P1-P3 and P4-P6, respectively; while c and d are that for Case 2. CTS is a dimensionless number quantifying the tide-surge coupling effect as expressed in Eq. (9). The dash lines denote the landing moment of TC.
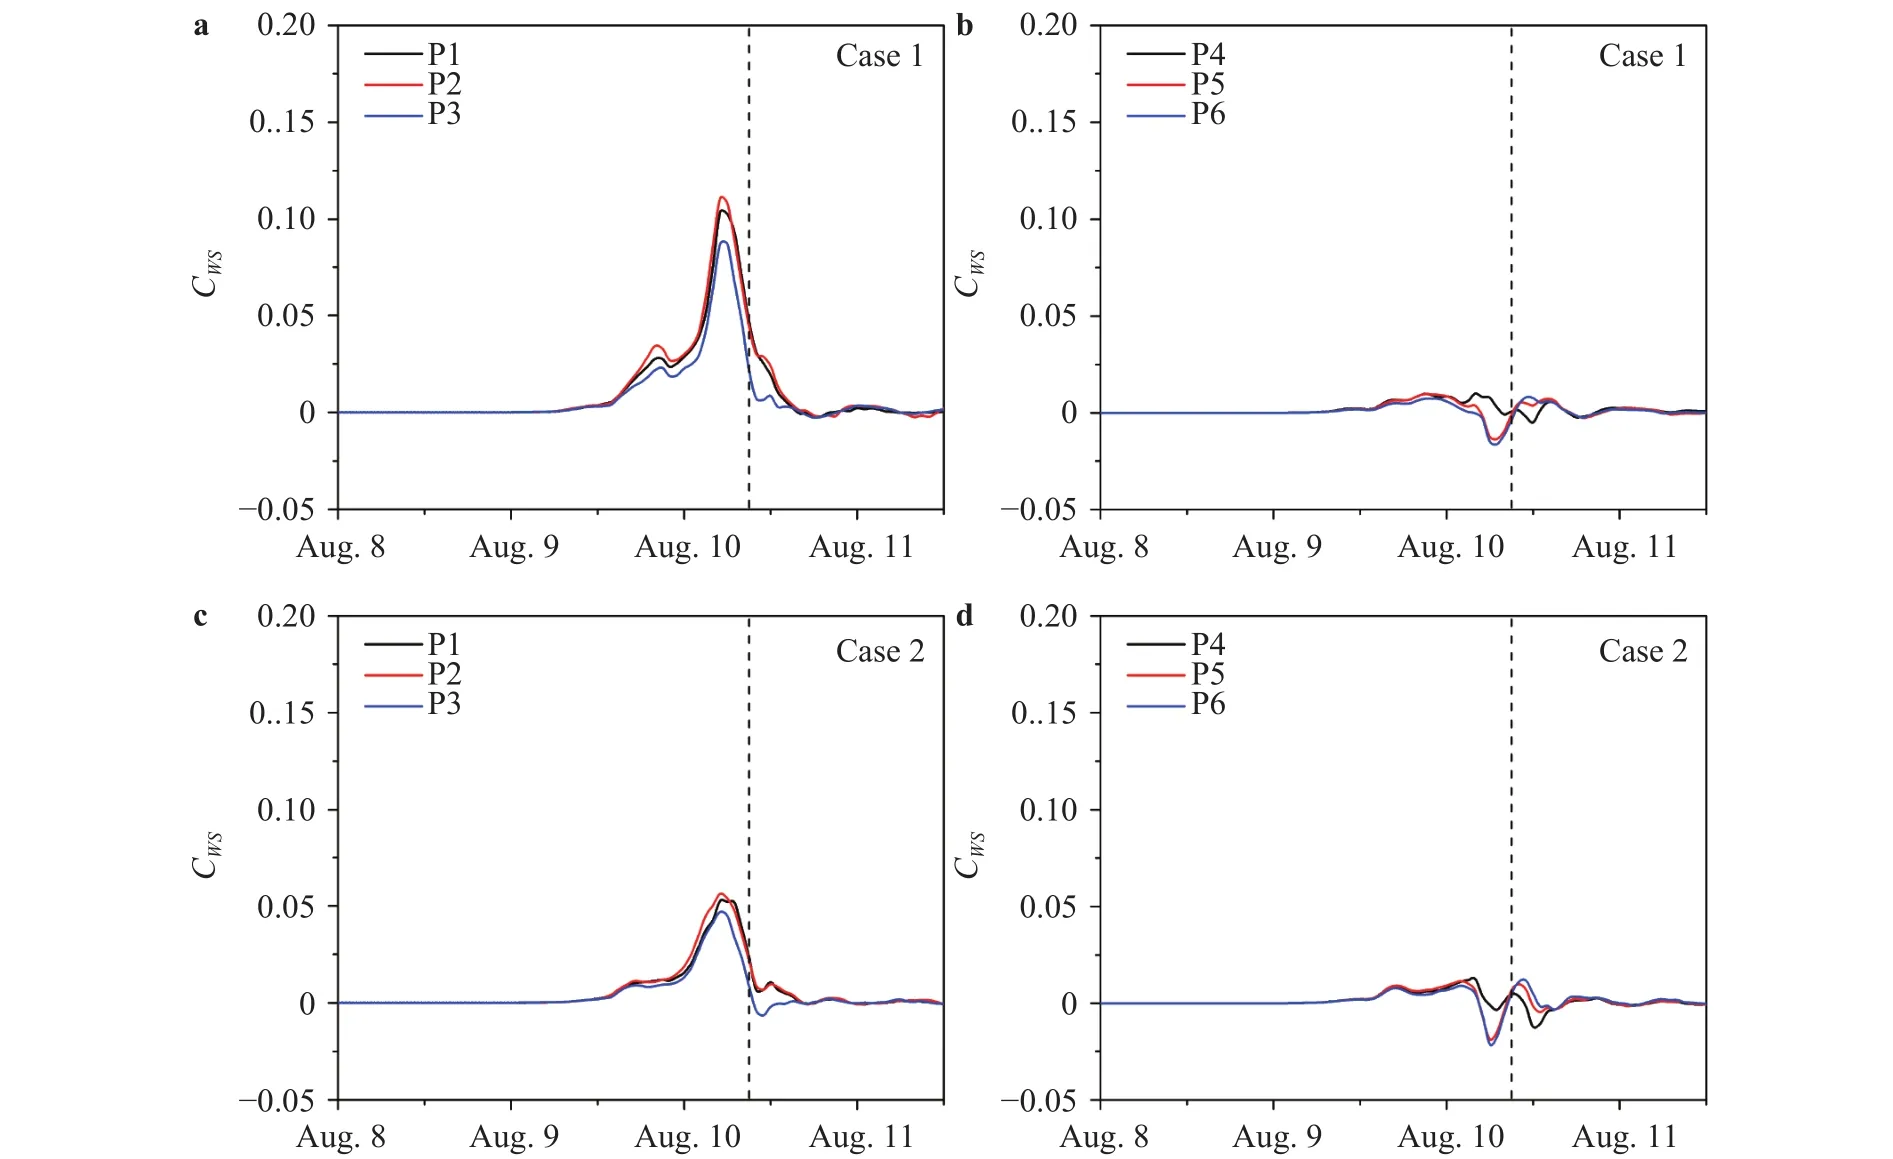
Fig. 6. Wave-surge coupling effect at P1-P6. a and b are CWS for Case 1 at P1-P3 and P4-P6, respectively, ; while c and d are that for Case 2. CWS is a dimensionless number quantifying the wave-surge coupling effect as expressed in Eq. (10). The dash lines denote the landing moment of TC.

Fig. 7. Influence of TC intensity on the coupling effect. a the colored column denote the magnitude of deviation in water level caused by tidesurge interaction, and the gray column are CTS. b the magnitude of wave set-up/set-down and CWS, respectively. Dimensionless CTS and CWS as expressed in Eqs. (9) and (10) indicate the coupling degree.
Acknowledgments
The authors are grateful to the support of National Natural Science Foundation of China (11772339) and the Strategic Priority Research Programs (Category B) of the Chinese Academy of Sciences (XDB22040203).
杂志排行
Theoretical & Applied Mechanics Letters的其它文章
- Rational subgrid-scale modelling: a short survey
- Rowing jellyfish contract to maintain neutral buoyancy
- Wave reflection in semiconductor nanostructures
- Achieving thermal magnification by using effective thermal conductivity
- Numerical investigation on convective heat transfer over two heated wall-mounted cubes in tandem and staggered arrangement
- Nonlinear thermo-structural behavior of sandwich panels with truss cores under through-thickness gradient temperature field
