Quantitative characterization of deformation and damage process by digital volume correlation: A review
2018-05-19FengXu
Feng Xu*
Chinese Academy of Sciences Key Laboratory of Mechanical Behavior and Design of Materials, Department of Modern Mechanics,University of Science and Technology of China, Hefei 230026, China
1 Introduction
Digital volume correlation (DVC) technology combined with internal imaging methods, such as X-ray microcomputer tomography (XCT) [1], confocal microscopy (CM) [2], and magnetic resonance imaging (MRI) [3], can be used for many comprehensive in situ investigations on bones [4], cells, soft gels, granular materials, foams, ceramics, polymers, and metals and their alloys. The technology can effectively quantify the mechanical responses of internal microstructures. Through the in-depth study of the mechanism of material deformation and damage,many problems (such as the representing strain inhomogeneity and extracting the crack-tip stress intensity factor (SIF)) must be solved from a higher dimension and a special structure within the material, rather than simplifying into a plane problem. In certain materials (such as ceramics, rocks, and concrete), destruction is a sudden process; the internal deformation process of such materials is difficult to study intuitively only through the structural changes. By contrast, DVC, a quantitative representation of the tool, holds great potential in characterizing internal deformation damage and extracting related parameters.
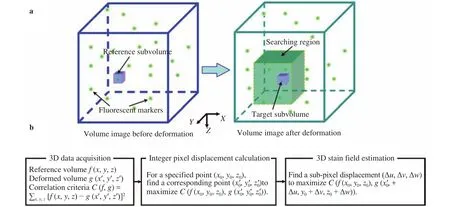
Fig. 1. a General format of digital volume correlation calculation [9]. b Schematic diagram of the overall process of DVC
In 1999, Bay et al. [1] proposed a digital correlation method for measuring the 3D displacement field and strain field of uniaxial compression bone for the first time. The DVC method fundamentally enhanced the level of evolutionary information obtained in 3D imaging and would hence potentially benefit the field of biomaterials. The general calculation format of DVC comprises two stages (Fig. 1) [5-9]. The first stage is the 3D displacement field calculation, which means specifying the interrogated points within the volume image before deformation and tracking their corresponding locations in the volume image after deformation to extract their 3D displacement vectors caused by exerted loading. The second stage is the 3D strain field estimation, which means calculating the strain components from the discrete displacement vector field using an appropriate correlation criteria and shape functions. In recent years, the combination of high-precision and high-efficiency DVC with high-resolution computed tomography technology has greatly expanded breadth and depth of the research scope of DVC applications in 3D problems. In this review, we introduced the applications of DVC in numerous fields, such as the cell migration, internal movement of granular materials, the discharge process of electrode materials, deformation of porous materials and composites, crack initiation and fracture of brittle materials, extraction of the SIF of crack fronts, and the fatigue crack closure effect.
Furthermore, the current research focus of DVC, which should be more accurate and more efficient, was discussed. Optimizing DVC algorithms should be the main approach to improve computing efficiency until computing hardware are developed sufficiently in the future. Besides, novel experimental methods which can acquire high-resolution internal 3D information would greatly influence the accuracy of DVC. Combining efficient algorithms and high-resolution 3D information, the application of DVC method would be greatly extended and might bring internal mechanical behavior study into a new stage.
2 Applying DVC in studying deformation and damage process
3D images obtained from previous experiments are often consulted for visual judgments. However, these judgments based on visual images cannot directly contribute to quantitative analysis. The DVC method can obtain image sequence of the structural evolution between the material's responses to the deformation under the load. The DVC method can measure the internal deformation of the load object and provide a powerful means to study the internal strain and failure process of the composite specimen. Many scientific problems in mechanics also possess quantitative and meticulous characteristics. Solving these components require accurate theoretical description and quantitative calculations, which can be satisfied by DVC's ability to achieve quantitative structural deformation parameters. In recent years, DVC has been widely used for mechanical research in numerous fields. Characterizing movement, strain field evolution, and behavior in the crack-tip zone by DVC method is reviewed in the following sections.
2.1 Tracing of target object movement
The classical continuum theories (which do not consider internal length parameters) are limited and instruments that can visualize particle movements at the microscopic level are lacking. Furthermore, the available computational tools for quantitative measurements are insufficient. Given these shortcomings,only a few studies have been developed to describe the internal structure of materials. Along with high-resolution 3D XCT, DVC can recognize the granular material in the external shear, biological growth, and other external actions under particle movement. As such, DVC helps illuminate the orientation and law of grain movement. Moreover, DVC can be used to intensively study bio-active cells and tissue through cell movement and implant micro-movement and hence increase the understanding on cell migration and joint repair. DVC can also quantify the local displacement of electrode materials during the charge–discharge process of energy materials (such as lithium ion battery).The resultant information helps increase understanding on the mechanism of micro-scale structure evolution. Therefore, this section reviews the application of DVC in tracing target object movement from three aspects: the movement of grain, the movement of cell and implant, and local displacement of electrode materials.
When a large soil amount is sheared, the deformation is usually positioned as a strong shear region called a shear band. To describe the internal structure of the shear band, A. Hasan et al.proposed a quantitative assessment of the spatial changes of particle orientation, contact, and porosity in sand samples loaded under plane strain conditions [10]. This measurement can be used to validate the model of the deformation behavior and particle interaction of the treated shear particulate material.The mechanical behavior of the granular material is not well understood because of the complex solid/fluid behavior. Incremental DVC was developed to determine the internal deformation of each particle’s Mason sand [11]. The rotation angle and secondary major strain of the sand is determined relative to the reference state. This strategy can ascertain the sand relative to the reference state of the rotation angle and the secondary main strain and help observe the evolution force chain with the deformation process. The method provides a direct experimental procedure for characterizing granular material force chains. The incremental DVC techniques can help obtain the internal deformation and track the movement of individual saccharides. Hu et al. [12] found that the evolution of the internal 3D deformation of PBS was related to its microstructure, debonding, and void formation. The local structure of the pore characteristics and the local soil deformation caused by the hydraulic and mechanical stress can be quantified by gray-scale tomography of the 3D morphology and correlation analysis [13]. An explicit and quantitative in vivo analysis platform for growing soil changes in roots was established [14]. The field-derived soils were validated under uniaxial compression conditions, and the thresholds for quantitative displacement and strain measurements were calibrated. This fusion method enables the comparative study of soil and plant species and helps raise the understanding of the basic mechanical process during root development. For powder metallurgy assembly, including the particle microstructure evolution processes in copper powder sintering, researchers accurately quantify the 3D motion of the particles and the different local strains for the first time [15]. To clarify the behavior of the granular semi-solid system and the nature of the underlying particle deformation mechanism, they conducted a 4D (3D plus time) quantitative study of the granular behavior of equiaxed branch three-phase materials (Fig. 2) [16]. Concurrently, Cai et al. measured the macroscopic mechanical behavior and evolution of the microstructure and damage. They also quantified the local normal strain distribution and shear strain distribution to identify the expansion shear zone.
The cells in the body often move from one place to another to complete their function in a process called cell migration. During cell migration, cells must exert a force on the external tissue or extracellular matrix (ECM). Kwon et al. [17] studied cell mechanics by measuring the displacement field caused by cell motility. The traditional linear elasticity theory is adopted to quantify the surface traction generated by cells. The mechanical properties of the cell microenvironment can lead to many important cellular processes, including diffusion, migration, and differentiation. Wentzell et al. [18] investigated the mechanical micro-environment of intact bones on a single bone cell scale.Maskarinec et al. [19] tracked and quantified the ECM deformation on all three spatial dimensions (Fig. 3). Research on the relationship between morphological and mechanical properties of biological tissues and biomaterials is essential for biomedical engineering applications in joint repair and alternative materials. Sukjamsri et al. [20] accessed the bone–implant interface without damaging the important parts of the samples and provided a full- field evaluation of the micro-motion around implant under study. Madi et al. [21] measured the 3D displacement of a scaffold implant under uniaxial compression and found a good agreement with the simulated results of the microfinite element models. The study showed that DVC can successfully measure volumetric strain and may be employed to study the mechanical behavior of porous implants.
The evolution of microstructures during energy processing and operation affects the performance and longevity. Tracking the dynamic form of the active material during lithium battery operation is critical in identifying the cause of performance loss.Eastwood et al. [22] studied the structural changes of the device quantitatively during operation, the dimensional changes during the charge cycle at the electrode level, and the Mn2O4particle size (Fig. 4). Meanwhile, Finegan et al. [23] quantified the local displacement and the 3D strain during the whole discharge process. The quantified results helped track the expansion of the lithography caused by lithiation within the electrode material. The scholars monitored the displacement of the rigid current collector and the battery material; this displacement contributed to the severe electrode detachment and crack formation during discharge. Paz-Garcia et al. [24] explored the mechanical deformation of basic battery components (electrodes and separators) during lithiation. The use of delayed XCT coupled with DVC was demonstrated to be an effective diagnostic technique for identifying the cause of performance loss in commercial lithium batteries. This novel approach is expected to guide the development of commercial battery designs with improved efficiency.
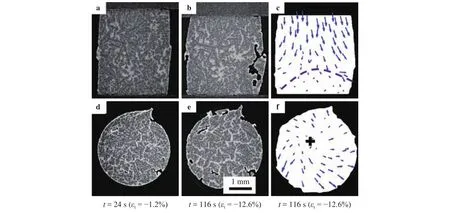
Fig. 2. a–b Longitudinal slices of semi-solid Al-15 wt.% Cu alloy; d-e mid-height transverse slices; c and f grain displacement from-1.2% to -12.6% (the dashed line indicates the discontinuity of displacement field, “+”shows the central point of displacement field) [16].
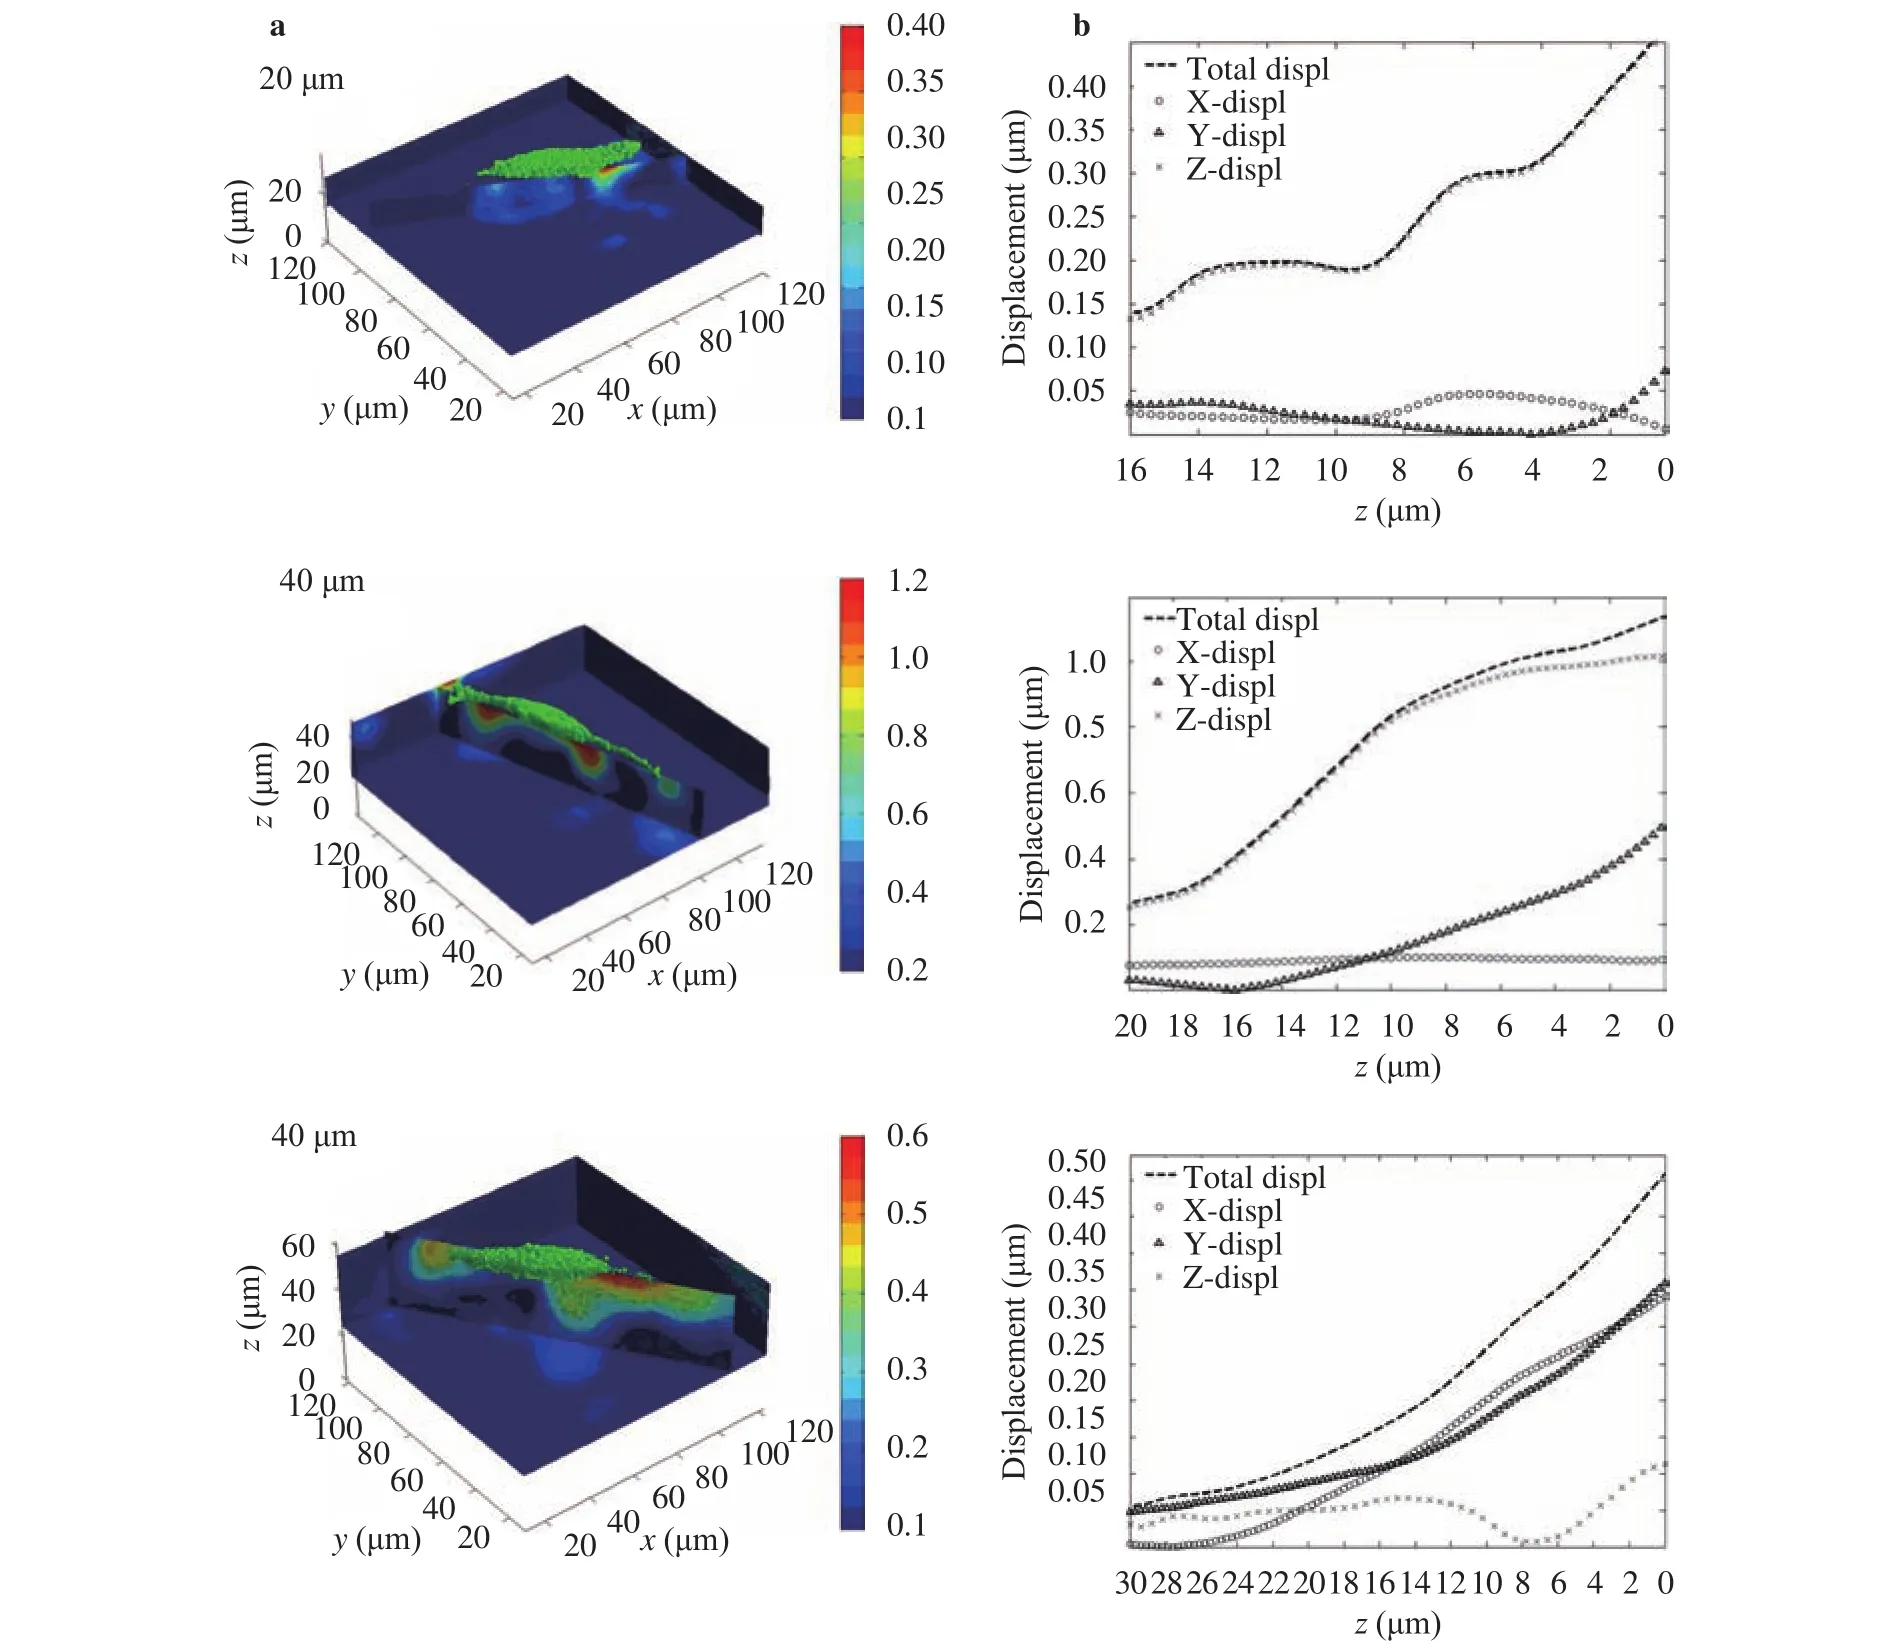
Fig. 3. Displacement contour slices along the long axis of the cell and corresponding displacement line plots as a function of depth for samples of varying heights. a Slices of displacement contours underneath migrating cells show significant deformation in the normal direction that decays along the thickness of the sample. b Corresponding line plots of the total and individual displacement components taken near the leading edges of the cells [19].
2.2 Characterizing the strain field evolution and analyzing the damage process
DVC in the field of mechanical applications experienced a simple confirmation of the evolution of the deformation field to the fine analysis of damage process. New high-performance materials, such as fiber-reinforced composites, porous materials,particle reinforcement materials, and lightweight alloy materials, have emerged. To effectively apply these materials in engineering practice, the mechanical theory must be used to predict their deformation capacities and structural stiffness. However,these theories are often based on macro-experiments and lack direct micro-experimental evidence. Studying the deformation of such materials requires internal characterization methods.The progress in the DVC method provides solutions to this problem.
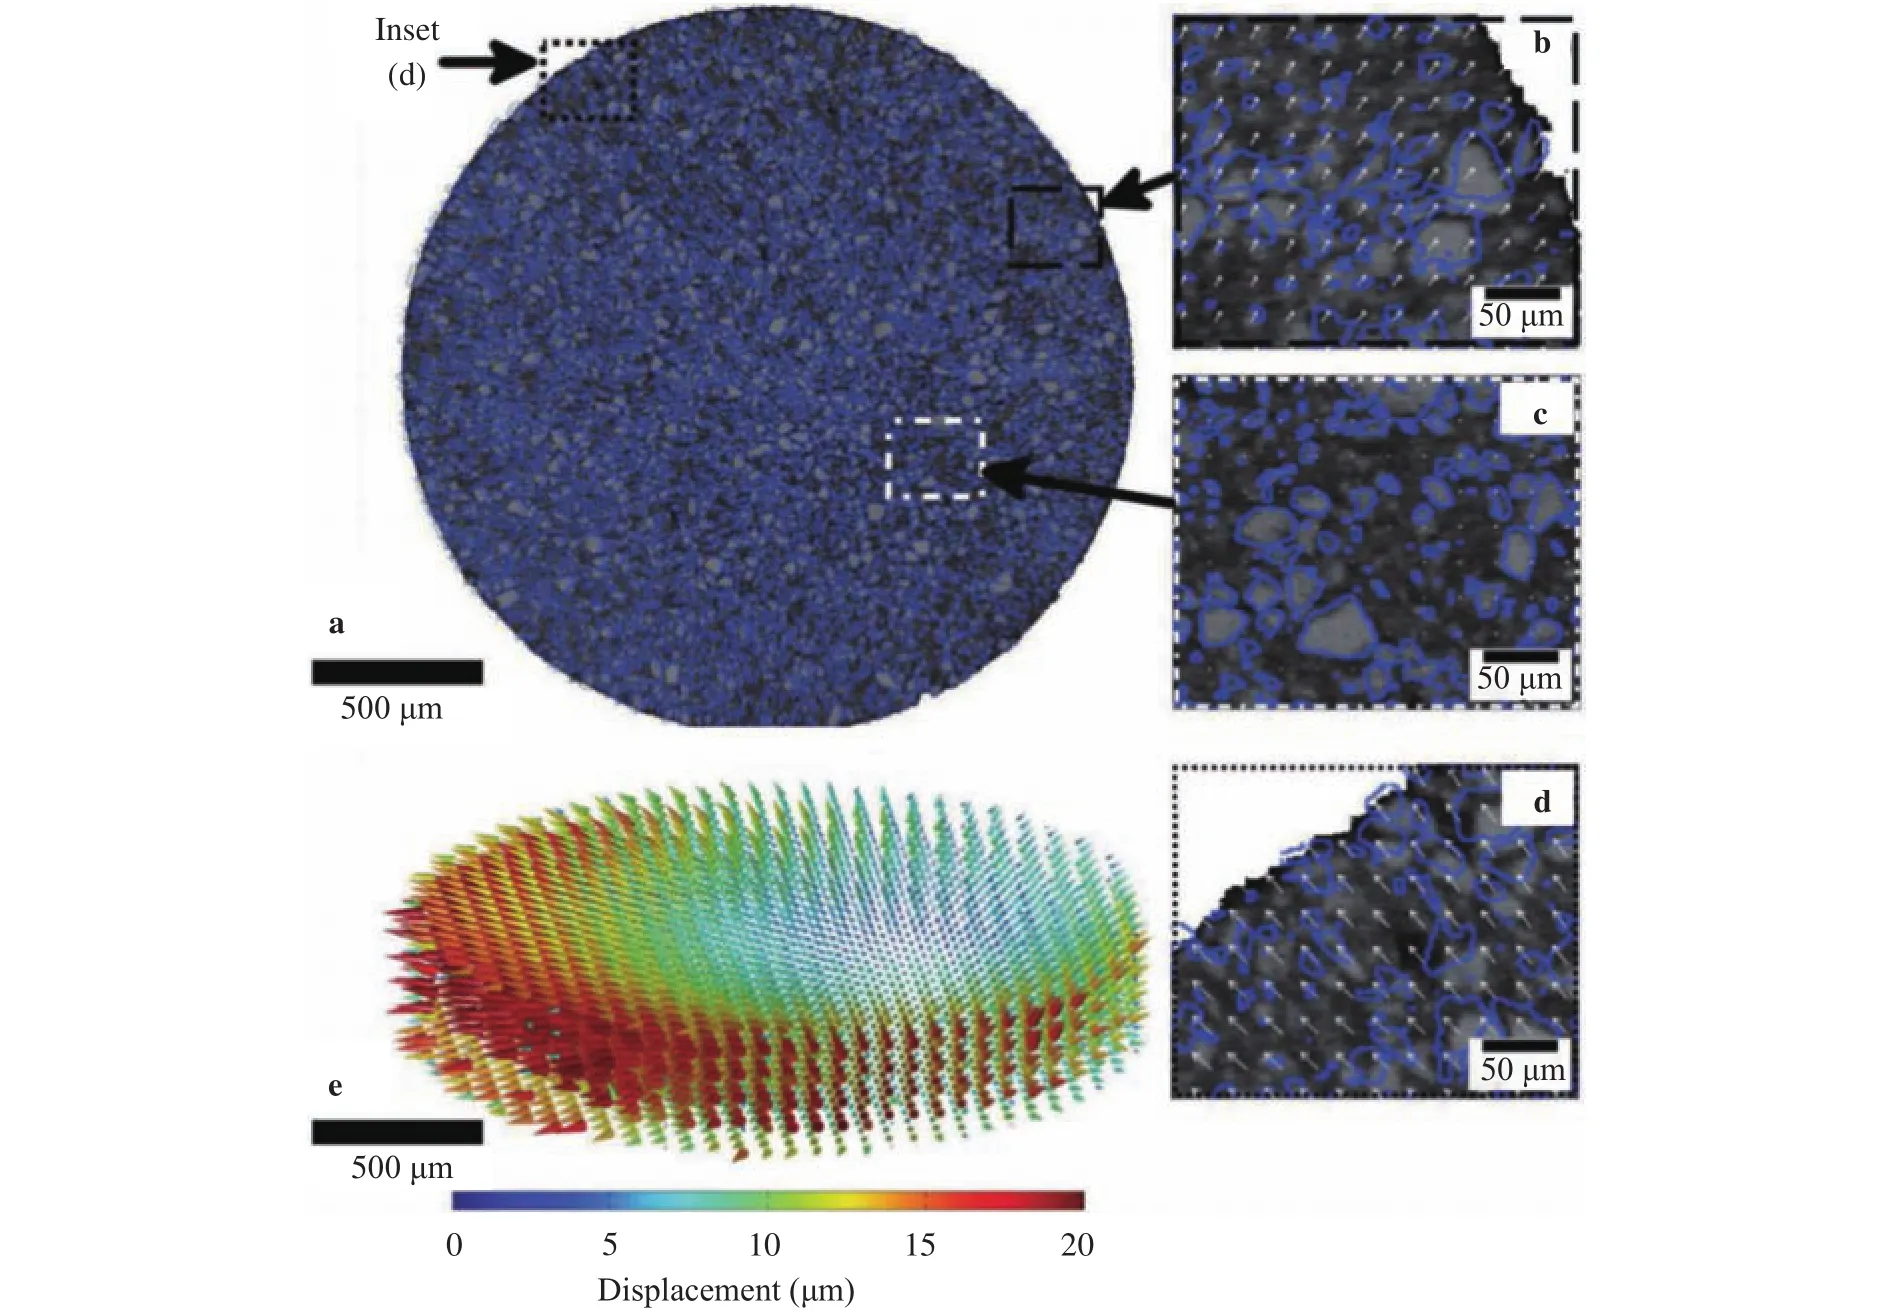
Fig. 4. a Reconstructed radial slice (grayscale). b-d Displacement vectors of the grains. e 3D representation of the displacement throughout the electrode [22].
Many advanced synthetic foams and composites, as well as most natural materials, face enormous challenges in mechanic experimental and analytical processes. Investigating their failure mechanisms entails substantial information on the internal strain distribution of the material [25]. Under the DVC method,the displacement field can be measured by sub-volume tracking using the image texture within the material. The strain field is also calculated from the displacement field by the gradient estimation technique [1]. This approach can provide direct experimental evidence without the need to assume regarding the material properties and allows the exploration of the mechanical properties of materials with sufficient spatial resolution [26]. To ensure the accuracy of the internal deformation and strain of the material, one can directly compare the calculated strain of DVC with the finite-element (FE) simulation of the experiment (Fig. 5)[27-29]. A miniature compression fixture was established for the in situ compression testing of bovine trabecular bone by microscopic MRI. The experimental and calculation results showed the feasibility of 3D displacement field and strain field analysis of the microscopic MRI images [3]. The whole-field measurement of the deformation of bone and other biological structures is a promising experimental method for studying the spatial heterogeneity of mechanical behavior [30]. Gillard et al. [31] combined material structural information with whole-strain field measurement to identify the Poisson’s ratio for each compression step. In the process, the authors employed a special inverse method called virtual field method. Meanwhile, Danesi et al. [25] measured the full 3D strain field distribution in the elastic state and the failure of augmented vertebrae. Palanca et al. [32] processed acquired images by using two independent DVC methods (local and global) and considered different calculations of the subvolume size to assess the strain measurement uncertainty. These studies showed that DVC can be successfully used to measure volume strain and quantitatively study the micro-mechanical behavior of bone specimens.
Composite sandwich panels are widely used in the transportation industry. Macroscopic and microscopic constitutive equations must consider the foam structure to improve the foam’s performance in the sandwich plate. A new global approach (C8-DIC) was proposed to estimate the 3D displacement field for a compression test on a cellular material, that is, a polypropylene solid foam [33]. Good stability of the displacement field was also obtained. Comparison of the tensile properties between standard and auxiliary polyurethane foams revealed the complex microstructural mechanism of transverse strain [34]. To understand the overall structural heterogeneity of the material, the 3D displacement field was achieved using a sub-set-based DVC method [35]. The results are promising in identifying local foam properties. The failure behavior of sheet structures is also not always well understood. Thus, studying the material volume deformation mechanism is highly important. Thomas et al. [36] introduced a regular DVC program for measuring the local displacement field and strain field. The program suggests that strain localization is caused by material yield, damage, and plastic deformation. Meanwhile, Morgeneyer et al. [37] measured the damage and plastic strain field before a notch was introduced into a 2198 Al–Cu–Li alloy plate (Fig. 6). The strain accumulated stably in the slanting zone, and the crack propagated quickly. Mostafavi et al. [38] characterized the plastic deformation near the hardness indentations areas and the 3D whole displacement field in two ductile metals. Plastic material properties, i.e., yield stress and hardening index, have been proven to be extracted by analyzing deformation field. These results are strongly consistent with using the simulation of FE model. These studies show that DVC is a perfect tool for studying the complex mechanical behavior of cellular materials.
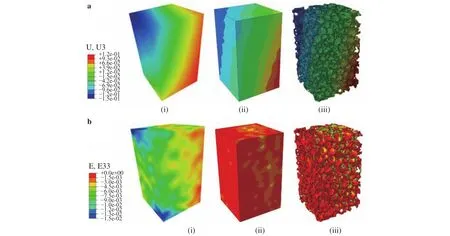
Fig. 5. a Comparison of the displacement distributions in the loading direction of the VOI obtained from: (i) DVC calculation; (ii) average FE results; (iii) micro-FE results. b Comparison of the strain distributions in the loading direction of the VOI obtained from: (i) DVC calculation; (ii)averaging FE results; (iii) micro-FE results [29].

Fig. 6. Incremental von Mises equivalent strain fields between a Load steps (1) and (2), b Load steps (2) and (3), and c Load steps (3) and (4)[37].
The growing demand for environmentally friendly materials has stimulated interest in natural fiberboards. 3D compressive strain field analysis of plant fiber material showed a non-uniform internal strain in the composite material (The strain field concentrated in some areas) (Fig. 7) [39]. The dominant mechanism of the local mechanical behavior was discussed, and the relationship between strain field and structural parameters, such as different local porosities and fiber diameter morphological states, were established. The complete 3D strain field of the micro-scale wood structure is determined by means of a threepoint bend experiment [40]. Experimental results show that the algorithm can be successfully used at the micro-scale to perform 3D strain measurements on wood. Failure prediction remains as a complex structural design problem for laminated composites because of the complexity of the inherently heterogeneous composite structure. Brault et al. [41] proposed a special in situ loading device for the three-point bend test to visualize the transverse shear effect in the composite structure. The group also measured the displacement and deformation of the entire volume of the composite material. Meanwhile, Lecomte-Grosbras et al. [42] coupled 2D and 3D measurements to study freeedge effects and capture the depth evolution of residual displacement discontinuities at the interface layer.
2.3 Characterizing the behavior around the crack-tip zone
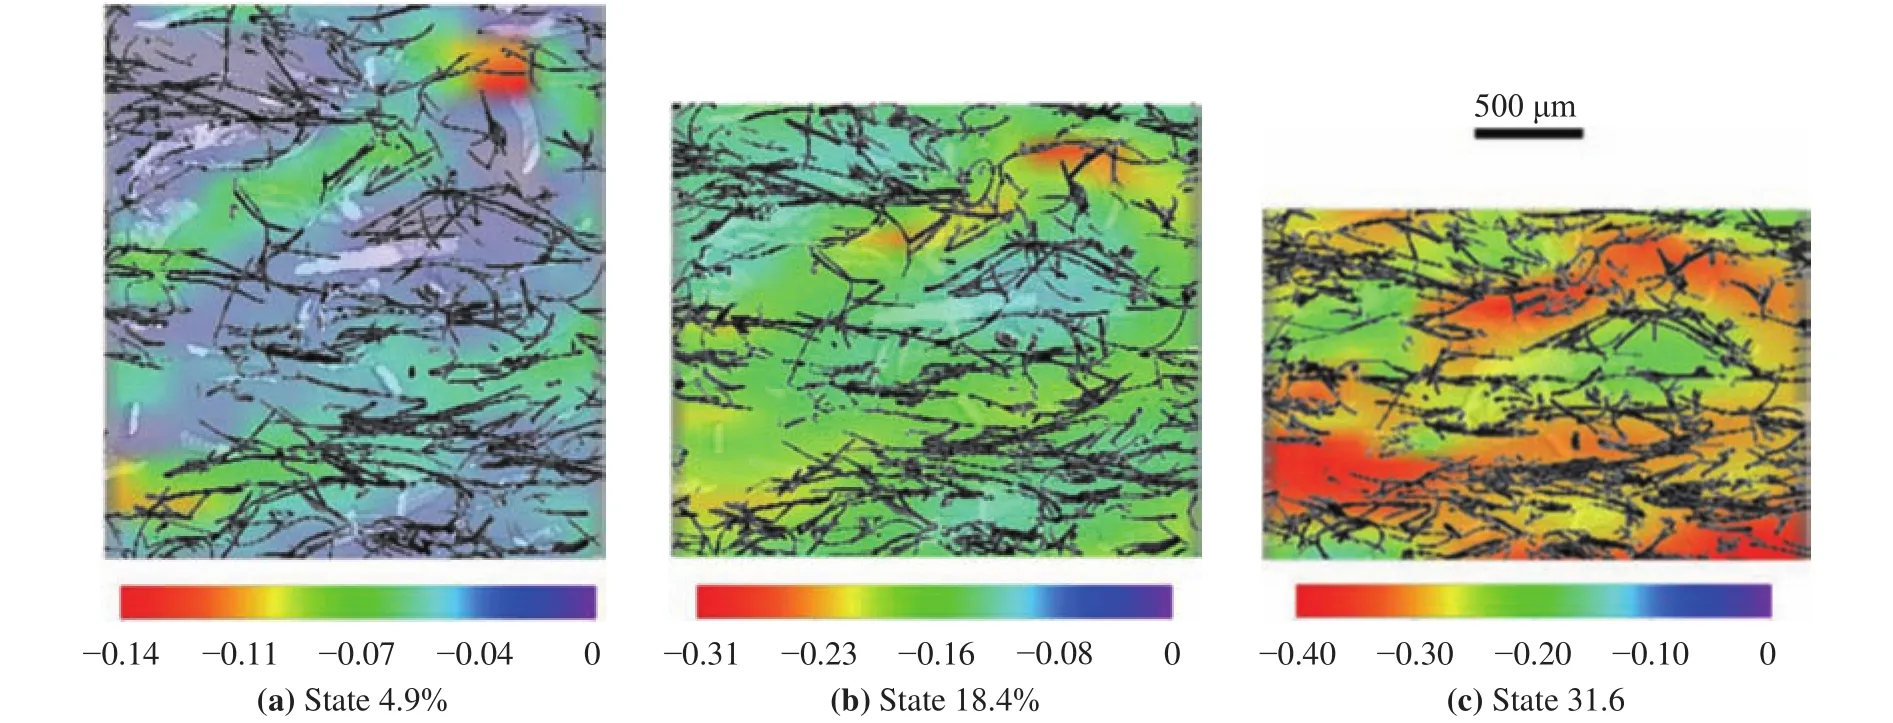
Fig. 7. Superposition of microstructure with strain field parallel to the compression axis [39].
The damage processes, such as crack initiation and expansion in composite material, differ from that of the homogeneous material because of various components in the complex microstructure. The microstructural morphology around the crack tip importantly affects the propagation of the crack. For example,the stress concentration at the crack tip causes some microstructures in front of the crack to undergo specific phase changes, defects, and other damage types. The crack rear may also assume fiber bridging and other shielding mechanisms against crack growth. These processes cannot be described in macroscopic experiments or general 2D structure observation methods. To describe the interaction between the internal cracks of the composite and the evolution of the real structure, one must rely on quantitatively measuring the internal deformation measurement. Extracting the key parameters, including SIFs and crack opening displacements (CODs), of material failure by DVC around the crack front in the static, quasi-static, and fatigue states is discussed in the following section.
2.3.1 Static and quasi-static cracks
Fracture observations are generally limited to the sample surface, but fracture processes almost always initially occur inside the material. In certain cases, the plane–stress and plane–strain theories are not relevant to reality [43]. XCT provides information on the internal material microstructures during loading. The data include crack detection, COD, and crack-tip stress/strain state. This information can be used to illustrate the phenomena that occur in the crack propagation process [44-48]. XCT combined with DVC can measure the 3D displacement field of a material during loading [49]. Through this strategy, the 3D crack initiation and propagation behavior of ductile, brittle, and quasi-brittle materials may be investigated.
The fracture toughness of ductile materials is a key design parameter for reducing the structural weight of transport applications. To further understand the ductile crack, Morgeneyer et al. [50] conducted an aluminum alloy test and measured the displacement fields during crack initiation through a global DVC technique. The calculated strain fields showed the strain concentration near the notch tip.
Understanding the indentation cracking of hard brittle materials, such as structural ceramics [51,52], is important. To directly observe the damage and deformation process within the material, Mostafavi et al. [51] in situ measured the crack opening displacements in alumina under load. The deformation analysis of brittle Al2O3revealed that the radial cracks caused by indentation can be detected and quantified even if cracks cannot be analyzed by tomography. Then, the shape and orientation of the sub-surface cracks caused by indentation were studied with the aid of the displacement fields at the loading and unloading states (Fig. 8) [52]. The radial cracks exhibited a mixed-mode open displacement, which was affected by the residual stress relaxation from lateral cracking. The slow crack growth behavior of porous brittle ceramics can be studied by triaxial compression tests on argillaceous rock specimens. Accordingly, Lenoir et al.[53] obtained full-field incremental strain measurements.Through this process, the onset of shear strain localization was detected and the development was characterized in a 3D complex pattern. For the in situ double-torsion (DT) test, Leplay et al. [54] measured full 3D displacement fields to characterize the slow crack growth mechanism and identified the evolution of the crack front during the propagation. The small pores between the fiber tows that were not sufficiently large relative to the voxel size were not effectively quantified by XCT [55]. By contrast, DVC of the tomography can measure the 3D deformation behavior in response to the applied loads. The technology thereby detects the cracking and observes the residual deformation in the damaged microstructures.
Quasi-brittle fracture is a prominent feature of non-uniform brittle materials. To understand the 3D fracture mechanism and verify the 3D cohesive crack model, Yang et al. [56] studied the fracture characteristics of concrete. Scholars concluded that damage may be quantified through the variation in volume fractions of racks and voids. Meanwhile, Mostafavi et al. [49] investigated the fracture behavior of a notch crack propagation specimen and measured and mapped the COD via a DVC-measured displacement field. The experimentally calculated COD was consistent with the FE-predicted value. The critical SIF of stable crack propagation along the crack front was also obtained by 3D FE simulation. Gypsum board is a low-density material composed of lightweight plaster core and lined with a paper layer. To determine the mechanical properties of the plate and the study of the plate’s fracture resistance, Bouterf et al. [57] presented a new methodology. This new approach reduced the uncertainty in the measured displacement and strain fields and addressed the integrated DVC based on a library of fields computed by a commercial FE software. Bouterf et al. [58] comprehensively analyzed the standard nail pull test and determined by DVC analysis the different mechanisms of elastic failure mechanism,such as quasi-elastic state, roll coating failure, core compaction,and core failure.
2.3.2 Fatigue crack
Fatigue cracks are essentially 3D problems. High-energy,high-resolution synchrotron radiation X-ray tomography (SRCT)allows the in situ and continuous monitoring of the details of microstructural features and crack propagation inside materials.Along with DVC, this modality offers new possibilities for understanding fracture mechanisms, such as fatigue crack opening/closure [59], ductile crack initiation, and expansion in Al alloy that suffered fatigue pretreatment [60]. 3D image analysis of in situ fatigue cracks showed a strong interaction between the crack and local microstructure [61]. These observations revealed the advantages of 3D tools in studying fracture mechanisms.

Fig. 8. DVC analysis of the deformation: a cross-section of the indenter and indented microstructure and maximum principal strain map and b total displacement near the surface of the loaded sample with crack traces [52].
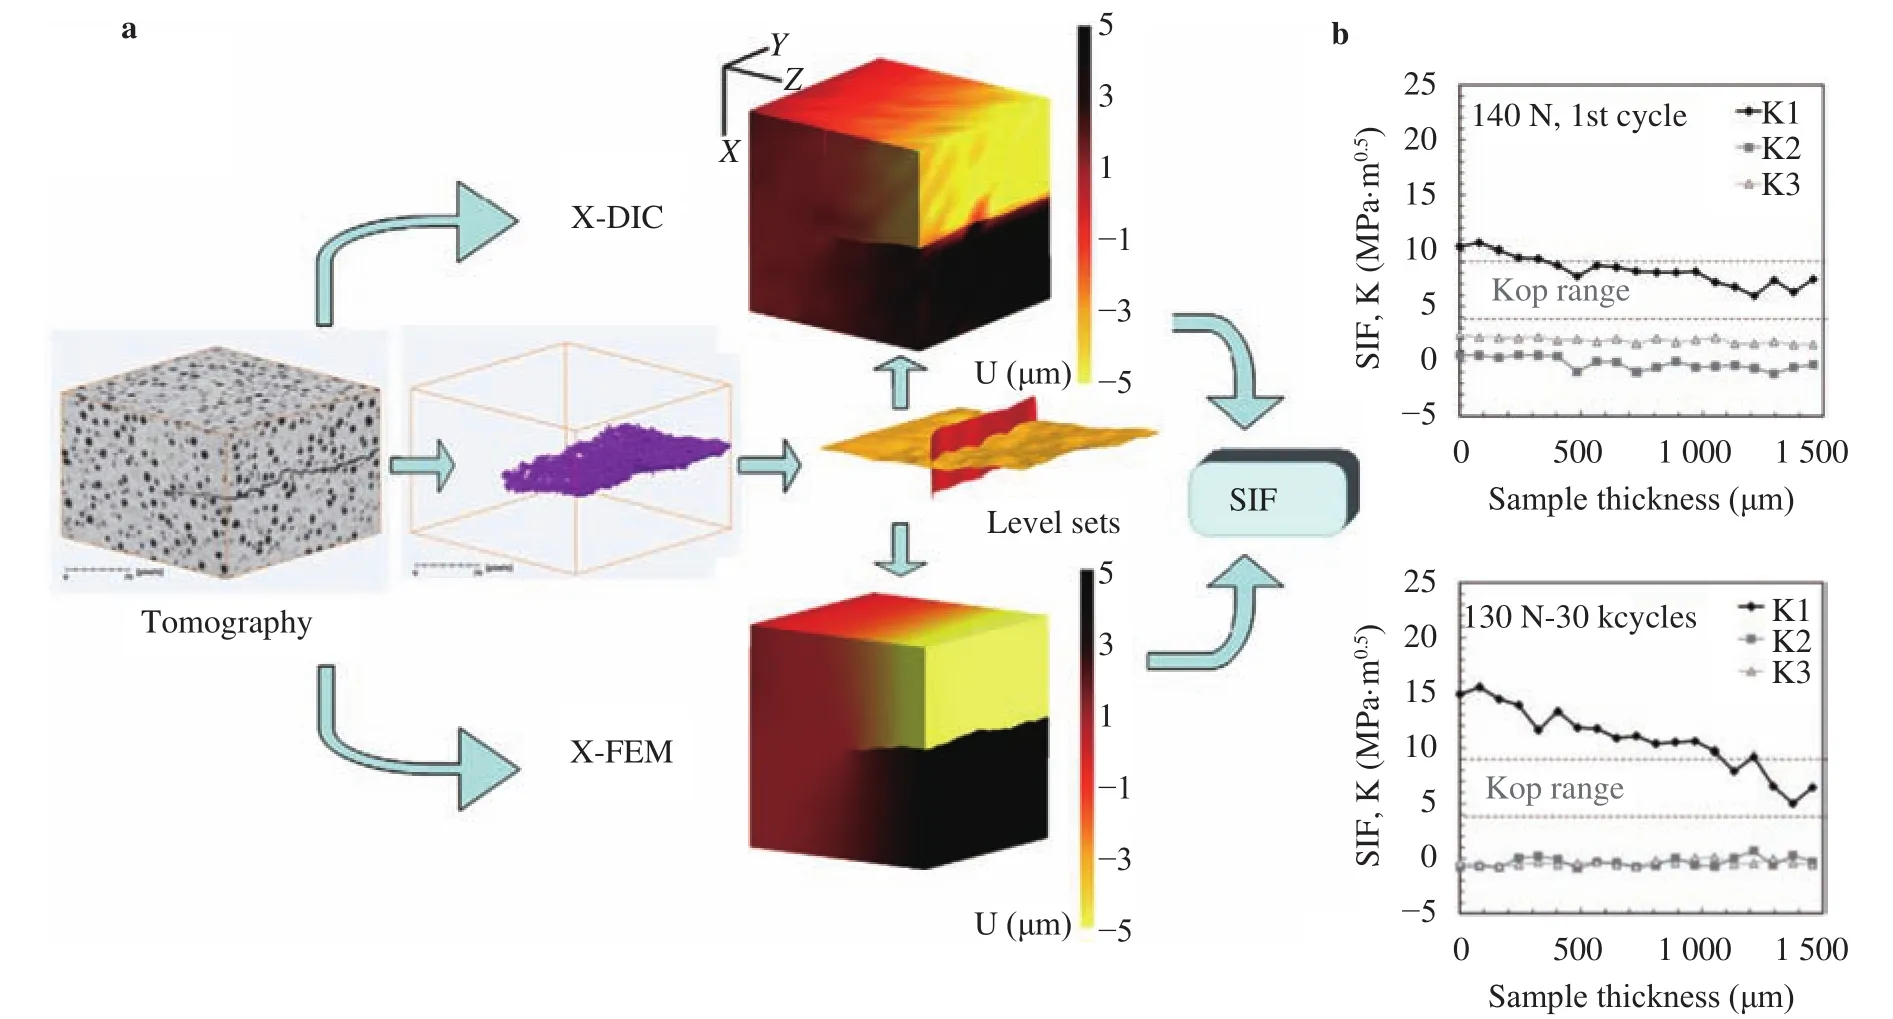
Fig. 9. a Schematic view of the methods for determining SIF [63] and b SIF profiles [66]
The early stages of fatigue crack nucleation can be observed by high-resolution X-ray tomography with synchrotron radiation [62]. Stable short cracks are formed in the stress concentration of the pores and are obstructed due to the blocking of microstructures. Rannou et al. [63] presented a 3D study on fatigue cracks that adopted DVC to measure the 3D displacement field of cast iron and explain the crack displacement discontinuity(Fig. 9). The crack modeling in the elastic material was built via the actual crack geometry and finally estimated the SIF. Réthoré et al. [64-65] measured the displacement fields inside a sample and around the fatigue crack front and then extracted the crack geometry and the SIFs (in modes I, II, and III) along the crack front. These values are highly consistent with numerical simulations (based on the extended FE Method (XFEM)). Limodin et al.[66] implemented a specific program to quantitative analyze the key parameters (CODs and SIFs) directly present around fatigue cracks through the displacement fields obtained from the global DVC. Lachambre et al. [67] introduced an artificial defect at the surface of a small specimen. Then, the group in situ monitored the initiation and growth of a fatigue crack from this defect. Fatigue crack closure [68] was first described by Elber more than 30 years ago. For the 3D propagation of fatigue cracks in nodular cast iron [69], the retrieved positions of the crack front and the detected local crack retardation can be directly analyzed by 3D imaging. The SIFs were extracted from the measured 3D displacement fields and the corresponding local crack growth rate along the front. The non-propagation of a crack may be linked with crack closure in the COD maps or with a local value of the measured SIF range. Aluminum alloy is widely used in the automotive industry because of its good casting and mechanical properties. Dahdah et al. [70,71] analyzed the strain field inhomogeneity of aluminum alloy subjected to low cycle fatigue at high temperature. With the help of 3D microstructural and DVC analyses, the relations of the initiation sites and crack path with the local microstructural features were understood. Results showed that the crack initiation was driven by porosity and that the crack propagation, especially that of the micro-cracks in the silicon particles, was correlated with the presence of hard intermetallic phases.
3 Challenges in improving the algorithm and acquiring data
DVC is gaining increasing attention in experimental mechanics, materials research, and biomedical engineering as a new tool for quantitatively measuring 3D internal deformation in materials or tissues [72]. However, the practical implementation of DVC involves significant challenges, such as computational accuracy and efficiency, as well as data acquisition, which must be targeted in research. Improving the DVC algorithm and developing novel data acquisition methods are the major research challenges. These two aspects in the research on DVC application are discussed as follows:
(1) The high complexity of the algorithm, large computational grid density, and the high computational cost create great difficulties for code writers. However, there is still a lack of detailed discussion on both global DVC method and local DVC algorithm compared to the elaborated discussion in the DIC [73-79]. Therefore, the development and application of DVC was limited, especially for measuring displacement fields and strain fields at high resolution [80].
(2) Another important problem is the acquisition of high-resolution 3D experimental data. The DVC calculation results are the average displacement of a sub-set DVC. Refined calculation demands a sub-set size decrease, which requires an improved spatial resolution, but also increases the uncertainty of the displacement fields [81].
3.1 Optimizing the DVC algorithm
An important problem in implementing DVC is the large amount of computational costs associated with large data amounts. This issue hinders the application of the technology,particularly, for high-resolution displacement and strain measurements. The current main solution is augmenting the calculation speed and accuracy by improving the algorithm [82], parallel computing [83], and other methods that are limited by the existing computing power. Until computing hardware are developed sufficiently in the future to overcome this problem, optimizing the algorithm will remain as the research emphasis.
To improve the calculation accuracy and overall performance of strain field measurement, scholars introduced the rotational degrees of freedom and rigid body displacement into the DVC [84-86]. For the random error and low precision of the calculated displacement fields, researchers used different interpolation methods, such as three-linear interpolation [83], cubic spline interpolation [87], and B-spline interpolation [88] to solve these problems and obtain a 3D internal displacement field with voxel accuracy [89] and sub-voxel accuracy [72]. Adam et al. [90]discussed various options for optimizing granular materials,generating patterns, and acquiring data. Gates et al. [91] proposed a method based on parallel framework to improve the resolution and accuracy of strain results (Fig. 10). The adaptive parameters based on the displacement gradient norm was proposed to explore the adaptive refinement of sub-set size selection [92]. The proposed new algorithm can reduce the required number of projection data by 1/6 [93], or even by several orders of magnitude [94], with a satisfactory reconstructed image with respect to that of the traditional algorithm. Bar-Kochba et al. [95]proposed a fast iterative DVC algorithm for solving the calculation of large nonlinear finite deformation. To significantly re-duce computational complexity, Pan et al. [72] presented a leastsquares framework for measuring 3D internal displacement field and strain field. To accelerate the DVC algorithm, 3D summation table scheme [9, 96], fast Fourier transform [97], and Fourier decomposition [98] of the parallel computing method were achieved. Given the complexity of the internal deformation of a material, software and hardware must be substantially enhanced to improve algorithm accuracy and efficiency and obtain results consistent with true material deformation.
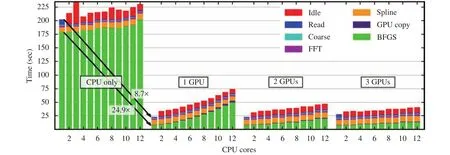
Fig. 10. Time for one process of weak scaling experiment with static scheduling. Changes in time with more processes are therefore due to resource contention and parallel overhead [91].
3.2 Acquiring high-resolution and time-resolved data
Acquiring high-solution and time-resolved 3D data in multifield complex environments is crucial to the DVC method. The complex environments refers to the various influence applied to materials, including external loads and high-temperature. The deformation of materials in the complex environments always presents a dynamic feature, such as the growth of fatigue crack[99,100] or the creep damage at high-temperature [101,102]. The DVC has been rarely used in these cases because of the difficulty in obtaining internal 3D microstructure information at high spatial and temporal resolution under complex environments.
Among internal microstructural characterization methods,such as MRI, CM, and XCT/SRCT, the resolution and penetration ability, as well as the application field, all differ. MRI and CM are mainly used in biomedical fields and soft material research. Given its high energy and high resolution, SRCT is the first choice for most kinds of materials research. The SRCT technique is able to provide 3D structural information for materials with a spatial resolution of sub-micrometers or at a short timescales of milliseconds [103]. In particular, this technology is capable of being used in complex environments. For a common mechanical loading environment, the SRCT can characterize the microstructural evolution of metal materials and composites.The microstructural evolution involves the initiation and coalescence of porosities [104], inter-granular crack nucleation and growth [105]. For 3D observations inside materials in extreme environments, Gupta et al. [106] characterized the creep cavitation behavior of martensitic steel in the stress range of 120-150 MPa by using the SRCT with a resolution of 1 μm. Bale et al. [107]investigated the crack growth of ceramic matrix composites under load at high temperatures. The spatial resolution of SRCT used in this research was 0.65 μm/voxel. In China, we have done some researches on the material properties by using the SRCT with a spatial resolution ranging from 6 μm/pixel to 0.16 μm/pixel and a temporal resolution of 0.5 s. The interaction mechanisms between microwave and matter in Ti-SiO2with a resolution of 3.7 μm/pixel was examined [108]. The evolution of titanium powder at high temperature was investigated with a resolution of 0.74 μm/pixel [109]. By using an in situ high-speed SRCT, the mechanism of local-plasma-induced rapid microstructure evolution was proposed [110]. Meanwhile, the fractures in short carbon fiber/epoxy composites with high-resolution (0.7 μm/pixel) was observed [111,112]. Recently, 3D strain field analysis of fiber-reinforced composite was achieved with a higher resolution (0.16 μm/pixel). The above-mentioned discussion of SRCT showed great hope for diagnosing various microstructure evolution types, such as, fracture [113], micro-cracks[114], and fatigue cracks [115], in a multi-field coupling environment with high-resolution.
4 Summary and Perspectives
This paper reviewed the applications of DVC in material deformation, damage, and crack propagation. The DVC method provides a powerful means to quantitatively study the internal deformation and damage process of materials. Firstly, DVC is an effective tool in tracking the movement of target object, including grain, cell and implant, and electrode materials. Secondly,DVC provide a reliable solution for strain field characterization of high-performance materials, such as fiber-reinforced composites, porous materials, particle reinforcement materials, and lightweight alloy materials. Thirdly, DVC is a promising tool in characterization of behaviors in crack-tip zone for static, quasistatic and fatigue crack. Furthermore, the improvement of the DVC method and the acquisition of 3D data were discussed. The emergence of the DVC method enables to solve the problems of microstructural deformation and crack initiation and expansion in new high-performance materials.
With the recent development of DVC in mechanics field,higher requirements are put forward in the accuracy and efficiency of DVC. To meet these needs, algorithms must be improved and data acquisition methods must be advanced. SRCT has been proved to be an effective tool for obtaining precise 3D structures for DVC. Up to now, SRCT has been applied in mechanics field effectively and the resolution of SRCT has been improved dramatically [116]. In the future, combining high-precision, high-efficiency DVC algorithms with high-resolution SRCT,research on material internal mechanical behaviors would enter a new stage.
Acknowledgments
This paper was supported by the National Natural Science Foundation of China (11722221, 11272305, and 11472265), the National Key Research and Development Program of China(2017YFA0403800 and 2017YFB0702000) and the Anhui Provincial Natural Science Foundation (1508085MA17).
References
[1]B.K. Bay, T.S. Smith, D.P. Fyhrie, et al., Digital volume correlation: three-dimensional strain mapping using X-ray tomography, Exp. Mech. 39 (1999) 217–226.
[2]C. Franck, S. Hong, S.A. Maskarinec, et al., Three-dimensional full-field measurements of large deformations in soft materials using confocal microscopy and digital volume correlation,Exp. Mech. 47 (2007) 427–438.
[3]A. Benoit, S. Guerard, B. Gillet, et al., 3D analysis from micro-MRI during in situ compression on cancellous bone, J. Biomech. 42 (2009) 2381–2386.
[4]B.C. Roberts, E. Perilli, K.J. Reynolds, Application of the digital volume correlation technique for the measurement of displacement and strain fields in bone: A literature review, J. biomech. 47 (2014) 923–934.
[5]T.C Chu, W.F. Ranson, M.A. Sutton, Applications of digital-image-correlation techniques to experimental mechanics, Exp.Mech. 25 (1985) 232–244.
[6]H.A Bruck, S.R. McNeill, M.A. Sutton, et al., Digital image correlation using Newton-Raphson method of partial differential correction, Exp. Mech. 29 (1989) 261–267.
[7]F. Hild,S. Roux, Digital image correlation: from displacement measurement to identification of elastic properties–a review,Strain. 42 (2006) 69–80.
[8]B. Pan, K. Qian, H. Xie, et al., Two-dimensional digital image correlation for in-plane displacement and strain measurement: a review, Meas. Sci. and Technol. 20 (2009) 062001.
[9]J. Huang, X. Pan, S. Li, et al., A digital volume correlation technique for 3-D deformation measurements of soft gels, International Journal of Applied Mechanics 03 (2011) 335–354.
[10]A. Hasan, K.A. Alshibli, Experimental assessment of 3D particle-to-particle interaction within sheared sand using synchrotron microtomography, Géotechnique 60 (2010) 369–379.
[11]Z. Hu, Y. Du, H. Luo, et al., Internal deformation measurement and force chain characterization of mason sand under confined compression using incremental digital volume correlation, Exp. Mech. 54 (2014) 1575–1586.
[12]Z. Hu, H. Luo, S.G. Bardenhagen, et al., Internal deformation measurement of polymer bonded sugar in compression by digital volume correlation of in-situ tomography, Exp. Mech. 55(2015) 289–300.
[13]S. Peth, J. Nellesen, G. Fischer, et al., Non-invasive 3D analysis of local soil deformation under mechanical and hydraulic stresses by μCT and digital image correlation, Soil Tillage Res.111 (2010) 3–18.
[14]S.D. Keyes, F. Gillard, N. Soper, et al., Mapping soil deformation around plant roots using in vivo 4D X-ray computed tomography and digital volume correlation, J. Biomech. 49(2016) 1802–1811.
[15]S.A. McDonald, P.J. Withers, Combining X-ray microtomography and three-dimensional digital volume correlation to track microstructure evolution during sintering of copper powder, J. Strain Anal. Eng. 49 (2014) 257–269.
[16]B. Cai, S. Karagadde, L. Yuan, et al., In situ synchrotron tomographic quantification of granular and intragranular deformation during semi-solid compression of an equiaxed dendritic Al–Cu alloy, Acta Mater. 76 (2014) 371–380.
[17]H.J. Kwon, B. Zhao, P.N.P. Rao, Application of digital volume correlation algorithm to cell mechanics, ASME International Mechanical Engineering Congress and Exposition 11 (2009)365–371.
[18]S. Wentzell, R.S. Nesbitt, J. Macione, et al., Measurement of lacunar bone strains and crack formation during tensile loading by digital volume correlation of second harmonic generation images, J. Mech. Behav. Biomed. 60 (2016) 148–156.
[19]S.A. Maskarinec, C. Franck, D.A. Tirrell, et al., Quantifying cellular traction forces in three dimensions, P. Natl. Acad. Sci.USA. 106 (2009) 22108–22113.
[20]C. Sukjamsri, D.M. Geraldes, T. Gregory, et al., Digital volume correlation and micro-CT: An in-vitro technique for measuring full-field interface micromotion around polyethylene implants, J. Biomech. 48 (2015) 3447–3454.
[21]K. Madi, G. Tozzi, Q.H. Zhang, et al., Computation of full-field displacements in a scaffold implant using digital volume correlation and finite element analysis, Med. Eng. Phys. 35 (2013)1298–1312.
[22]D.S. Eastwood, V. Yufit, J. Gelb, et al., Lithiation-induced dilation mapping in a lithium-ion battery electrode by 3D X-ray microscopy and digital volume correlation, Adv. Energy Mater. 4 (2014) 1300506.
[23]D.P. Finegan, E. Tudisco, M. Scheel, et al., Quantifying bulk electrode strain and material displacement within lithium batteries via high-speed operando tomography and digital volume correlation, Adv. Sci. 3 (2016) 1500332.
[24]J.M. Paz-Garcia, O.O. Taiwo, E. Tudisco, et al., 4D analysis of the microstructural evolution of Si-based electrodes during lithiation: Time-lapse X-ray imaging and digital volume correlation, J. Power Sources. 320 (2016) 196–203.
[25]V. Danesi, G. Tozzi, L. Cristofolini, Application of digital volume correlation to study the efficacy of prophylactic vertebral augmentation, Clin. Biomech. 39 (2016) 14–24.
[26]B.K. Bay, Experimental measurement of three-dimensional continuum-level strain fields in trabecular bone, Advances in Experimental Medicine and Biology. 496 (2001) 181–197.
[27]R. Zauel, Y.N. Yeni, B.K. Bay, Comparison of the linear finite element prediction of deformation and strain of human cancellous bone to 3D digital volume correlation measurements,J. Biomech. Eng.-T Asme. 128 (2005) 1.
[28]I. Jandejsek, O. Jiroušek, D. Vavřík, Precise strain measurement in complex materials using digital volumetric correlation and time lapse micro-CT data, Proc. Eng. 10 (2011)1730–1735.
[29]M.L. Zhu, Q.H. Zhang, C. Lupton, et al., Spatial resolution and measurement uncertainty of strains in bone and bone-cement interface using digital volume correlation, J. Mech. Behav. Biomed. 57 (2016) 269–279.
[30]A.I. Hussein, P.E. Barbone, E.F. Morgan, Digital volume correlation for study of the mechanics of whole bones, Proc.IUTAM. 4 (2012) 116–125.
[31]F. Gillard, R. Boardman, M. Mavrogordato, et al., The application of digital volume correlation (DVC) to study the microstructural behaviour of trabecular bone during compression, J.Mech. Behav. Biomed. 29 (2014) 480–499.
[32]M. Palanca, L. Cristofolini, E. Dall'Ara, et al., Digital volume correlation can be used to estimate local strains in natural and augmented vertebrae: An organ-level study, J. Biomech. 49(2016) 3882–3890.
[33]S. Roux, F. Hild, P. Viot, et al., Three-dimensional image correlation from X-ray computed tomography of solid foam,Compos. Part A: Appl. S. 39 (2008) 1253–1265.
[34]F. Pierron, S.A. McDonald, D. Hollis, et al., Comparison of the mechanical behaviour of standard and auxetic foams by X-ray computed tomography and digital volume correlation, Strain.49 (2013) 467–482.
[35]A. Moussawi, J. Xu, H. Nouri, et al., Volume digital image correlation to assess displacement field in compression loaded bread crumb under X-ray microtomography, Innov. Food Sci.EmerTechnologies g. 25 (2014) 78–87.
[36]T. Taillandier-Thomas, S. Roux, T.F. Morgeneyer, et al., Localized strain field measurement on laminography data with mechanical regularization, Nuc. Instrum. Meth. Phys. Res. B.324 (2014) 70–79.
[37]T.F. Morgeneyer, T. Taillandier-Thomas, L. Helfen, et al., In situ 3-D observation of early strain localization during failure of thin Al alloy (2198) sheet, Acta Mater. 69 (2014) 78–91.
[38]M. Mostafavi, D.M. Collins, B. Cai, et al., Yield behavior beneath hardness indentations in ductile metals measured by three-dimensional computed X-ray tomography and digital volume correlation, Acta Mater. 82 (2015) 468–482.
[39]H. Tran, P. Doumalin, C. Delisee, et al., 3D mechanical analysis of low-density wood-based fiberboards by X-ray microcomputed tomography and Digital Volume Correlation, J. Materi.Sci. 48 (2013) 3198–3212.
[40]F. Forsberg, M. Sjödahl, R. Mooser, et al. , Full three-dimensional strain measurements on wood exposed to three-point bending: analysis by use of digital volume correlation applied to synchrotron radiation micro-computed tomography image data, Strain. 46 (2010) 47–60.
[41]R. Brault, A. Germaneau, J.C. Dupré, et al., In-situ analysis of laminated composite materials by X-ray micro-computed tomography and digital volume correlation, Exp. Mech. 53(2013) 1143–1151.
[42]P. Lecomte-Grosbras, J. Réthoré, N. Limodin, et al., Three-dimensional investigation of free-edge effects in laminate composites using X-ray tomography and digital volume correlation, Exp. Mech. 55 (2015) 301–311.
[43]Y. Barranger, P. Doumalin, J.C. Dupré, et al., X-ray computed tomography coupled to Digital Volume Correlation applied to a stationary crack case, EPJ Web of Conf. 6 (2010) 42015.
[44]P. Isaksson, P.J.J. Dumont, S. Rolland du Roscoat, Crack growth in planar elastic fiber materials, Int. J. Solids Struct. 49(2012) 1900–1907.
[45]J.Y. Buffière, E. Maire, P. Cloetens, et al. , Characterization of internal damage in a MMC p using X-ray synchrotron phase contrast microtomography, Acta mater. 47 (1999) 1613–1625.
[46]P.J. Withers, J. Bennett, Y.C. Hung, et al., Crack opening displacements during fatigue crack growth in Ti–SiC fibre metal matrix composites by X-ray tomography, Mater. Sci. Tech-Lond. 22 (2013) 1052–1058.
[47]A. Hodgkins, T.J. Marrow, P. Mummery, et al., X-ray tomography observation of crack propagation in nuclear graphite,Mater. Sci. Tech-Lond. 22 (2013) 1045–1051.
[48]H. Toda, E. Maire, S. Yamauchi, et al., In situ observation of ductile fracture using X-ray tomography technique, Acta Mater. 59 (2011) 1995–2008.
[49]M. Mostafavi, S.A. McDonald, P.M. Mummery, et al., Observation and quantification of three-dimensional crack propagation in poly-granular graphite, Eng. Fract. Mech. 110 (2013)410–420.
[50]T.F. Morgeneyer, L. Helfen, H. Mubarak, et al., 3D digital volume correlation of synchrotron radiation laminography images of ductile crack initiation: an initial feasibility study,Exp. Mech. 53 (2013) 543–556.
[51]M. Mostafavi, Y. Vertyagina, C. Reinhard, et al., 3D studies of indentation by combined X-ray tomography and digital volume correlation, Key Eng. Mater. 592 (2014) 14–21.
[52]Y. Vertyagina, M. Mostafavi, C. Reinhard, et al., In situ quantitative three-dimensional characterisation of sub-indentation cracking in polycrystalline alumina, J. Eur. Ceram. Soc. 34(2014) 3127–3132.
[53]N. Lenoir, M. Bornert, J. Desrues, et al. , Volumetric digital image correlation applied to X-ray microtomography images from triaxial compression tests on argillaceous rock, Strain. 43(2007) 193–205.
[54]P. Leplay, J. Réthoré, S. Meille, et al., Three-dimensional analysis of an in situ double-torsion test by X-ray computed tomography and digital volume correlation, Exp. Mech. 53 (2013)1265–1275.
[55]L. Saucedo-Mora, T. Lowe, S. Zhao, et al. , In situ observation of mechanical damage within a SiC-SiC ceramic matrix composite, J. Nucl. Mater. 481 (2016) 13–23.
[56]Z. Yang, W. Ren, M. Mostafavi, et al. Characterisation of 3D fracture evolution in concrete using in-situ X-ray computed tomography testing and digital volume correlation, in: VIII International Conference on Fracture Mechanics of Concrete and Concrete Structures. (2013) 1-7.
[57]A. Bouterf, S. Roux, F. Hild, et al., Digital Volume Correlation Applied to X-ray Tomography Images from Spherical Indentation Tests on Lightweight Gypsum, Strain 50 (2014) 444–453.
[58]A. Bouterf, J. Adrien, E. Maire, et al., Failure mechanisms of plasterboard in nail pull test determined by X-ray microtomography and digital volume correlation, Exp. Mech. 56 (2016)1427–1437.
[59]H. Toda, A 3D measurement procedure for internal local crack driving forces via synchrotron X-ray microtomography, Acta Mater. 52 (2004) 1305–1317.
[60]Y. Shen, T.F. Morgeneyer, J. Garnier, et al., Three-dimensional quantitative in situ study of crack initiation and propagation in AA6061 aluminum alloy sheets via synchrotron laminography and finite-element simulations, Acta Mater. 61(2013) 2571–2582.
[61]J., Three dimensional imaging of damage in structural materials using high resolution micro-tomography, Nuc. Instrum.Meth. Phys. Res. B. 238 (2005) 75–82.
[62]T. Marrow, High resolution X-ray tomography of short fatigue crack nucleation in austempered ductile cast iron, Int. J. Fatigue. 26 (2004) 717–725.
[63]J. Rannou, N. Limodin, J. Réthoré, et al., Three dimensional experimental and numerical multiscale analysis of a fatigue crack, Comput. Method. Appl. M. 199 (2010) 1307–1325.
[64]J. Rethore, N. Limodin, J.Y. Buffiere, et al., Digital volume correlation analyses of synchrotron tomographic images, J. Strain Anal. Eng. Des. 46 (2011) 683–695.
[65]J. Réthoré, N. Limodin, J.-Y. Buffière, et al., Three-dimensional analysis of fatigue crack propagation using X-ray tomography digital volume correlation and extended finite element simulations, Proc. IUTAM. 4 (2012) 151–158.
[66]N. Limodin, J. Réthoré, J.-Y. Buffière, et al., 3D X-ray microtomography volume correlation to study fatigue crack growth,Adv. Eng. Mater. 13 (2011) 186–193.
[67]J. Lachambre, J. Réthoré, A. Weck, et al., Extraction of stress intensity factors for 3D small fatigue cracks using digital volume correlation and X-ray tomography, Int. J. Fatigue. 71(2015) 3–10.
[68]N. Limodin, J. Réthoré, J.-Y. Buffière, et al., Crack closure and stress intensity factor measurements in nodular graphite cast iron using three-dimensional correlation of laboratory X-ray microtomography images, Acta Mater. 57 (2009) 4090–4101.
[69]N. Limodin, J. Réthoré, J.-Y. Buffière, et al., Influence of closure on the 3D propagation of fatigue cracks in a nodular cast iron investigated by X-ray tomography and 3D volume correlation, Acta Mater. 58 (2010) 2957–2967.
[70]N. Dahdah, N. Limodin, A. El Bartali, et al., Damage investigation in A319 aluminium alloy by X-ray tomography and digital volume correlation during in situ high-temperature fatigue tests, Strain. 52 (2016) 324–335.
[71]N. Dahdah, N. Limodin, A.E. Bartali, et al., Influence of the casting process in high temperature fatigue of A319 aluminium alloy investigated by in-situ X-ray tomography and digital volume correlation, Procedia Struct. Integrity. 2 (2016)3057–3064.
[72]B. Pan, D. Wu, Z. Wang, Internal displacement and strain measurement using digital volume correlation: a least-squares framework, Meas. Sci. Technol. 23 (2012) 045002.
[73]B. Pan, B. Wang, G. Lubineau, et al., Comparison of subsetbased local and finite element-based global digital image correlation, Exp. Mech. 55 (2015) 887–901.
[74]Y. Huang, Y.G. Bu, L.D. Zhou, et al., Fatigue crack growth and propagation along the adhesive interface between fiber-reinforced composites, Eng. Fract. Mech. 110 (2013) 290–299.
[75]X. Wang, S.P. Ma, Mesh-Based Digital Image Correlation Method Using Non-Uniform Elements for Measuring Displacement Fields with High Gradient, Exp. Mech. 54 (2014)1545–1554.
[76]Y.L. Cai, S.L. Yang, Y.H. Wang, et al., Characterization of the deformation behaviors associated with the serrated flow of a 5456 Al-based alloy using two orthogonal digital image correlation systems, Mat. Sci. Eng. A-Struct. 664 (2016) 155–164.
[77]Y. Su, Q.C. Zhang, X.H. Xu, et al., Quality assessment of speckle patterns for DIC by consideration of both systematic errors and random errors, Opt. Laser. Eng. 86 (2016) 132–142.
[78]X.H. Xu, Y. Su, Q.C. Zhang, Theoretical estimation of systematic errors in local deformation measurements using digital image correlation. Opt. Laser. Eng. 88 (2017)265-279.
[79]Y., High-accuracy and real-time 3D positioning. tracking system for medical imaging applications based on 3D digital image correlation, Opt. Laser. Eng. 88 (2017) 82–90.
[80]S. Roux, T. Taillandier-Thomas, A. Bouterf, et al. Digital volume correlation from tomographic images: Results and challenges, IUTAM Symposium on Advances of Optical Methods in Experimental Mechanics. 2012.
[81]H. Leclerc, J.-N. Périé, F. Hild, et al., Digital volume correlation: what are the limits to the spatial resolution?, Mech. Ind.13 (2012) 361–371.
[82]B. Pan, B. Wang, D. Wu, et al., An efficient and accurate 3D displacements tracking strategy for digital volume correlation,Opt. Laser. Eng. 58 (2014) 126–135.
[83]M. Gates, J. Lambros, M.T. Heath, Towards high performance digital volume correlation, Exp. Mech. 51 (2011) 491–507.
[84]T.S. Smith, B.K. Bay, M.M. Rashid, Digital volume correlation including rotational degrees of freedom during minimization,Exp. Mech. 42 (2002) 272–278.
[85]H. Jin, W.Y. Lu, J.W. Foulk, et al. 3D deformation field throughout the interior of materials, Sandia National Laboratories (SNL-CA), Livermore, CA (United States), 2013.
[86]K. Wan, P. Yang, Expanded digital volume correlation for ex situ applications, Meas. Sci. Technol. 26 (2015) 095605.
[87]A. Germaneau, P. Doumalin, J.C. Dupré. Improvement of accuracy of strain measurement by Digital Volume Correlation for transparent materials, Proceedings of photomechanics 2006. France: Clermont Ferrand; 2006.
[88]M. Ren, J. Liang, B. Wei, Accurate B-spline-based 3-D interpolation scheme for digital volume correlation, Rev. Sci. Instrum. 87 (2016) 125114.
[89]H. Leclerc, J.N. Périé, S. Roux, et al., Voxel-scale digital volume correlation, Exp. Mech. 51 (2011) 479–490.
[90]J. Adam, M. Klinkmüller, G. Schreurs, et al., Quantitative 3D strain analysis in analogue experiments simulating tectonic deformation: Integration of X-ray computed tomography and digital volume correlation techniques, J. Struct. Geol. 55(2013) 127–149.
[91]M. Gates, M.T. Heath, J. Lambros, High-performance hybrid CPU and GPU parallel algorithm for digital volume correlation, Int. J. High Perform. 29 (2015) 92–106.
[92]M. Gates, J. Gonzalez, J. Lambros, et al., Subset refinement for digital volume correlation: numerical and experimental applications, Exp. Mech. 55 (2015) 245–259.
[93]F. Xu, B. Dong, X. Hu, et al., In situ investigation on rapid microstructure evolution in extreme complex environment by developing a new AFBP-TVM sparse tomography algorithm from original CS-XPCMT, Opt. Laser. Eng. 96 (2017) 124–131.
[94]H. Leclerc, S. Roux, F. Hild, Projection savings in CT-based digital volume correlation, Exp. Mech. 55 (2015) 275–287.
[95]E. Bar-Kochba, J. Toyjanova, E. Andrews, et al., A fast iterative digital volume correlation algorithm for large deformations,Exp. Mech. 55 (2015) 261–274.
[96]Z.Z. Wang, S.B. Wang, Z.Y. Wang, An analysis on computational load of DIC based on Newton–Raphson scheme, Opt.Laser Eng. 52 (2014) 61–65.
[97]F. Mortazavi, E. Ghossein, M. Lévesque, et al., High resolution measurement of internal full-field displacements and strains using global spectral digital volume correlation, Opt. Laser.Eng. 55 (2014) 44–52.
[98]T. Wang, Z. Jiang, Q. Kemao, et al., GPU accelerated digital volume correlation, Exp. Mech. 56 (2016) 297–309.
[99]R.O. Ritchie, Mechanisms of fatigue-crack propagation in ductile and brittle solids, Int. J. Fract. 100 (1999) 55–83.
[100]K.H. Khor, J.Y. Buffiére, W. Ludwig, et al., In situ high resolution synchrotron x-ray tomography of fatigue crack closure micromechanisms, J. Phy.-Condensed Matter 16 (2004) S3511.
[101]M.E. Kassner, T.A. Hayes. , Creep cavitation in metals, Int. J.Plasticity 19 (2003) 1715–1748.
[102]K. Dzieciol, A. Borbély, F. Sket, et al., Void growth in copper during high-temperature power-law creep, Acta Materialia 59(2011) 671–677.
[103]L. Salvo, P. Cloetens, E. Maire, et al., X-ray micro-tomography an attractive characterisation technique in materials science,Nuc. Instrum. Meth. Phys. Res. B. 200 (2003) 273–286.
[104]L. Babout, W. Ludwig, E. Maire, et al., Damage assessment in metallic structural materials using high resolution synchrotron X-ray tomography, Nuc. Instrum. Meth. Phys. Res. B. 200(2003) 303–307.
[105]T.J. Marrow, L. Babout, B.J. Connolly, et al. High-resolution,in-situ, tomographic observations of stress corrosion cracking,in: S.A. Shipilov, R.H. Jones, J.M. Olive, R.B. Rebak (Eds.), Environment-Induced Cracking of Materials, Elsevier, (2008)439- 447
[106]C. Gupta, H. Toda, C. Schlacher, et al., Study of creep cavitation behavior in tempered martensitic steel using synchrotron micro-tomography and serial sectioning techniques, Mat. Sci.Eng. A-Struct. 564 (2013) 525–538.
[107]H.A. Bale, A. Haboub, A.A. MacDowell, et al., Real-time quantitative imaging of failure events in materials under load at temperatures above 1600 degrees C, Nat. Mater. 12 (2013)40–46.
[108]W.C. Liu, F. Xu, Y.C. Li, et al., Discussion on Microwave-Matter Interaction Mechanisms by In Situ Observation of “Core-Shell” Microstructure during Microwave Sintering, Materials 9(2016) 120.
[109]Y. Xiao, F. Xu, X.F. Hu, et al., In situ investigation of titanium powder microwave sintering by synchrotron radiation computed tomography, Metals 6 (2016) 9.
[110]F. Xu, W. Liu, Y. Xiao, et al., High-speed tomography of localplasma-induced rapid microwave sintering of aluminum, Appl. Phys. Lett. 110 (2017) 101904.
[111]X. Hu, L. Wang, F. Xu, et al., In situ observations of fractures in short carbon fiber/epoxy composites, Carbon. 67 (2014)368–376.
[112]X. Hu, J. Fang, F. Xu, et al., Real internal microstructure based key mechanism analysis on the micro-damage process of short fibre-reinforced composites, Sci. Rep. 6 (2016) 34761.
[113]P.J. Withers, Fracture mechanics by three-dimensional cracktip synchrotron X-ray microscopy, Philos. Trans. R. Soc. A. 373(2015) 20130157.
[114]Y. Luo, S.C. Wu, Y.N. Hu, et al., Cracking evolution behaviors of lightweight materials based on in situ synchrotron X-ray tomography: A review, Front. Mech. Eng. (2018) 1–21.
[115]P.J. Withers, M. Preuss, Fatigue and damage in structural materials studied by X-ray tomography, Annu. Rev. Mater. Res. 42(2012) 81–103.
[116]E. Maire, P.J. Withers, Quantitative X-ray tomography, Int.Mater. Rev. 59 (2014) 1–43.
杂志排行
Theoretical & Applied Mechanics Letters的其它文章
- Graphical Abstract
- Sound absorption characteristic of micro-helix metamaterial by 3D printing
- An analysis of dynamic stability of an elastic column
- Local buckling of thin plate on tensionless elastic foundations under interactive uniaxial compression and shear
- Forced vibration analysis of nano-composite rotating pressurized microbeam reinforced by CNTs based on MCST with temperature-variable material properties
- A new equivalent method to obtain the stoichiometric fuel-air cloud from the inhomogeneous cloud based on FLACS-dispersion
