Numerical investigation of pollution transport and environmental improvement measures in a tidal bay based on a Lagrangian particle-tracking model
2018-05-11EnjinZhoLinMuKeQuBingShiXingyueRenChngJing
En-jin Zho,Lin Mu,Ke Qu*,Bing Shi,Xing-yue Ren,Chng-o Jing
aCollege of Marine Science and Technology,China University of Geosciences,Wuhan 430074,China
bSchool of Hydraulic Engineering,Changsha University of Science and Technology,Changsha 410114,China
cCollege of Engineering,Ocean University of China,Qingdao 266100,China
dCollege of Civil Engineering and Architecture,Hainan University,Haikou 570228,China
1.Introduction
All over the world,many coastal waters have suffered from gradually increasing pollution over the past few decades as a result of excessive effluent discharge and anthropogenic nutrient inputs(Carpenter et al.,1998;Kemp et al.,2005).Especially during the past three decades,the marine environment in the coastal region of China has faced huge amounts of stress from anthropogenic activities and population growth.Many pollutants from land-based sources,such as sewage,oil hydrocarbons,nutrients,pesticides,marine debris,and toxic waste,enter the sea.Of all of these pollutants,the annual discharge amount of the sewage and that of the major toxic materials into the sea water from factories and cities along the coasts of China are over 10 billion tons and 146 million tons,respectively.The increasing environmental pollution significantly threatens the survival and safety of coastal communities.Therefore,studies focusing on the coastal pollution have become extremely urgent and vital to protecting marine ecosystems and ensuring sustainable development of the environment around the coastal region of China.
During the past few decades,many studies have been carried out to analyze oceanic purification capacity.The research results show that water exchange plays a critical role in coastal ecosystem purification(Kraufvelin et al.,2001;Xiao et al.,2015).The self-purification rate of the water will increase if the water exchange rate can be enhanced.In order to quantify the water exchange rate,a residence time theory based on the advection-diffusion process of a tracer has been proposed by Delhez et al.(1999)to evaluate the strength of water exchange.The residence time is an indicator of how long a pollutant will reside in a bay before being forced out of its mouth due either to tidal flowor river discharge. When the water exchange capability is enhanced,the residence time will decrease.Liu et al.(2004)used a dispersion model coupled with the Princeton ocean model to estimate the residence time of the water in Jiaozhou Bay(JZB).The average residence time of JZB water is about 52d.There are also significant differences in the water exchange rate in different parts of the bay.Nevertheless,the residence time is a kind of statistical data that cannot demonstrate the real-time water exchange situation.With the development of research technology,in order to study the pollution process and water exchange capability of the coastal water with an acceptable accuracy,the particle-tracking method has been given more attention recently and used to simulate oil spills(Korotenkoetal.,2004;Peri′a~nez;Pascual-Granged,2008;Wang et al.,2005),radionuclides(NakanoandPovinec,2003;Peri′a~nez;Elliott,2002),and the flow state of pollution in both the bay and the coastal ocean(Li et al.,2014;Murray and Gillibrand,2006;Tilburg et al.,2007).In the study of Gong et al.(2008),the particletracking model driven by hydrodynamic fields was used to investigate the temporal evolution of flushing properties in Xiaohai Lagoon,caused by the influences of human activities and natural evolution.A three-dimensional(3D)hydrodynamic model coupled with a Lagrangian particle-tracking approach developed by Liu et al.(2007)was employed to estimate residence time in the Danshuei River estuarine system of northern Taiwan,and the results demonstrated that density-induced estuarine circulation may play an important role in the estuary.
In this study,a Lagrangian particle-tracking model was used to numerically investigate the coastal pollution transport and water exchange capability in Tangdao Bay,in China.Tangdao Bay is semi-enclosed and elongated.The bay is famous for the beauty of its natural scenery and leisurely walkways,and it has been dubbed by tourists as the“bay in the sea”.Along with the coastal development,its environment has been seriously affected by the coastal polluted water and garbage.Xiao et al.(2011)carried out some experiments using the chemical oxygen demand(COD)method,with the aim of investigating the current pollution level of the seawater in Tangdao Bay and the pollutant exchange correlation between Tandao Bay and JZB.Zhao et al.(2014)established a twodimensional(2D)hydrodynamic simulation model using the software package MIKE21 to study the tidal flow in Tangdao Bay,and their simulation results demonstrated that the seawater exchange capability of Tangdao Bay is very weak.Therefore,studying the hydrodynamic environment in Tangdao Bay,predicting the capacity of seawater exchange,and proposing improvement measures to enhance the purification capability of the coastal water are matters of urgency.In this study,the capacity of seawater exchange was investigated numerically and the environmental improvement measures for Tangdao Bay were put forward.
2.Study area
Tangdao Bay,located at the outskirts of Qingdao City,is situated at the southern end of the Qingdao Economic and Technological Development Zone,in Shandong Province,in the eastern region of China.The study area is a part of Lingshan Bay,which has a width of 23.4 km and a total area of 107 km2.Tangdao Bay is located in the Huangdao District,in Qingdao City,as shown in Fig.1.The measurement positions are located at P1,P2,and P3.The bay has a narrow invertedUshape from the northeast to the southwest,and the mouth of the bay faces the southwest,connecting the Yellow Sea and Tangdao Bay.Its area is about 17 km2,and the length of the coastal line is about 23.9 km.A narrow ditch exists at the bottom of Tangdao Bay,which is about 500 m wide and 2 km long.Tangdao Bay is surrounded by southeastern hills and low mountains.Hence,the wind and waves are weak.The energetic tide is the most dominant factor controlling the hydrodynamic environment of the bay.
3.Methodology
3.1.FVCOM model
The computational system consists of a fully 3D fluid dynamics model and a particle-tracking model,which couple with each other and match in time simultaneously.In the present hybrid system,the released particles flow along with the large-scale background flow predicted by the finite volume coastal ocean model(FVCOM).In FVCOM,the governing equations are discretized using a finite volume method on a triangular mesh in the horizontal plane and a σ-grid in the vertical direction.In both its external and internal modes(Chen et al.,2003),the convection terms are discretized using upwind schemes,and the time derivative terms are discretized by the Runge-Kutta method.
In order to obtain a smooth representation of irregular bottom topography, all equations are transformed into σ coordinates. The σ coordinate transformation expression is written as follows:

Fig.1.Location of Tangdao Bay.

wherezis the elevation of a position in water,ζ is the water surface elevation above the position,Dis the total water column depth,andHis the bottom depth.In the hydrostatic version of the model,the governing equations for the external mode are the averaged continuity and momentum equations in σ coordinates:

where∇his the horizontal derivative,gis gravity acceleration,ρ0is the water density, ζtis the water surface elevation at momentt.In the external mode,τband τsare the shear stress vectors on the seabed and water surface,respectively;V is the depth-averaged velocity vector with V=V(x,y,t);and G includes Coriolis force and water friction force.
The governing equations for the internal mode of the model are the 3D continuity and momentum equations combined with the hydrostatic assumption:
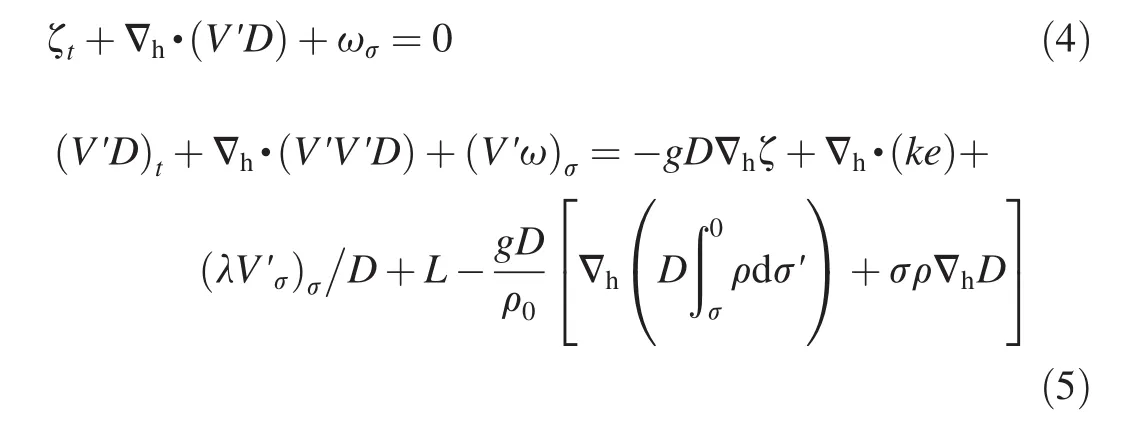
In the internal mode,ρ is the mixture water density considering the salinity change of water body;V'is the horizontal velocity;ω is the vertical velocity in the σ coordinate;eis the strain rate;Lis the fluid dissipation coefficient;andkand λ are coefficients.
3.2.Lagrangian particle-tracking model
In this study,an improved Lagrangian particle-tracking model,which enables continuous particle release,was used to simulate pathways of released particles.It was used to solve a nonlinear system of ordinary differential equations(ODE)as follows:
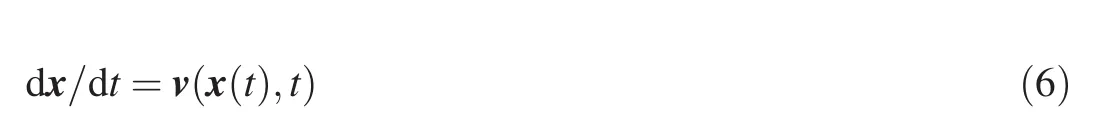
where x is the particle position at timet,dx/dtis the rate of change of the particle position with timet,and v(x(t),t)is the 3D velocity field generated by the model.This equation was solved using the explicit Runge-Kutta multi-step methods for solving coupled sets of nonlinear ODEs,which were derived from solving the discrete integral:

Assuming that xn=x(tn)is the position of a particle at timet=tn,wherenis the serial number of calculation time,then the new position(xn+1=x(tn+1))of this particle at timet=tn+1=tn+Δt,where Δtis the calculation time step,can be determined by the fourth-order four-stage ERK method.
In the 3D(x,y,σ)space,a particle can be tracked by solving the velocity equations in thex,y,and σ directions:

where,u,v,and ω are the velocity components in thex,y,and σ directions,respectively.
Writing ω/(H+ζ)as ϖ,the fourth-stage ERK algorithm can be written as follows:
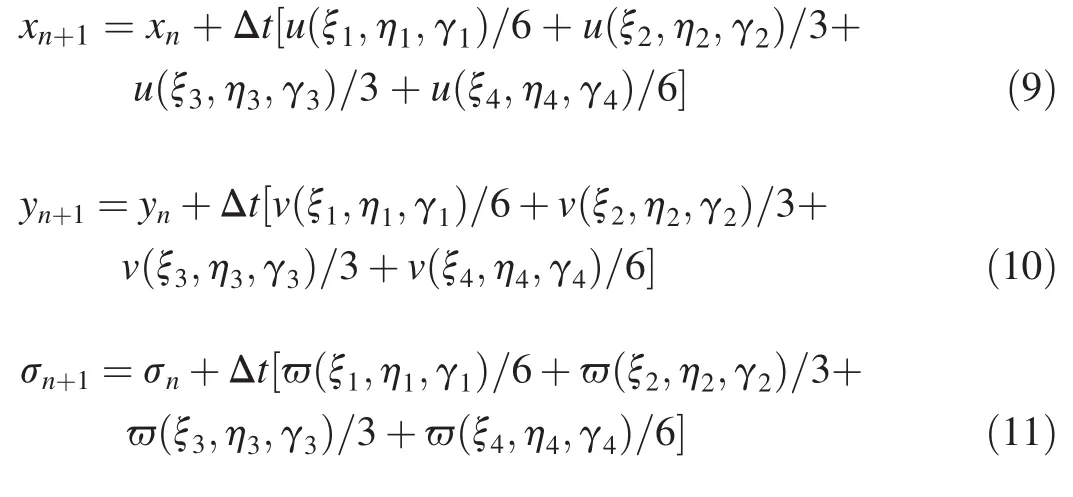
wherexn+1,yn+1,and σn+1are the particle positions in the coordination att=tn+1;ξ1,ξ2,ξ3,and ξ4are the first-order,second-order,third-order,and fourth-order gradients,respectively,from the position atnstep to the position atn+1 step in thexdirection;η1,η2,η3,and η4are the first-order,second-order,third-order,and fourth-order gradients,respectively,from the position atnstep to the position atn+1 step in theydirection;and γ1,γ2,γ3,and γ4are the first-order,second-order,and third-order,and fourth-order gradients,respectively,from the position atnstep to the position atn+1 step in the σ direction.
The details regarding the Lagrangian particle-tracking model of FVCOM can be found in Chen et al.(2006).
4.Model implementation and validation
4.1.Model implementation
In this study,the coastline and ba thy metric data for the coastal sea of Tangdao Bay were obtained from the ocean geographic information database,which is published by the Navigation Guarantee Department of the People's Liberation Army Navy Command;the database system number is CHI12310 and the cover range of the mesh is from the Rushan Mouth,in Weihai City to Qingdao Port.Fig.2 shows the study area in 2D view.Thexandycoordinates are translated from the latitude and longitude,respectively,depending on the global projection.

Fig.2.Schematic of study area in 2D view.

The model mesh consisted of 31857 elements and 16838 mesh nodes,with a minimum resolution of 25 m for the coastal line in the study area.There were eleven sigma levels in the vertical direction.The water level for the ocean open boundary condition was as follows(Wang et al.,2013):where ε(t)is the boundary water level,mis the number of tidal constituents,fjis a nodal factor,ajis an angular frequency,(V0+u)jis the initial phase angle,Mjis an amplitude,pjis a phase lag,andA0is the average height of the sea.Four main harmonic constituents(M2,S2,O1,and K1)attracted from marine atlas were taken into account in this study(Chen,1993).Table 1 shows the comparison between simulated and observed harmonic constituents at P1.The results of observation and simulation agree with each other.
The co-tidal lines for the four harmonic constituents are shown in Fig.3.
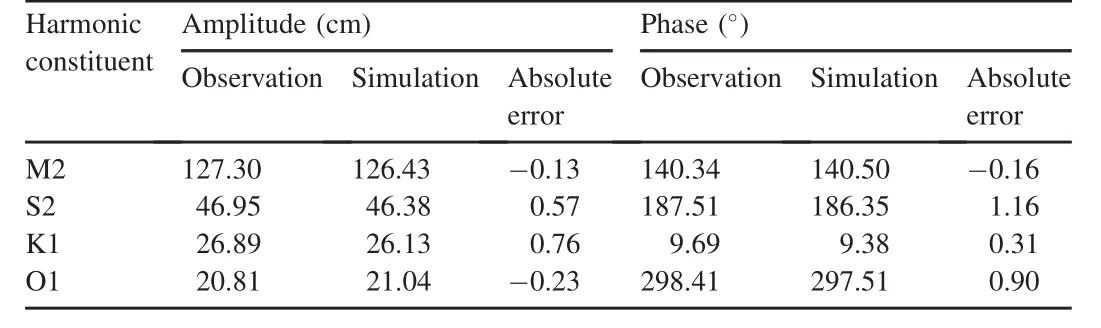
Table 1Comparison between simulated and observed harmonic constituents at P1.
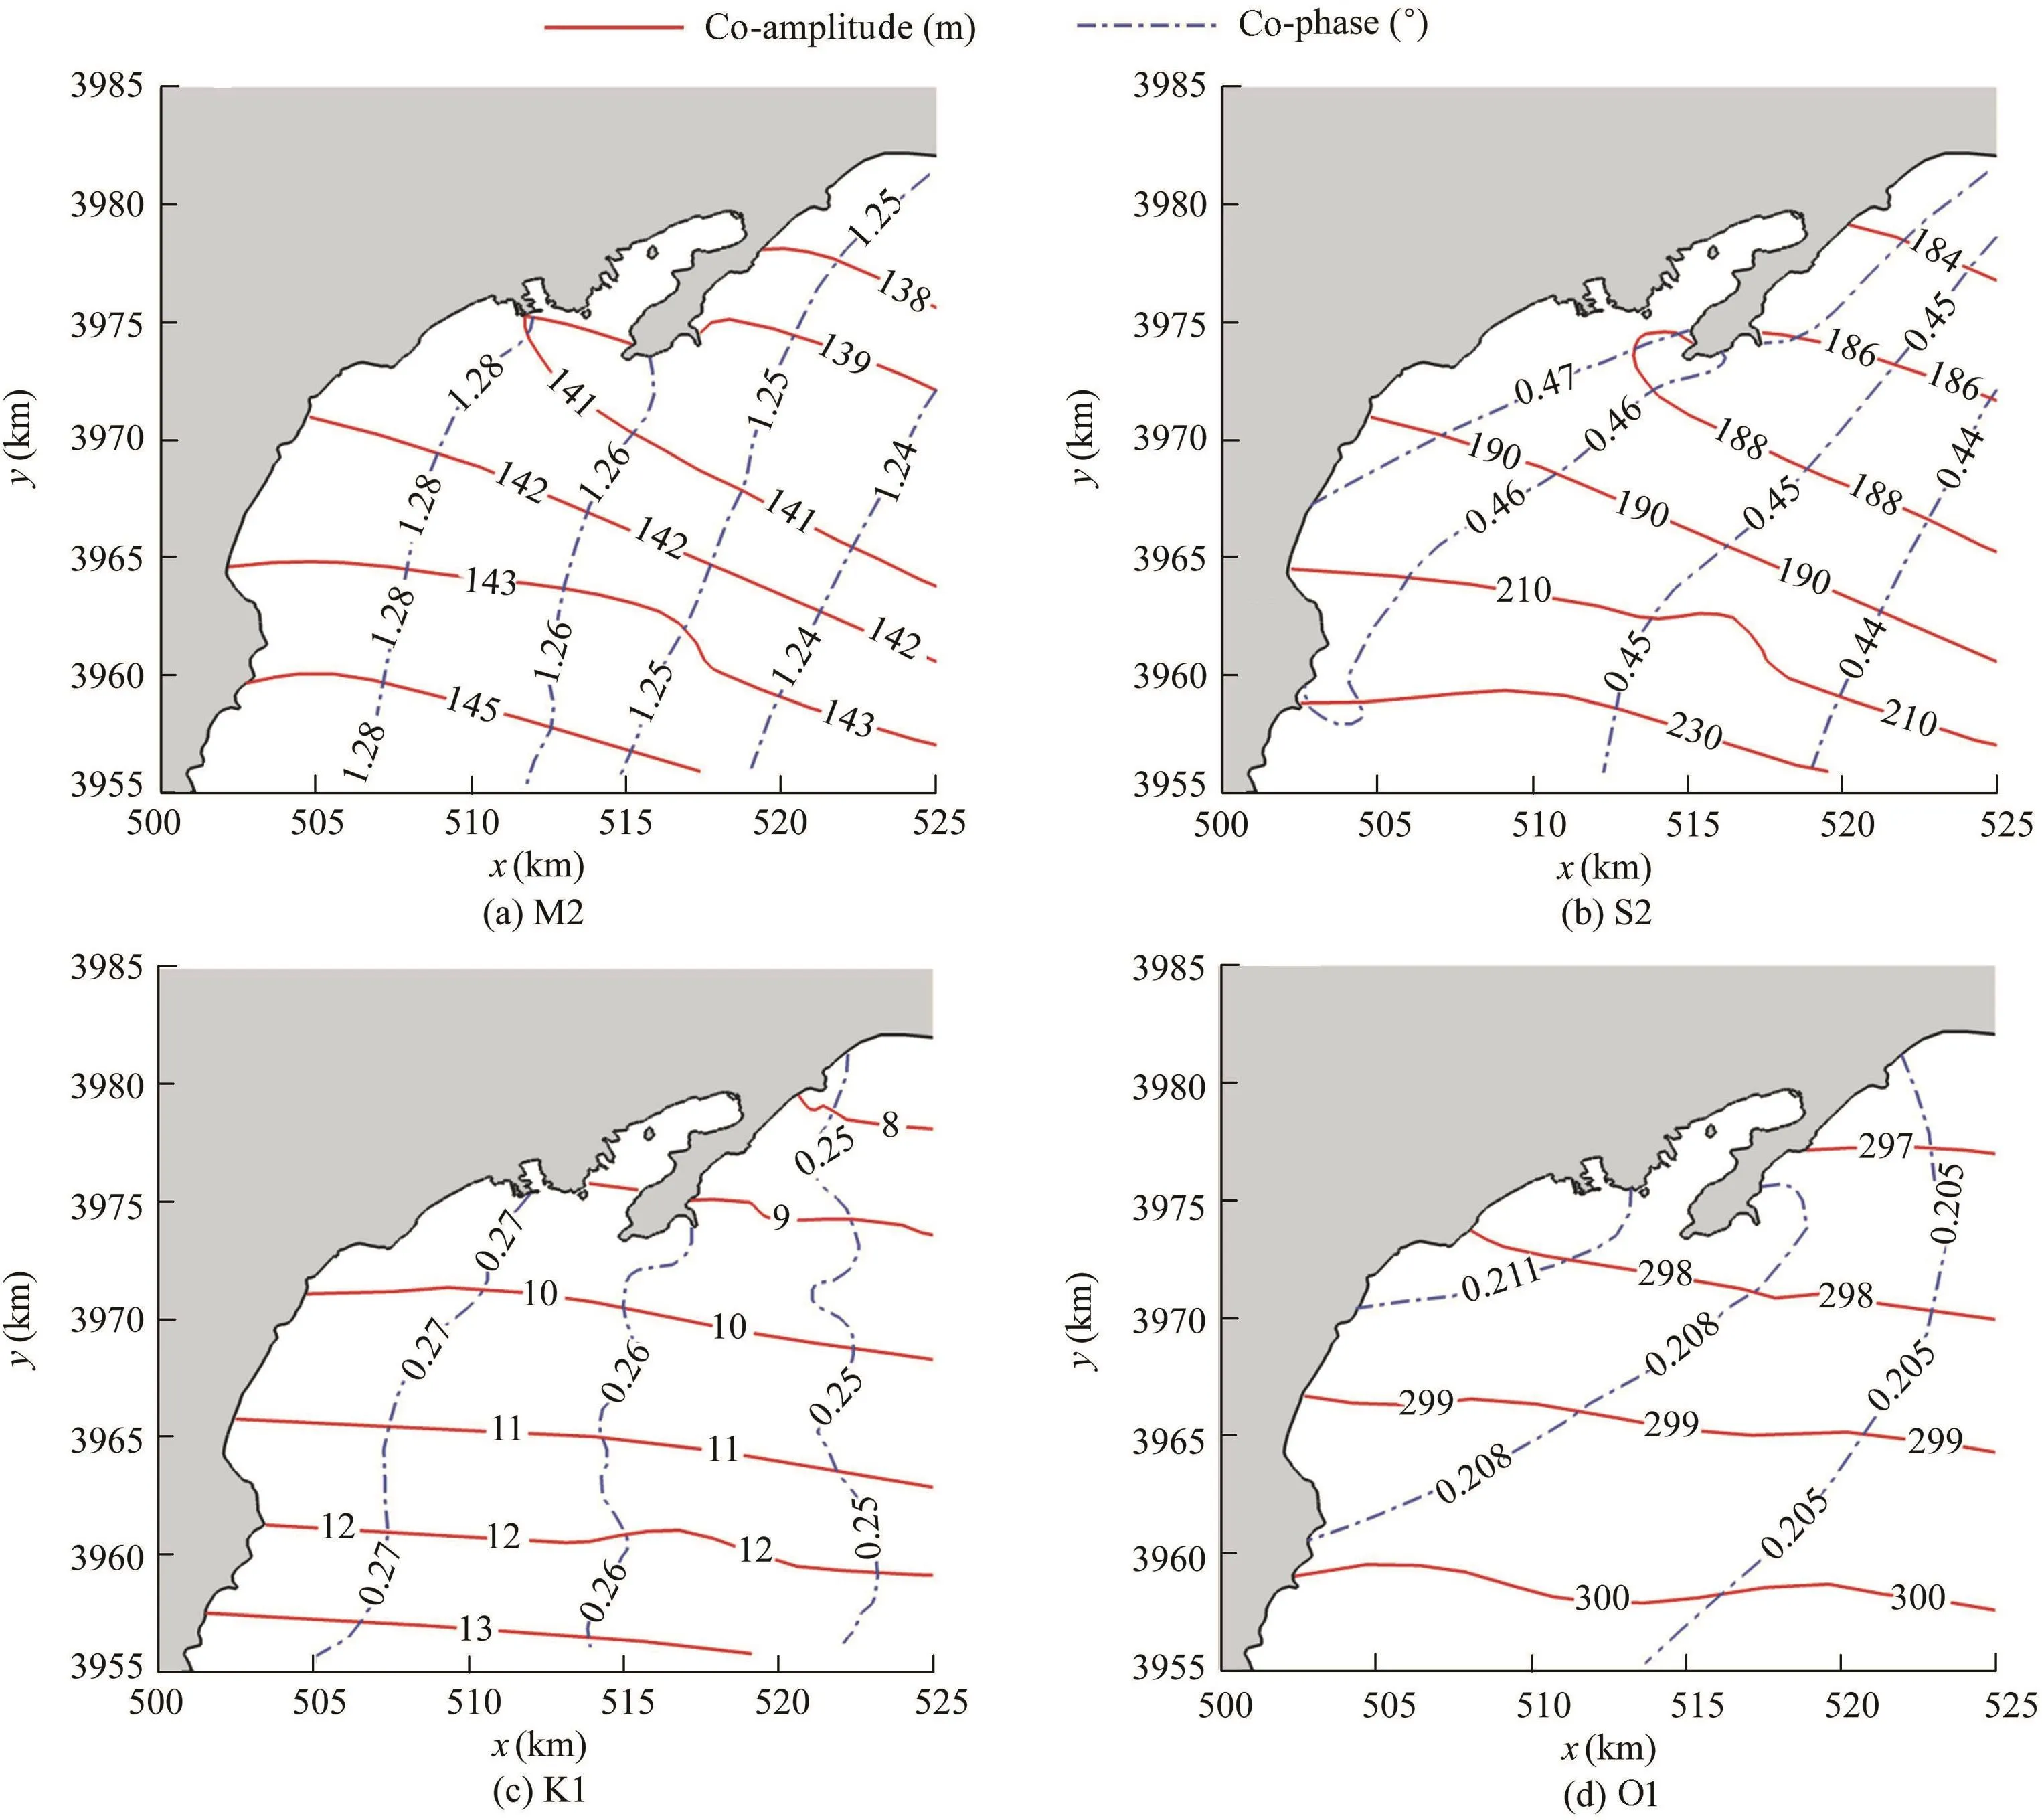
Fig.3.Co-tidal lines for four constituents around Tangdao Bay.
For all of the simulation work presented in this paper,the external and internal time steps were set as 0.1 s and 2 s,respectively.
4.2.Model validation and flow field of Tangdao Bay
In order to calibrate the dispersion model,measured trajectories(Liu et al.,2004)of particles released in JZB,which is adjacent to Tangdao Bay,were successfully simulated by the numerical model.It turns out that the predictions agree with corresponding measurements.The trajectories of the drifters were recorded with the Model GPSMAP230 Global Position System.JZB(35°58′N to 36°18′N,and 120°4′E to 120°23′E)is located on the west coast of the Yellow Sea,in Qingdao City,Shandong Province.The location of the Dagang Tidal Station and the water depth of JZB are shown in Fig.4.The average water depth is about 7 m.Three drifters were released at sites Z1,Z2,and Z3,respectively,as shown in Fig.4.Along with tidal flow in the bay,they yielded the Lagrangian trajectories.For the drifter released at site Z1,the trajectory was recorded for 6 h.The trajectory of the drifter released at site Z2 was recorded for 9 h.For the drifter released at site Z3,the trajectory was recorded for 6 h.
A comparison between predicted and measured water surface elevations is shown in Fig.5.It demonstrates that the model outputs of the JZB tidal elevation from September 9 to September 24,1993 agree with observations from the Dagang Tidal Station.
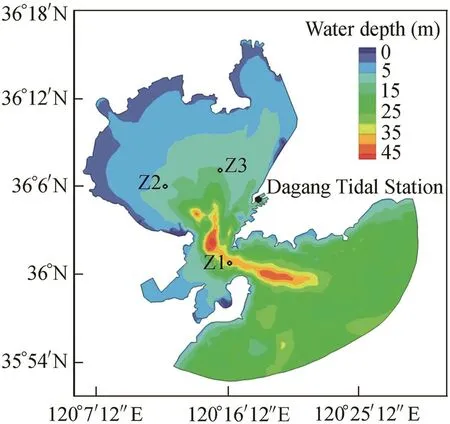
Fig.4.Topography and location of JZB.

Fig.5.Results of observation and simulation of water surface elevation at Dagang Tidal Station.
Fig.6 displays the observed and predicted drift trajectories for the drifters released at sites Z1,Z2,and Z3.The maximal difference is less than 0.5 km.Aside from the limitations of the model,the difference was in part due to the nonlinear interaction between the oscillating tidal currents and the double residual eddies.Overall,the computational capability of the dispersion model was calibrated.
In order to calibrate the tidal flow prediction capability of the model in the region of interest,the tidal flow in Tangbao Bay during the period of September 23 to October 7,2007 was simulated and compared with the observation data.As shown in Fig.1,the measurement positions P1,P2,and P3 were located in the southern part of Tangdao Bay.The tidal elevation data for P3 were obtained from the tidal prediction table published by the State Oceanic Administration of the People's Republic of China,and the data for positions P1 and P2 were measured depending on the investigation of the Qingdao coastal storm surge.

Fig.6.Results of drift trajectories at three different sites.

Fig.7.Water surface elevation comparisons during period of September 23 to October 7,2007 at P1,P2,and P3.
The current data came from a dedicated direct current reading instrument(SLC9-2).The comparisons of observed and predicted water surface elevations at P1,P2,and P3 are presented in Fig.7.The figure shows that the predicted elevations agree with the observed ones.
The survey of the current was also carried out at the three positions from September 28 to September 29,2007 in order to evaluate the computational capability of the present model in predicting tidal current in the region of interest.Comparisons of the time series data for flow direction and velocity are provided in Fig.8 and Fig.9,respectively.As shown in the two figures,the flow velocity and direction were accurately simulated with minor deviations from observed data.Based on the calibrations above,the reliability of the present model in predicting the tidal flow in the region of interest has been well verified.
The velocity distributions of the tides are plotted in Fig.10 for flood and ebb time instances.The maximum velocities at flood tide time and ebb tide time are about 0.4 m/s and 0.32 m/s in the bay,respectively.The predicted streamlines are also shown in Fig.11.At the flood tide time,the maximum velocity appears at the mouth of the bay,and the velocity in the inner bay is relatively low,which is not conducive to the water circulation.At the ebb tide time,there is a large vortex formed at the mouth of Tangdao Bay,within which the magnitude of the flow velocity is low.It is not easy for the potential pollutant to flow out of the bay.Hence,the vortex can reduce the water exchange capability.The model results indicate that the magnitude of the tidal current in Tangdao Bay is comparatively low and the vulnerability of the bay to the potential pollution is apparent.
5.Results and discussion
The hybrid of the Lagrangian particle-tracking model and the validated 3D hydrodynamic model(FVCOM)were used to estimate the seawater exchange ability,temporal evolution of the polluted area,and residence time in Tangdao Bay.
5.1.Numerical simulation of pollution situation
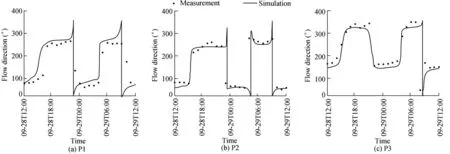
Fig.8.Comparisons of flow direction at stations P1,P2,and P3 on September 28 and 29,2007.

Fig.9.Comparisons of flow velocity at stations P1,P2,and P3 on September 28 and 29,2007.
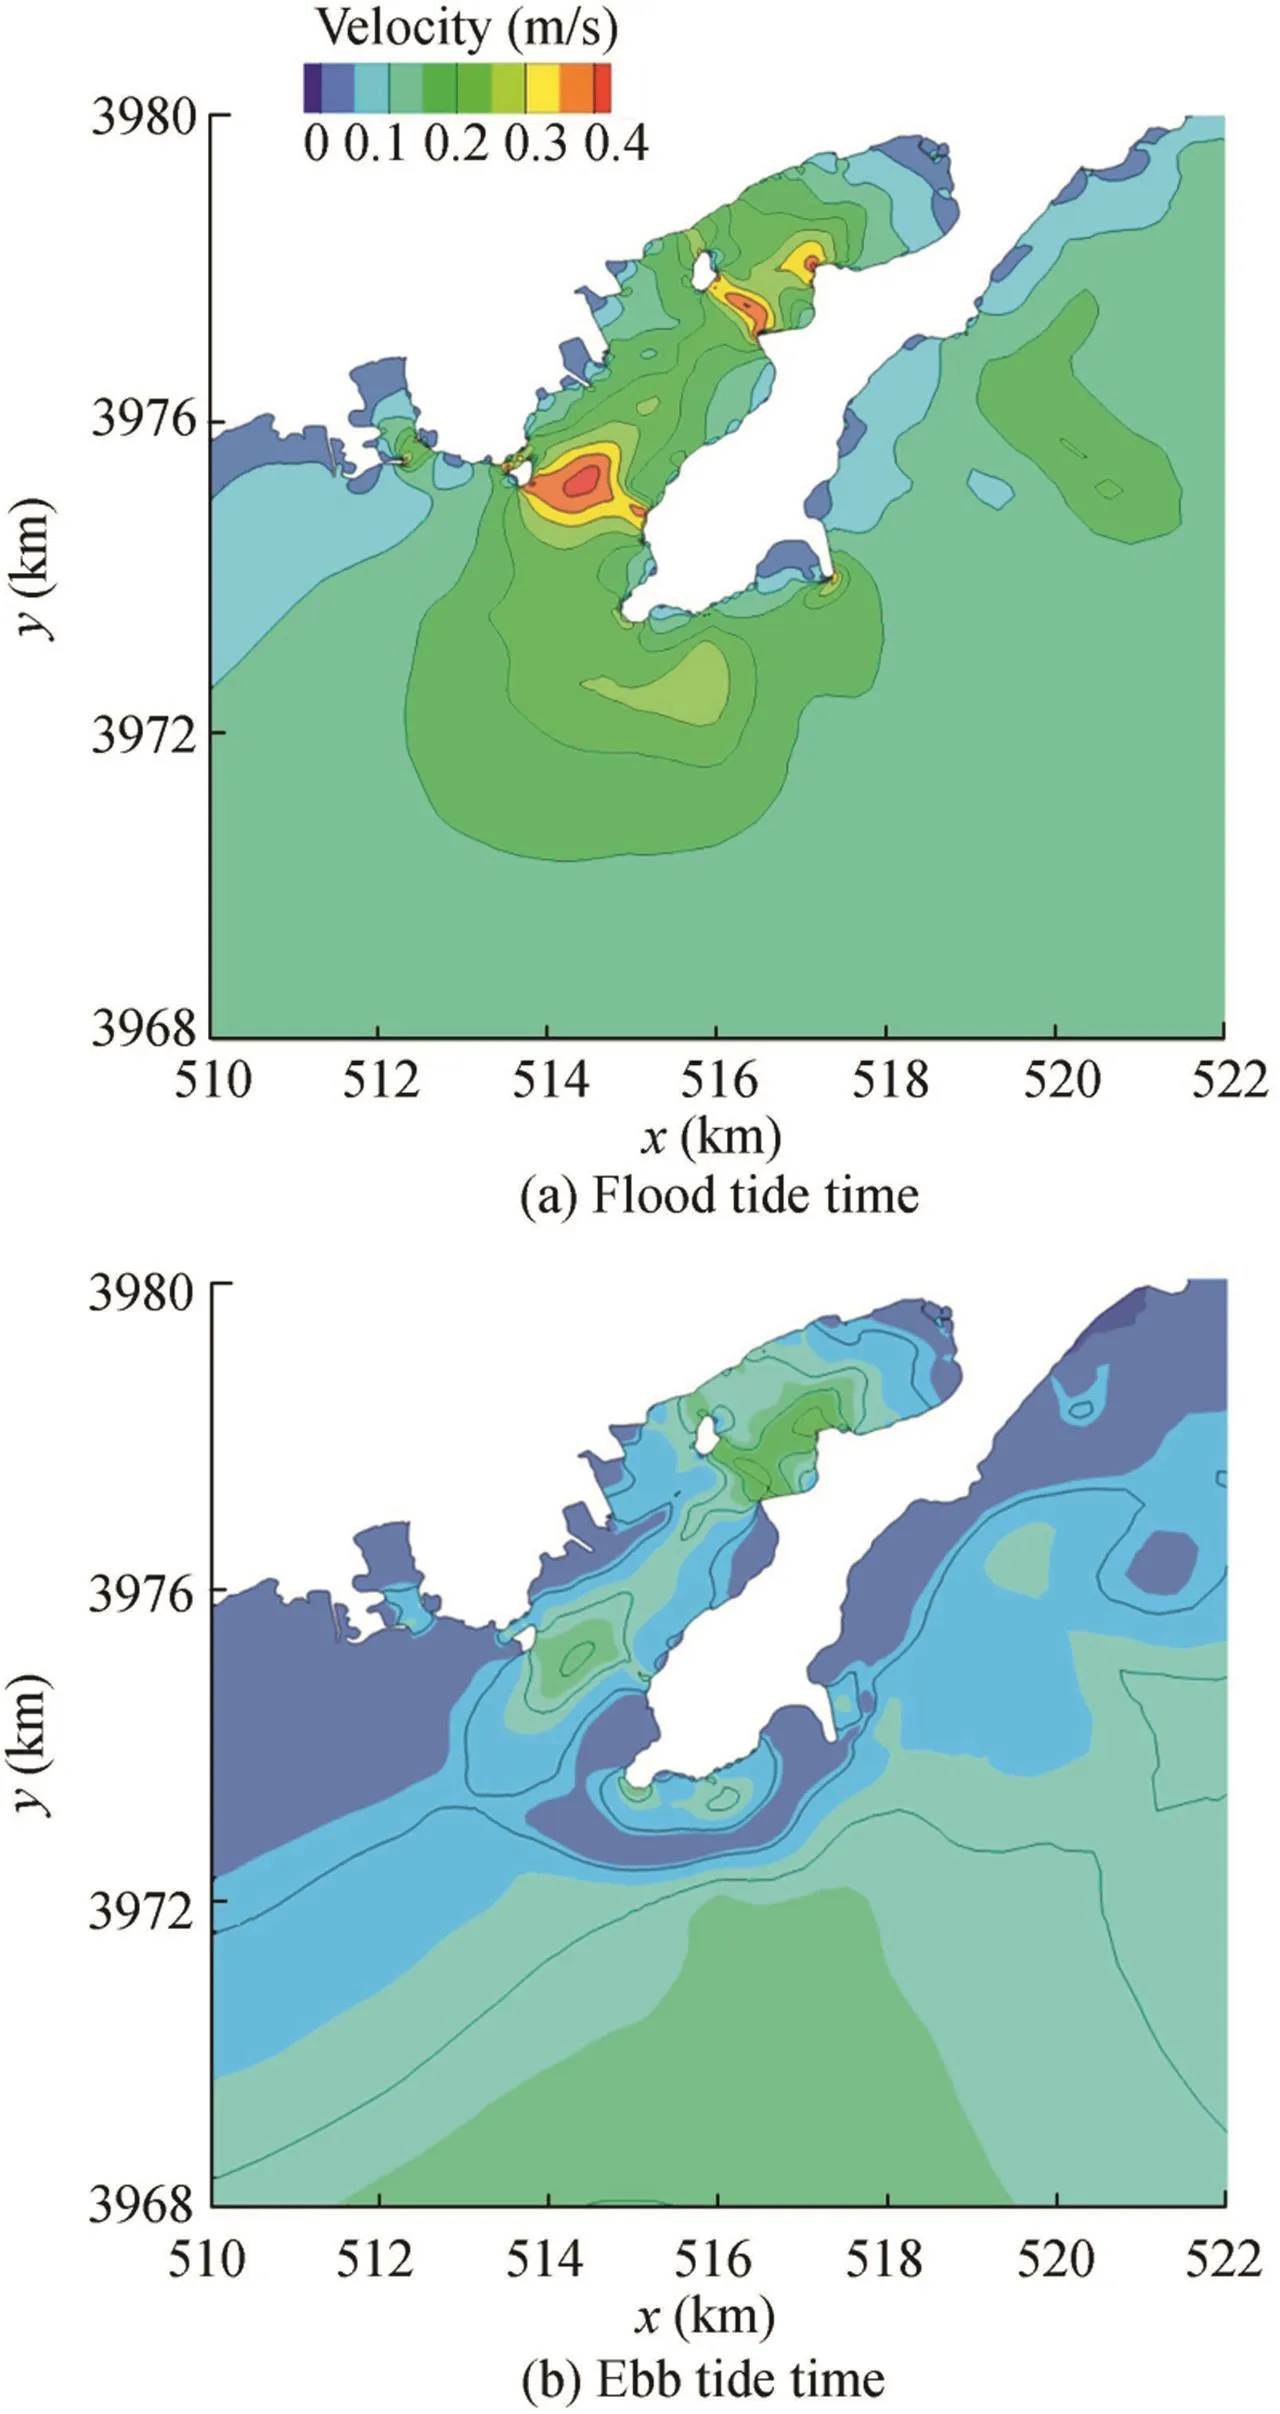
Fig.10.Velocity distributions in Tangdao Bay at different time instances.
In this study,the particle-tracking model was established on the basis of the 3D hydrodynamic model(FVCOM).Hence,released particles could move freely in 3D space along with the background tidal flow.The 3D characteristics of flow are important to accurately predicting the pathways of the particles as demonstrated by Marinone et al.(2011).Ten days of excursions of particles in 3D space are shown in Fig.12,with five particles released at different positions.The vertical excursions of the released particles are apparent.The pollution in Tangdao Bay was numerically simulated in two different ways:(1)disposable release,and(2)continuous release.
5.1.1.Disposable release
The pollution in Tangdao Bay was simulated numerically by releasing 114 particles 12 h from the start of the computation.After a 12-h window of time,the tidal flow reached a steady situation.The initial uniform distribution of the particles in the bay is shown in Fig.13.
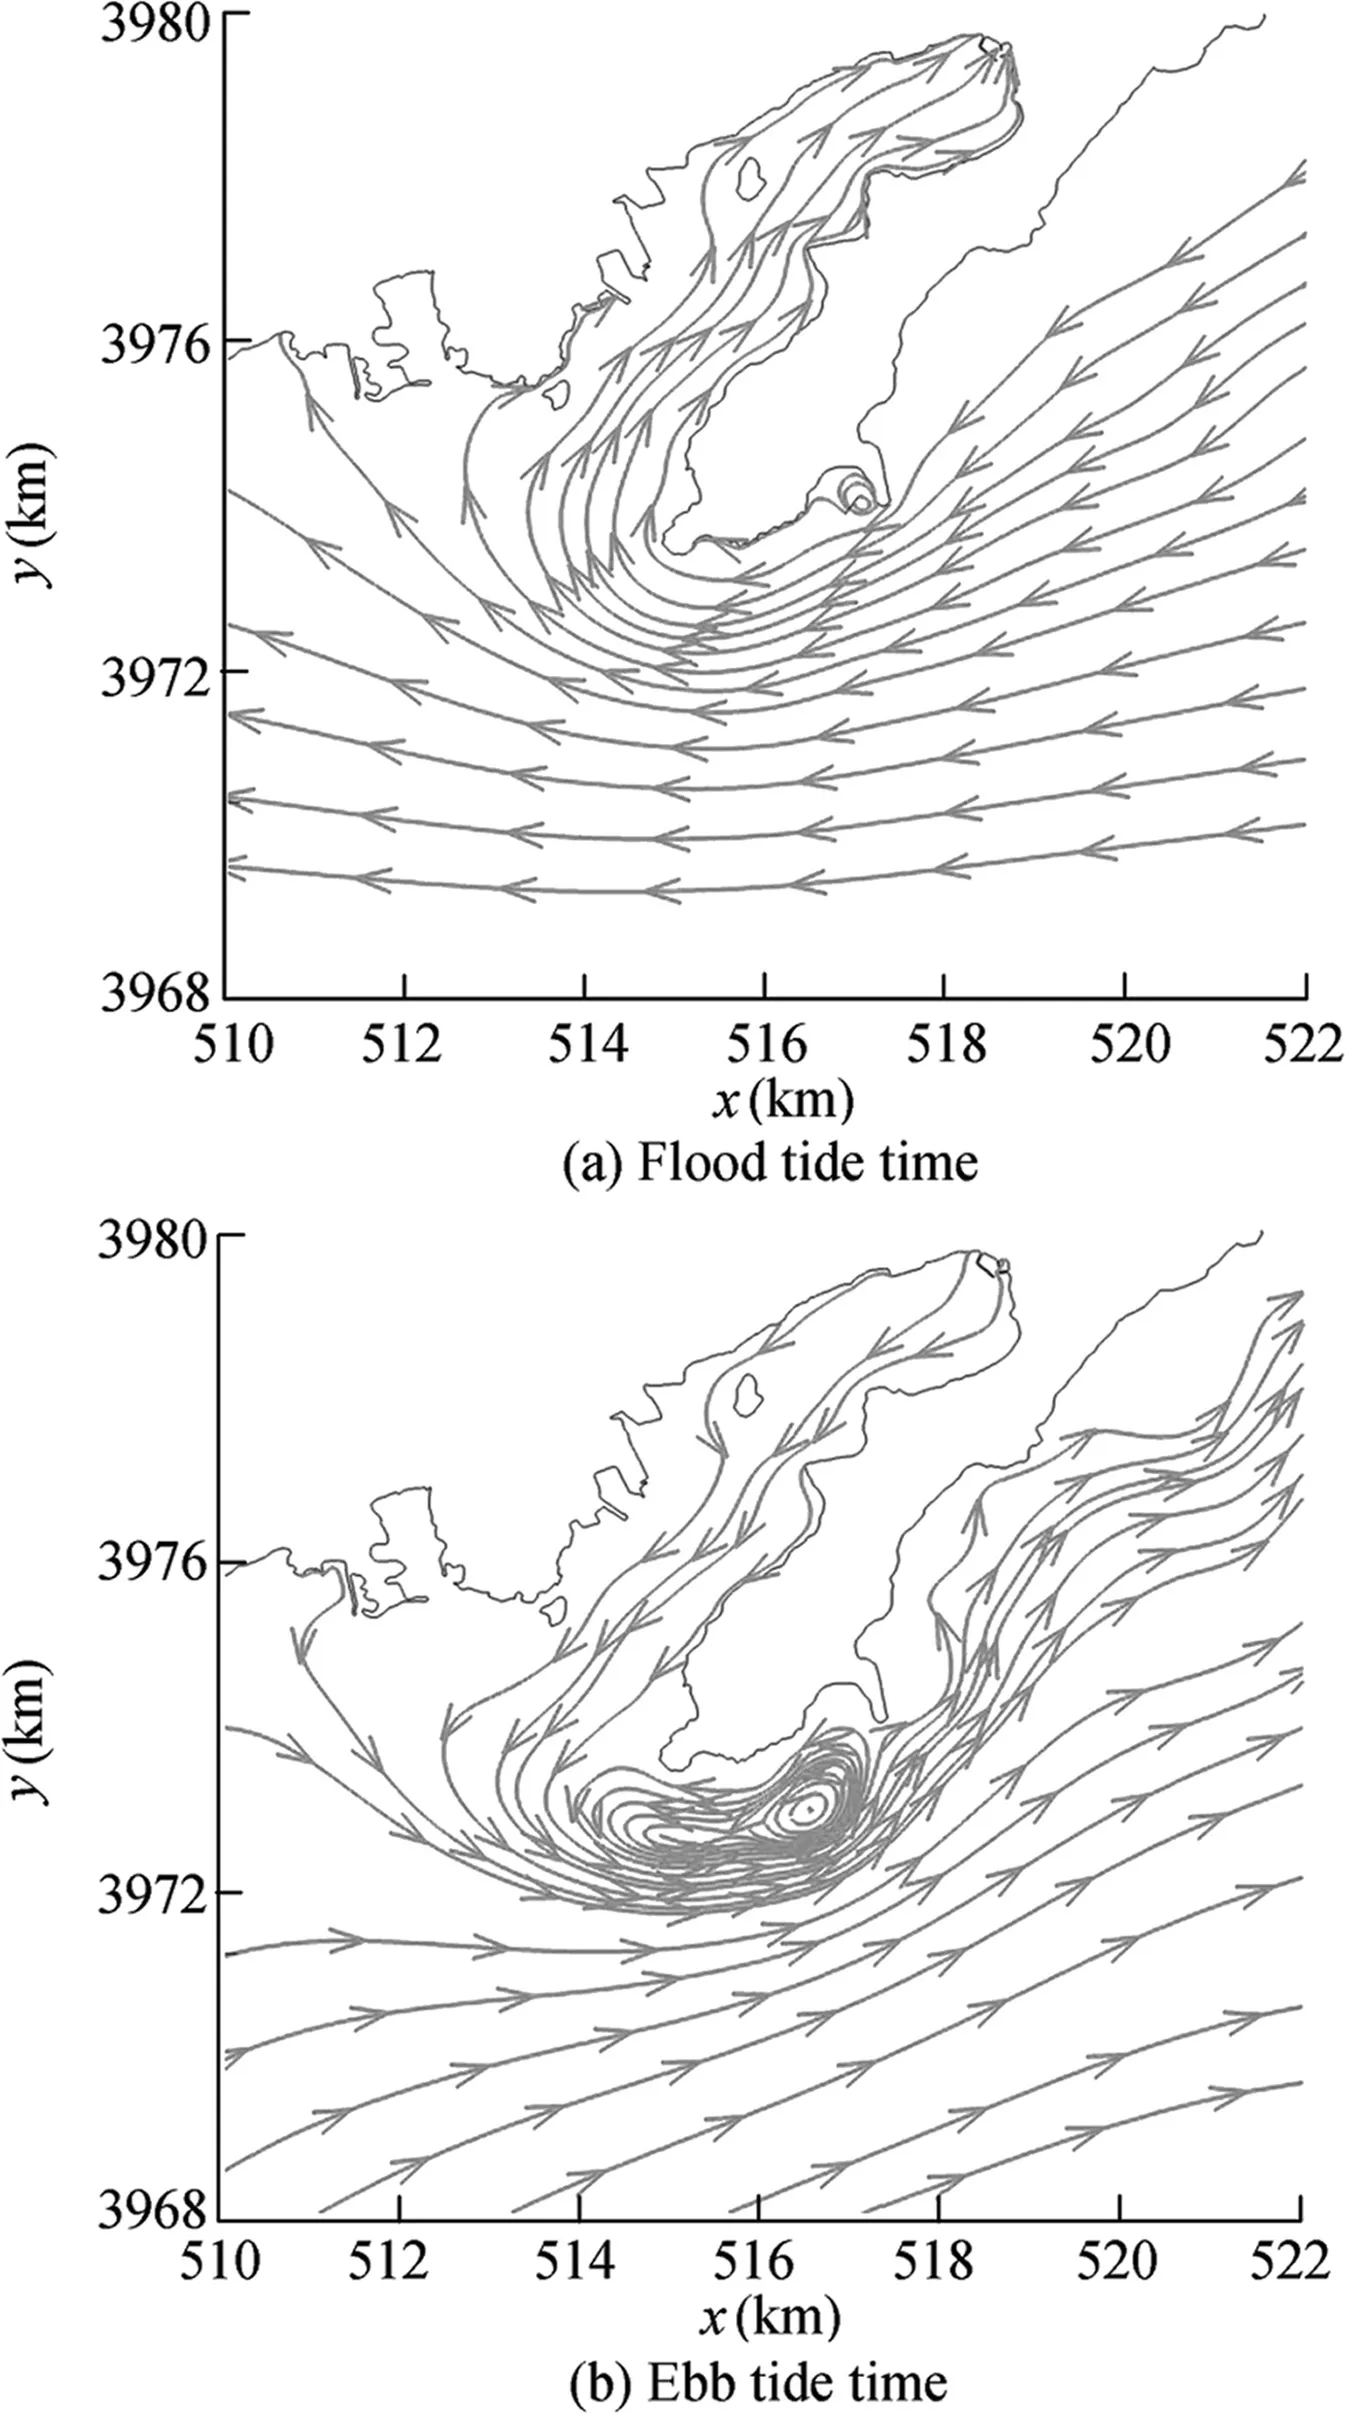
Fig.11.Flow fields of Tangdao Bay at different time instances.
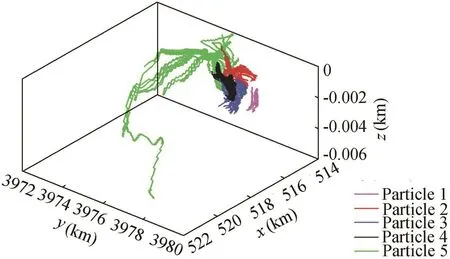
Fig.12.3D view of 10-d particle trajectories.
Fig.14 plots the snapshots of the particles'distributions at different time instances.After 2.5 d,the particle density was low in the mouth and high at the top of the bay,and,5 d later,most particles assembled in the middle of the bay.The distribution of the particles gradually became sparse,as shown in the results at 7.5 and 10 d.Particles were pushed outside of the bay and into the bay by the background tidal flow periodically.Hence,it is not surprising that,even after 10 d,there were still 67 particles within the bay.This apparently demonstrates that it is very difficult for the released particles to flow out of the bay and the residence time of water bodies in the bay is long.We can confidently assume that,once some pollution occurs in the bay,a long period will be required before the environment can purify itself.

Fig.13.Initial uniform distribution of particles in bay.
Based on the resolution of the computation mesh,the temporal evolution of the polluted area has been plotted in Fig.15.As shown in Fig.15,the polluted area in the bay has gradually decreased.Meanwhile,the polluted area outside of the bay approached a stable state after about 5 d.The total polluted area also gradually decreased as time went by.This is probably due to the fact that particles will assemble in some places,especially the low velocity regions.
5.1.2.Continuous release
The current pollution in Tangdao Bay was numerically simulated by continuously releasing particles at eight selected sites located in the bay as shown in Fig.16.The particle release sites were chosen based on the real pollution locations along the coastline of the bay.The predicted results can be used to illustrate the pollution level and the purification capability if the bay suffers from continuous pollution.There were four particles released every 6 h at each of the eight sites.Fig.17 shows the distributions of particles in the bay at different time instances.As time went on,more and more particles assembled in the bay.Few of them had the chance to escape from the bay.This is for two main reasons:(1)the low water exchange capability in the bay,and(2)the particle release frequency being much higher than that of the tidal flow.There is no doubt that the quality of the environment in the bay will become worse and worse if the pollutants are discharged to the bay constantly.
Fig.18 demonstrates that all polluted areas will gradually increase,no matter whether the polluted area is in the bay, outside of the bay,or throughout the area.The severe pollution in Tangdao Bay has been successfully simulated through the numerical simulation work presented in section 5.1.1 and in this section.
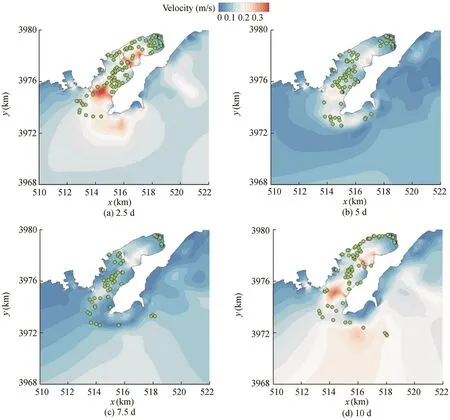
Fig.14.Particle distributions under disposable release at different time instances.
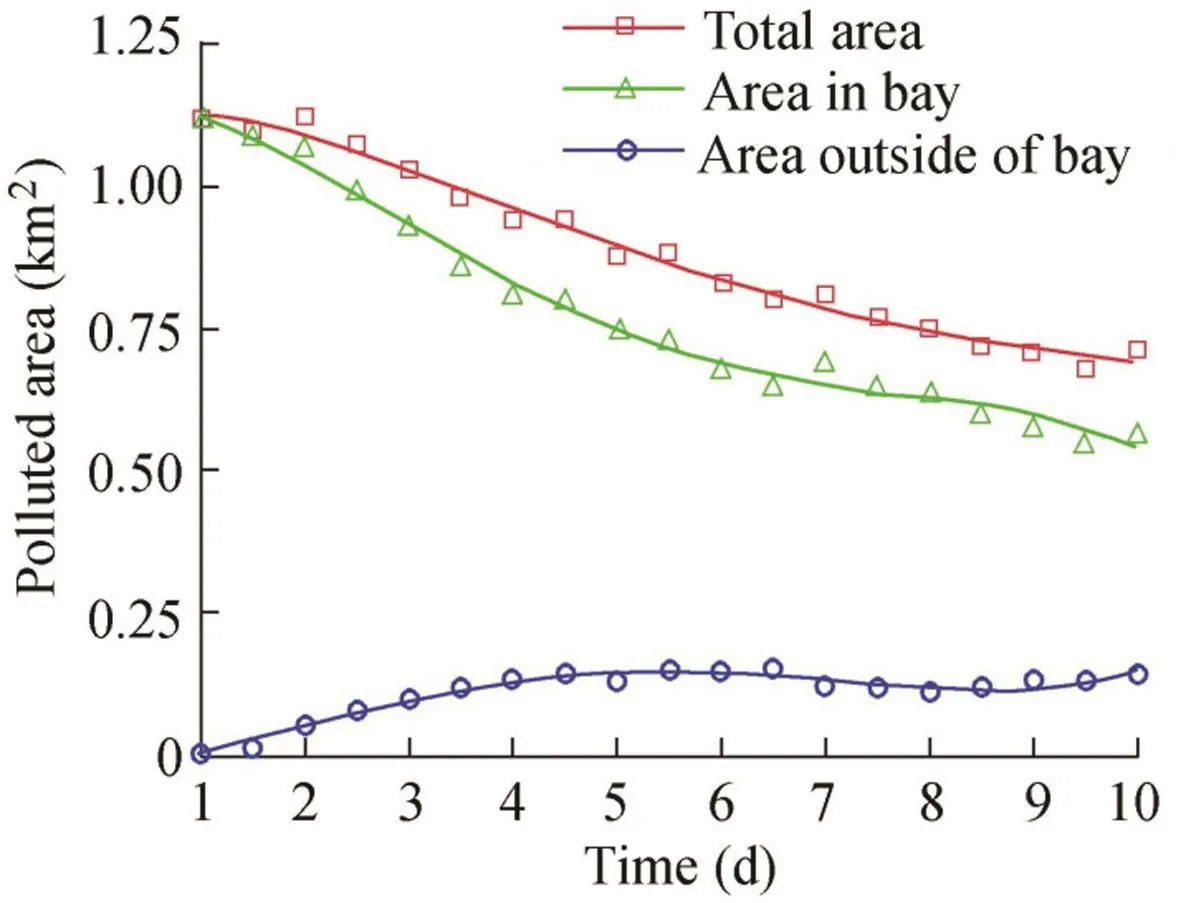
Fig.15.Temporal evolution of polluted area under disposable release.
5.2.Environmental improvement measures
As discussed in previous sections,the severe pollution in Tangdao Bay is mainly caused by the low water exchange capability and long residence time.In order to improve the bay environment and enhance the water purification rate in the bay,three different channels connecting the bay and open sea have been proposed and their effects on the water exchange capability have been numerically examined one by one in this study.Considering the weak circulation of interior water,channel I is located at the top of the bay.Channel II is located where there is a corner exiting in the middle of the peninsula.When the flow passes the sharp corner,the fluid velocity decreases,which weakens the flow circulation.It is hoped that this channel can raise current velocity and improve the circulation ability by connecting the bay and open sea.Channel III is placed near the mouth of the bay.There is a sharp corner at the lower edge of the peninsula where a large vortex can be formed as shown in Fig.11(b).The width of each channel is ideally set as 0.175 km.The bathymetry of the channels is smooth between the bay and the open sea.Table 2 shows the exact locations of the proposed three channels.
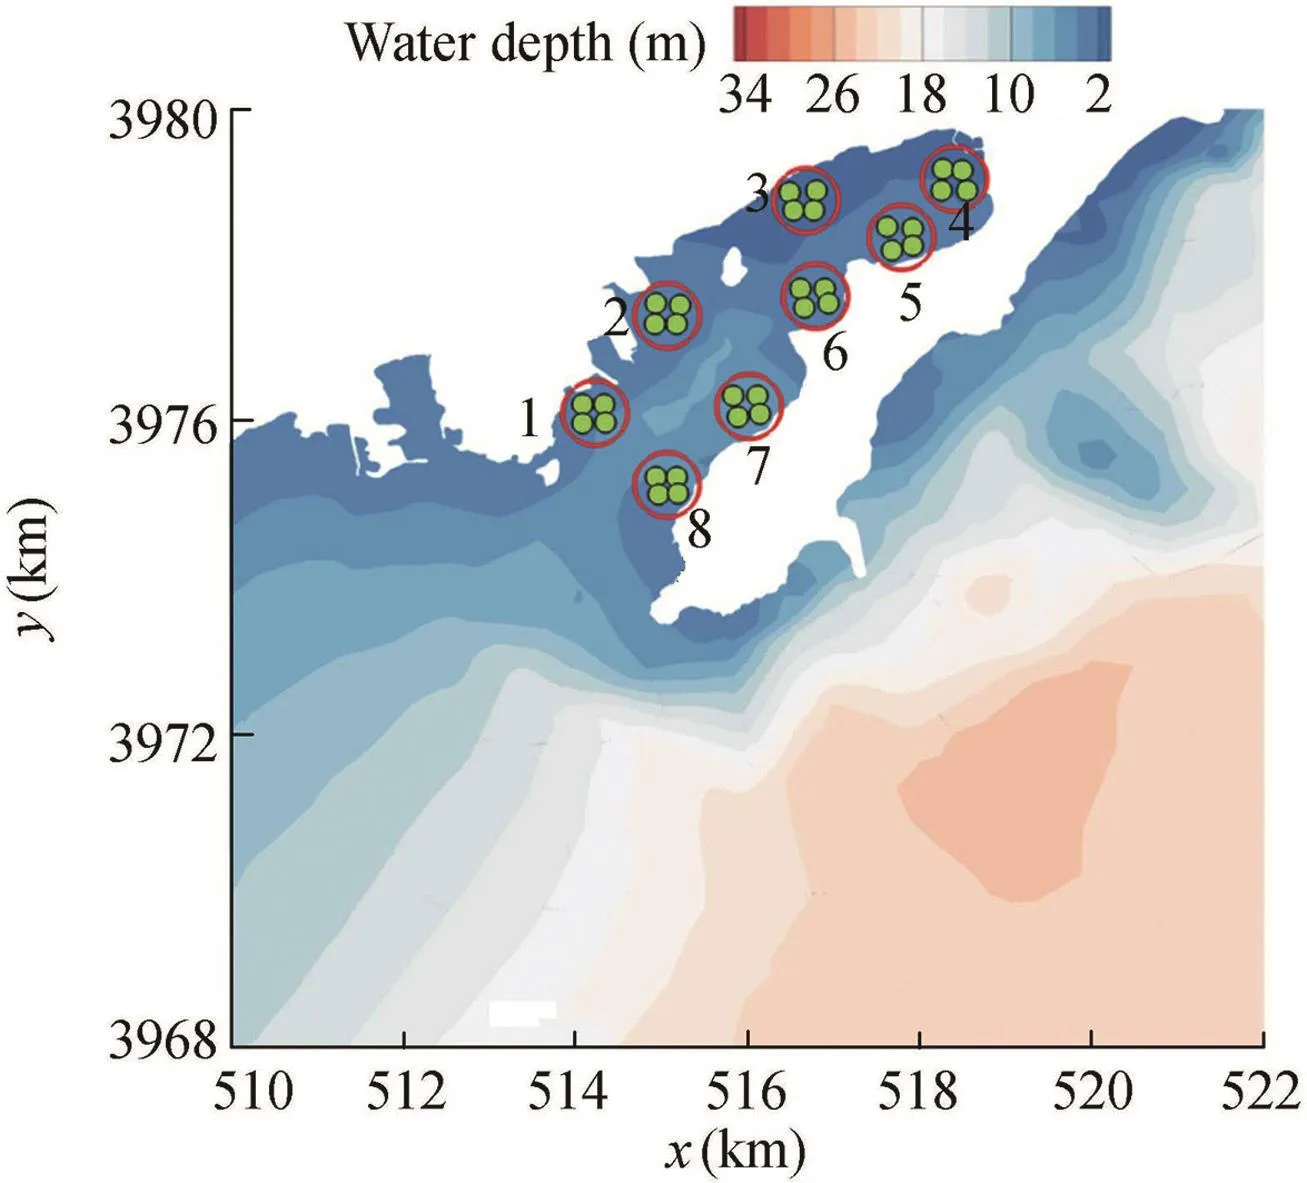
Fig.16.View of particle-releasing sites in bay.
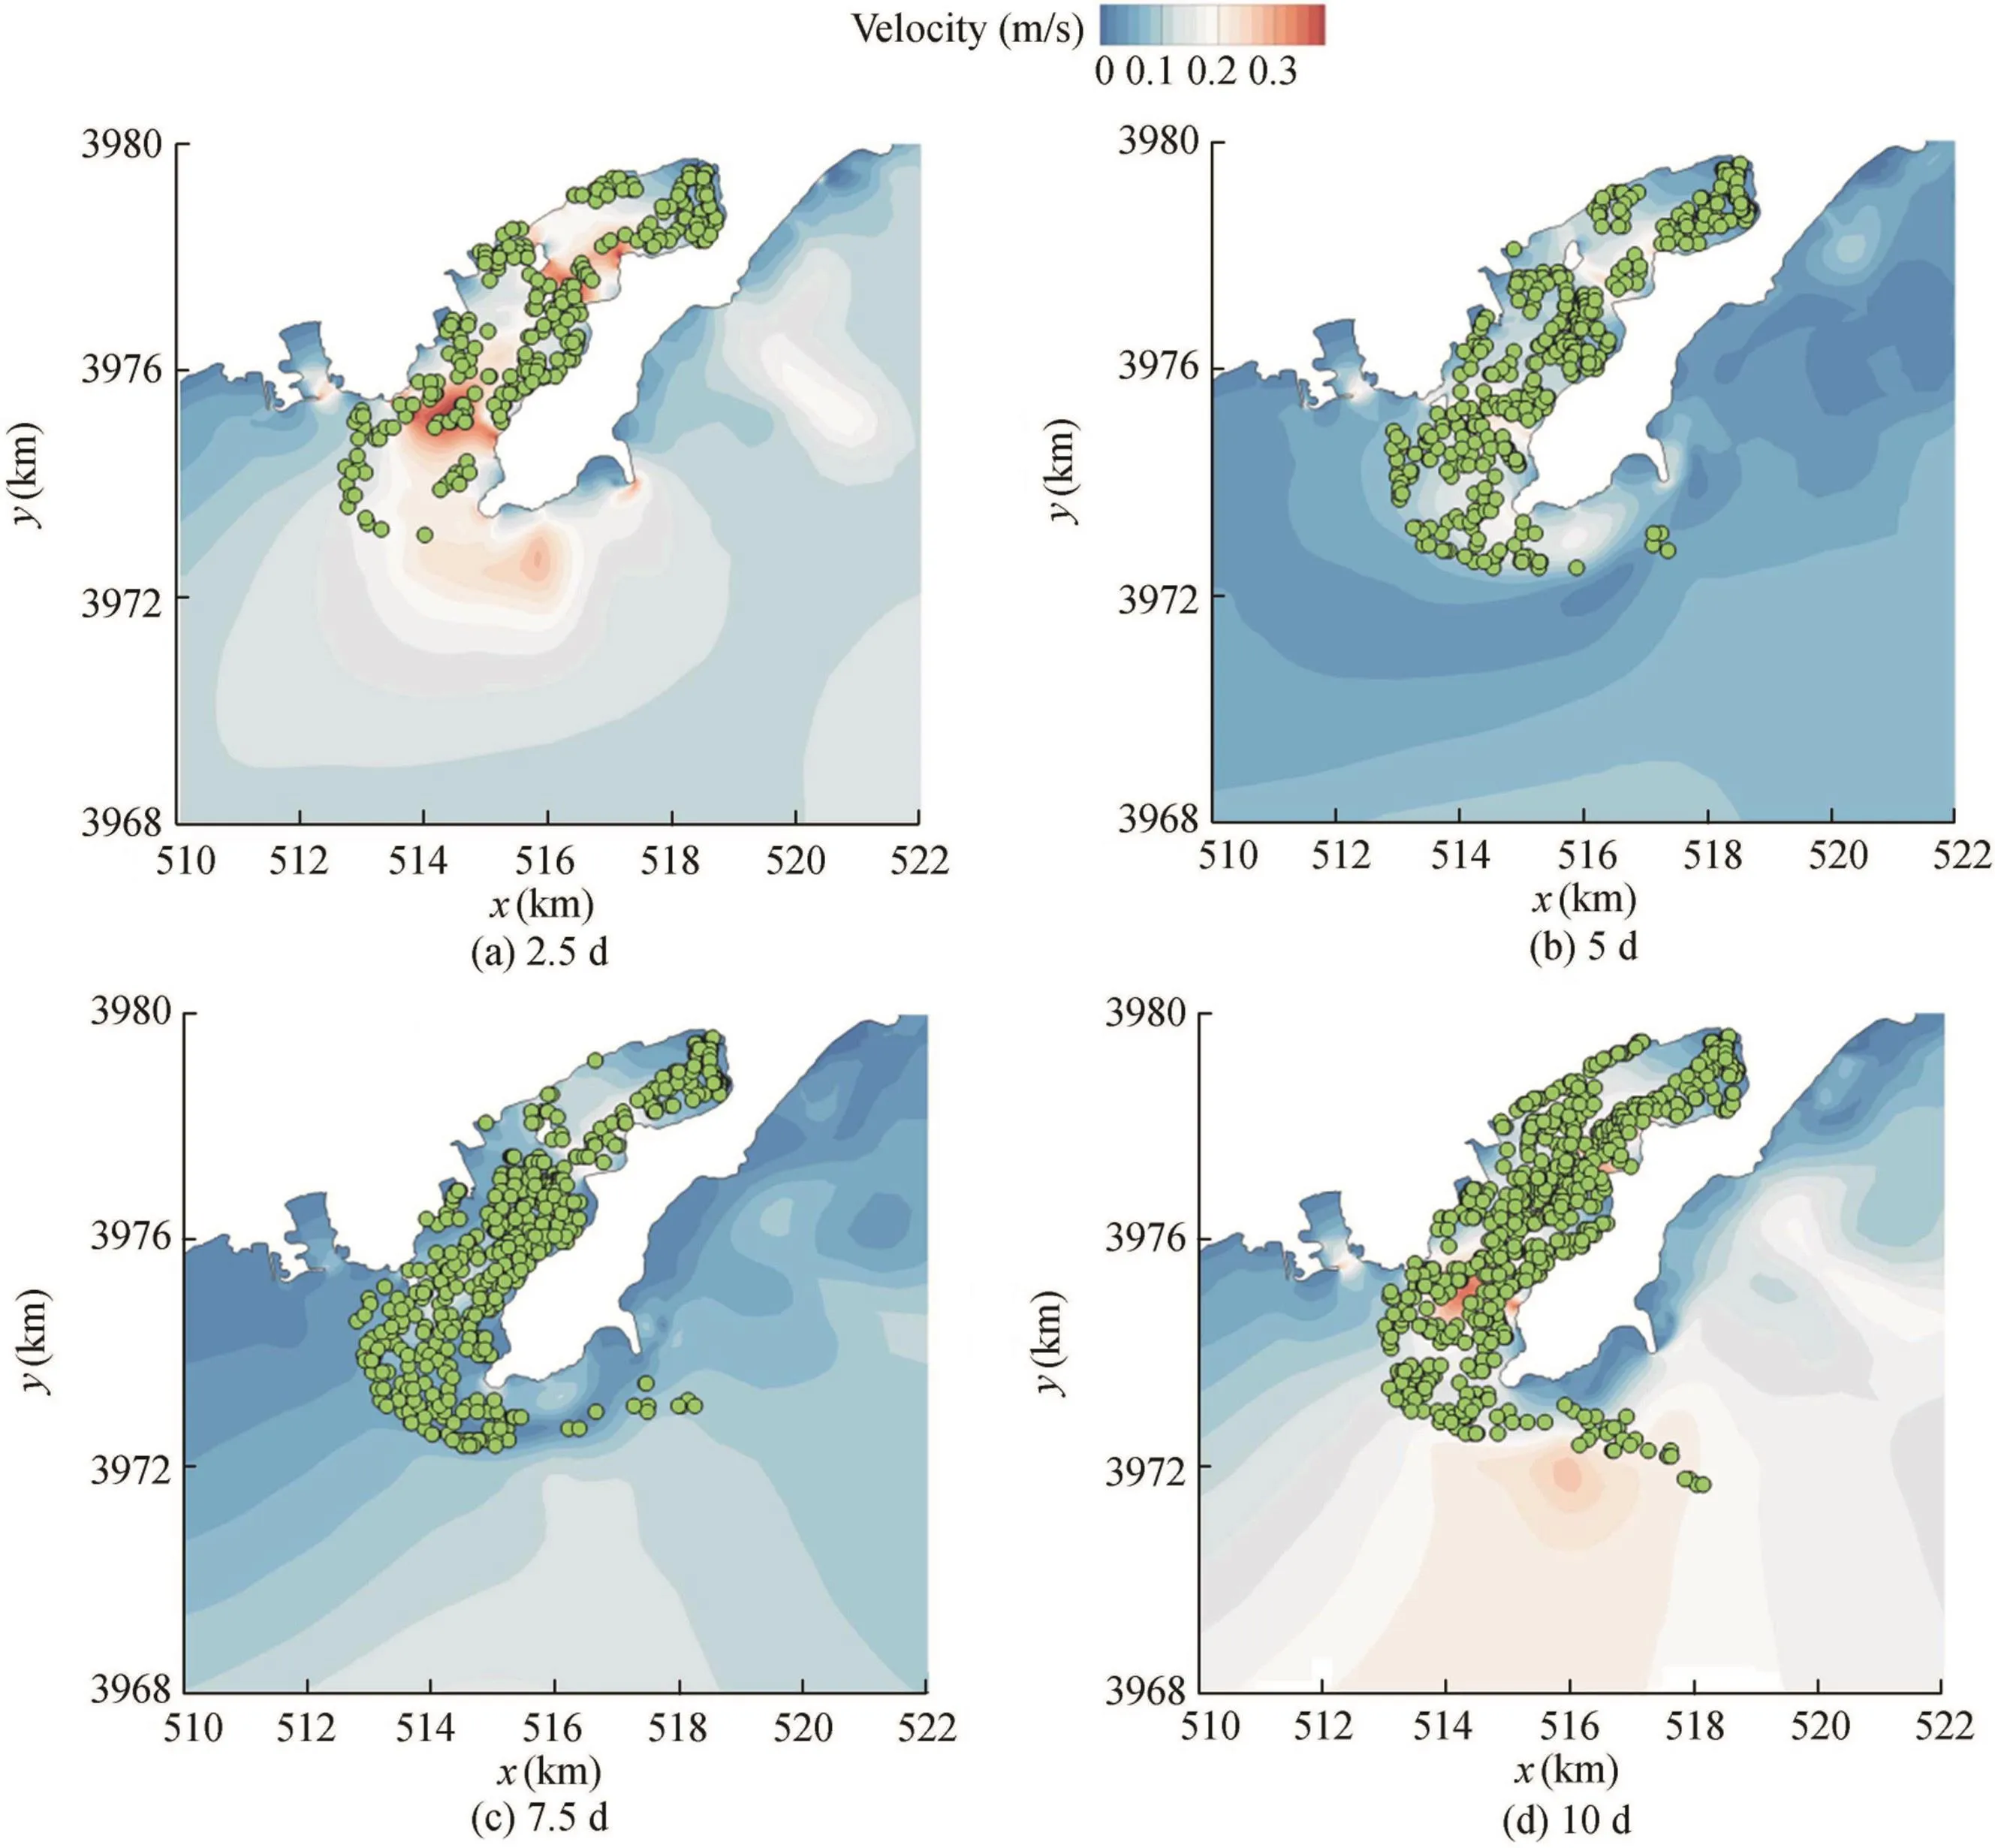
Fig.17.Particle distributions under continuous release at different time instances.
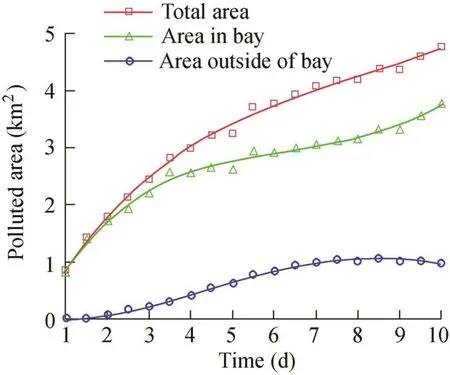
Fig.18.Temporal evolution of polluted area under continuous release.
5.2.1.Efficiencies of proposed channels under disposable release
The efficiencies of the proposed channels under the disposable release condition have been numerically studied.The same setup as that in section 5.1.1 was applied.Fig.19 plots the snapshots of the particle distributions and velocity contours at different time instances in the bay,when channel I has been considered.Once the channel is established,a flow circulation loop between the open sea and the bay is formed,which contributes to a shorter water exchange period.The current speed is always high in channel I and its vicinity.This helps more particles escape from the bay,compared with the case without channels.The particle density around the inlet of channel I keeps decreasing with time,and the nearby particles have been gradually carried to the outside by the newly formed circulation.This demonstrates that the proposedchannel can enhance the water exchange capability to some extent.
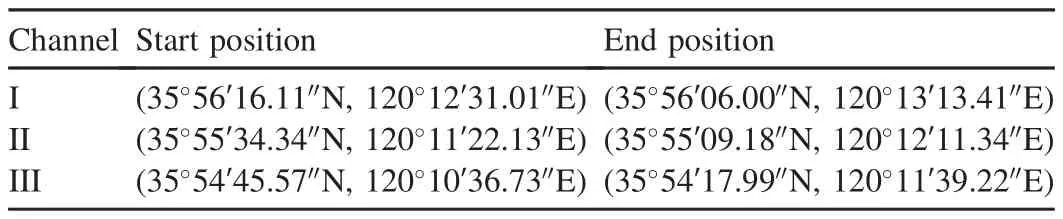
Table 2Locations of proposed three channels.

Fig.19.Snapshots of particle distributions at different time instances with channel I.
Similar results have been obtained for the cases with channel II and channel III,as shown in Fig.20 and Fig.21,respectively.
In the original bay,the maximum velocity is about 0.4 m/s at the month of the bay.Since the bay is semi-closed,the current speed decreases rapidly from the mouth of the bay to the inner part of it.Apparently,it is difficult for the inner water to flow out of the bay.Once the channel is established,a flow circulation loop between the open sea and the bay can be formed,contributing to the reduction of the water exchange period.In case 1,with channel I,the water circulation loop is formed throughout the Tangdao Peninsula.The inner water of the bay is connected with the open sea directly and it can flow to the ocean as soon as possible,as seen in Fig.19.Compared with the rest of the flow in the bay,the velocity in the channel is highest.The channel can accelerate the flow of the water.In case 2,channel II connects the middle part of the bay with the open sea.The flow field shows that the velocity in the channel is still very high and the flow around the channel is more intense than in other places.However,the flow velocity in the inner part of the bay is lower than that of case 1,and the flow of inner water weakens too.For case 3,channel III is located at the bottom of the Tangdao Peninsula.The flow circulation loop is smaller than it is in the other two cases.Although the water around the channel can flow into the ocean rapidly through the mouth of the bay and the channel,the current throughout the bay is the slowest.
Fig.22 shows temporal evolution of the particle ratio in the bay for the proposed three channels.The particle ratio α is defined as the ratio between the number of particles in the bay and the total particles released since the start of the computation.When there is no channel,the ratio is higher than it is with other cases throughout the computation.After 10 d,about 59%of the particles remain in the bay.As demonstrated in Fig.22,the implementation of channels I and II can produce monotone decreasing of the particles in the bay.Meanwhile,the implementation of channel III cannot guarantee such a monotone decreasing trend.Its efficiency is very close to a case without the channel at 10 d.

Fig.20.Snapshots of particle distributions at different time instances with channel II.
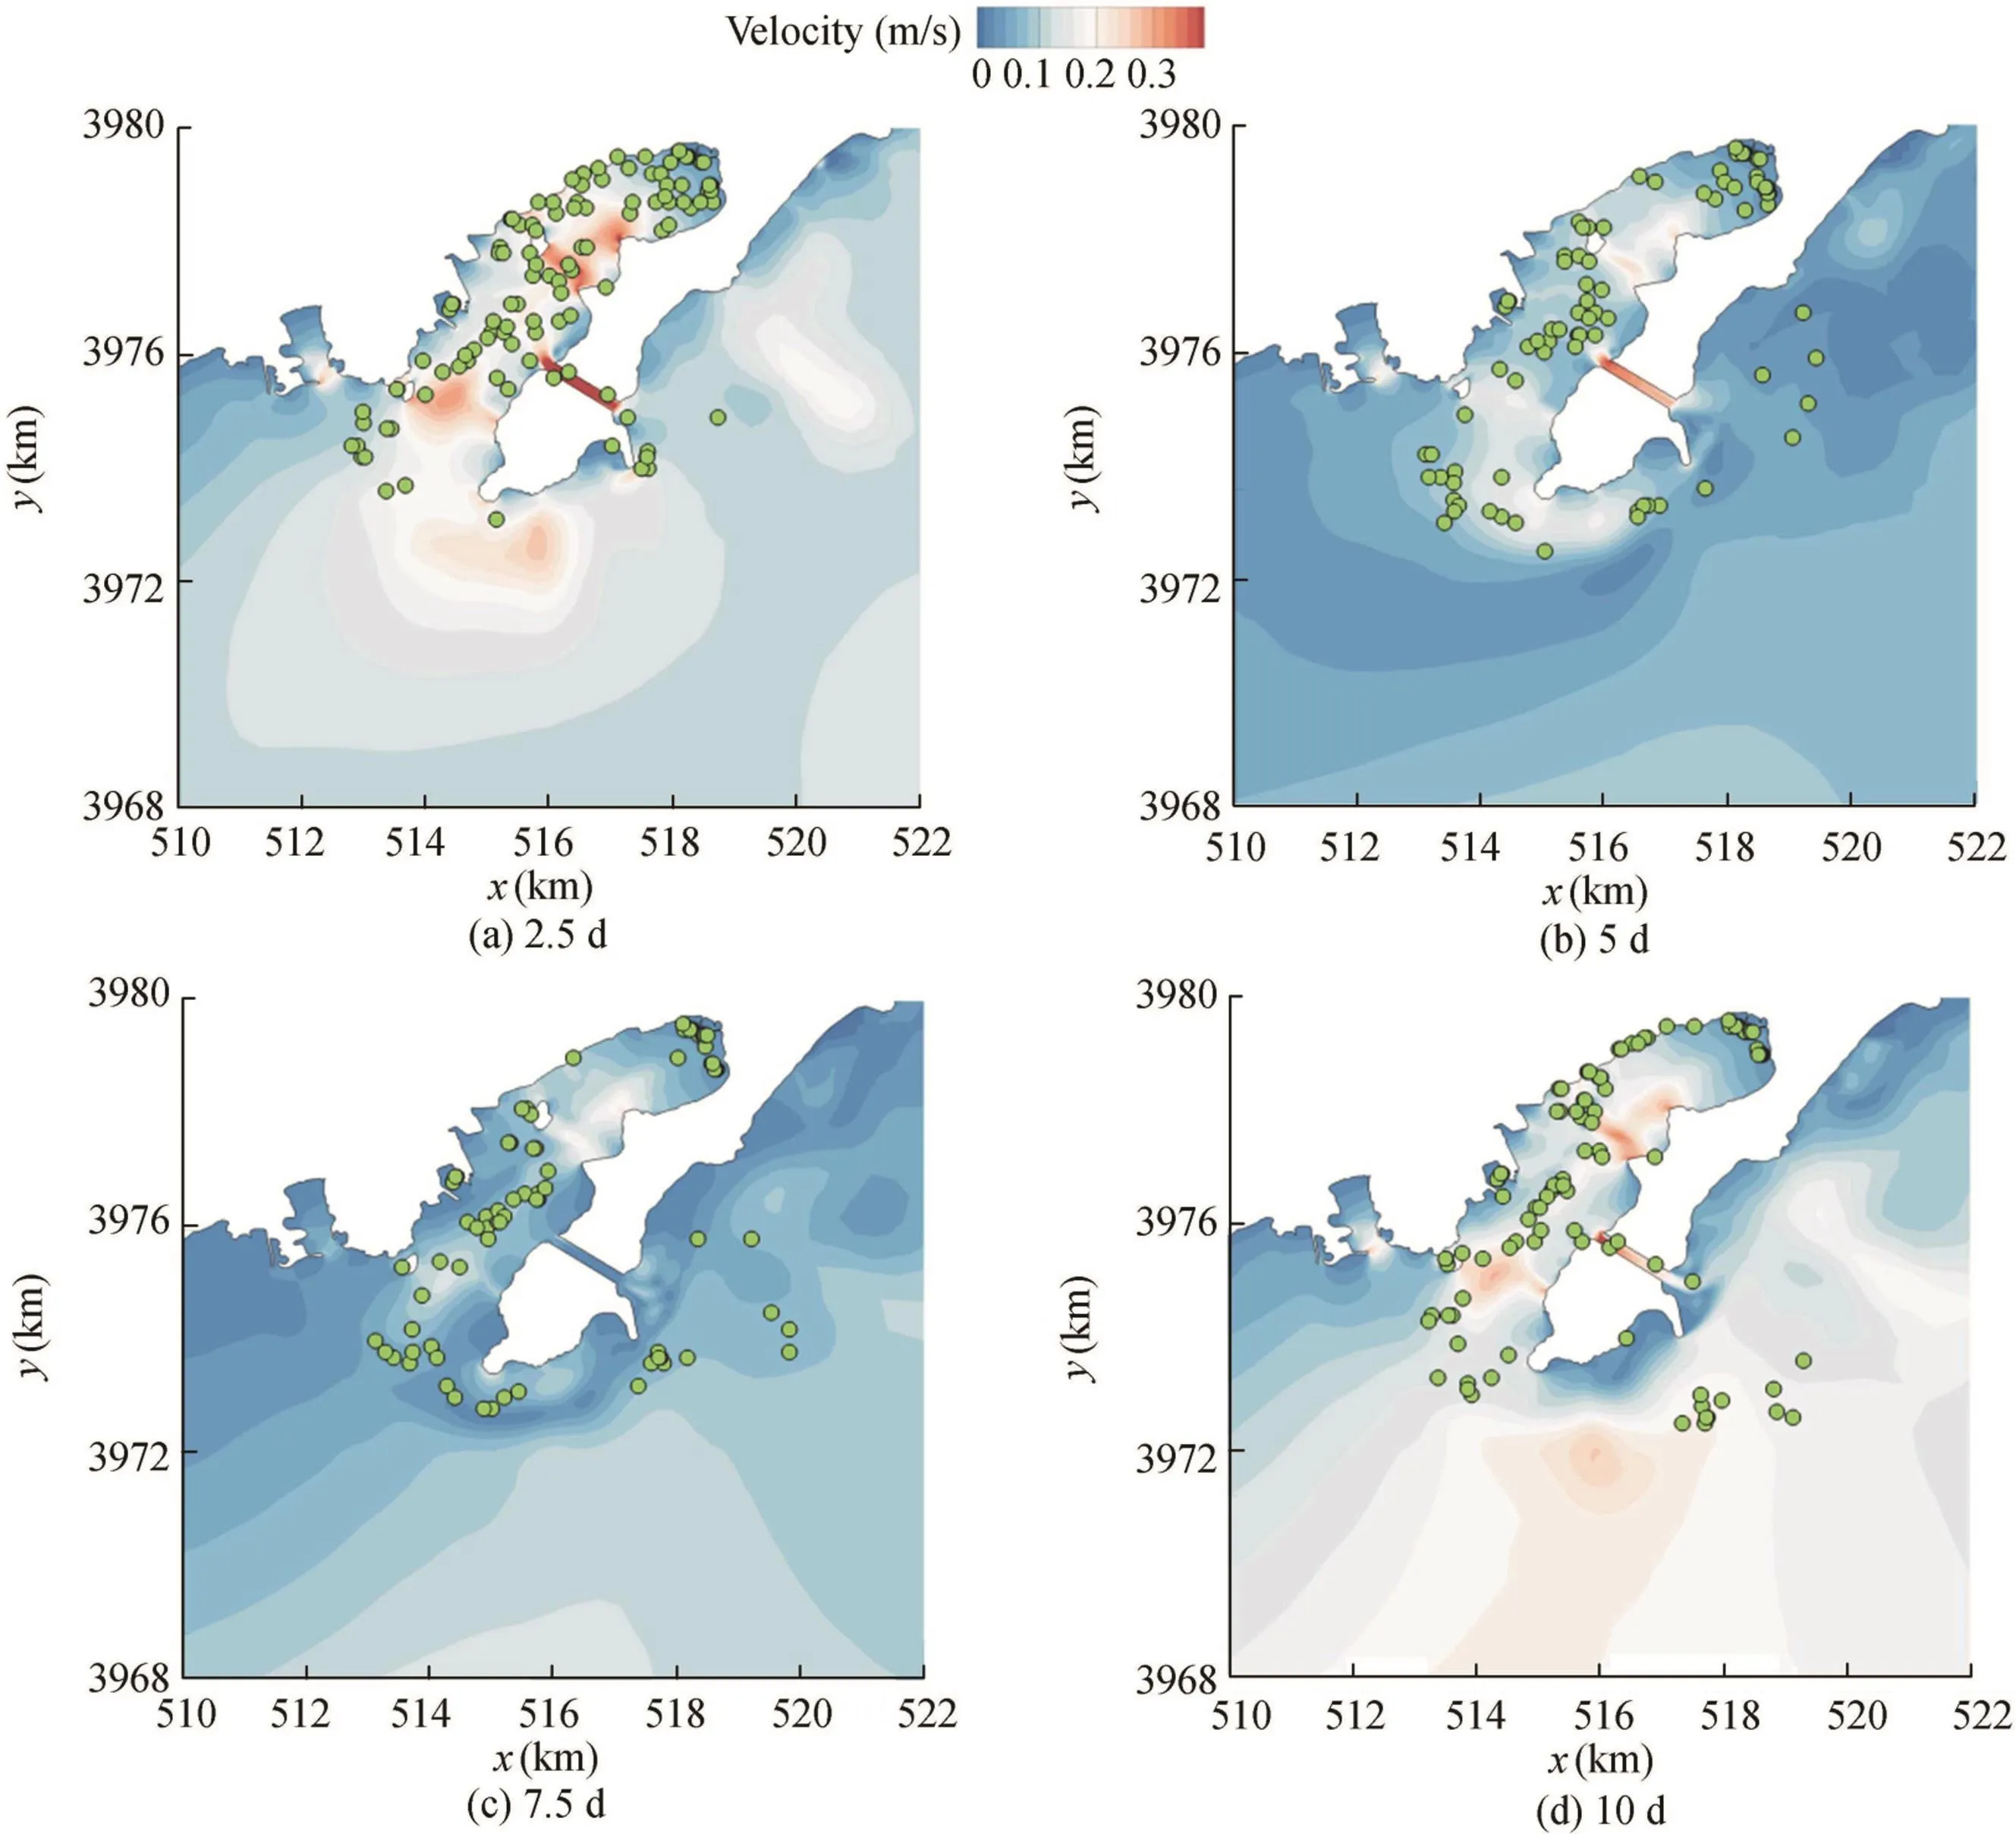
Fig.21.Snapshots of particle distributions at different time instances with channel III.
Fig.23 displays the temporal evolution of the polluted areas for the bay with different channels.As with the results shown in Fig.22,channel I has the highest decreasing rate of the polluted area in the bay,compared with the other two cases.The polluted area is about 0.4 km210 d from release,which is about half of that in the case without channels,as shown in Fig.15.When channels II and III are applied,the polluted areas in the bay are also reduced gradually.

Fig.22.Temporal evolution of particle ratio under disposable release in bay.
In addition,the average residence time is calculated according to Lagrangian particle path/trajectory information.Consistent with its definition in the study,the residence time reflects the time scales associated with material that is transported to the open sea.The locations of these particles are then recorded at each time step.The simulation results show that the water exchange capability is improved gradually from the top to the mouth of the bay.Depending on the calculation results,about 30%of the water at the top of the bay and 45%of the water at the mouth of the bay are exchanged after 10 d,respectively.In the original bay,the average residence time is about 33 d.If channel I is applied,the average residence time of the bay is about 19 d,less than that with other cases.When channels II and III are established,the average residence times are 24 d and 26 d,respectively.Based on results shown in this section,the proposed channels are effective in enhancing the water exchange capability between the bay and the open sea.The measure finally causes a pollution reduction in the bay.
5.2.2.Efficiencies of proposed channels under continuous release
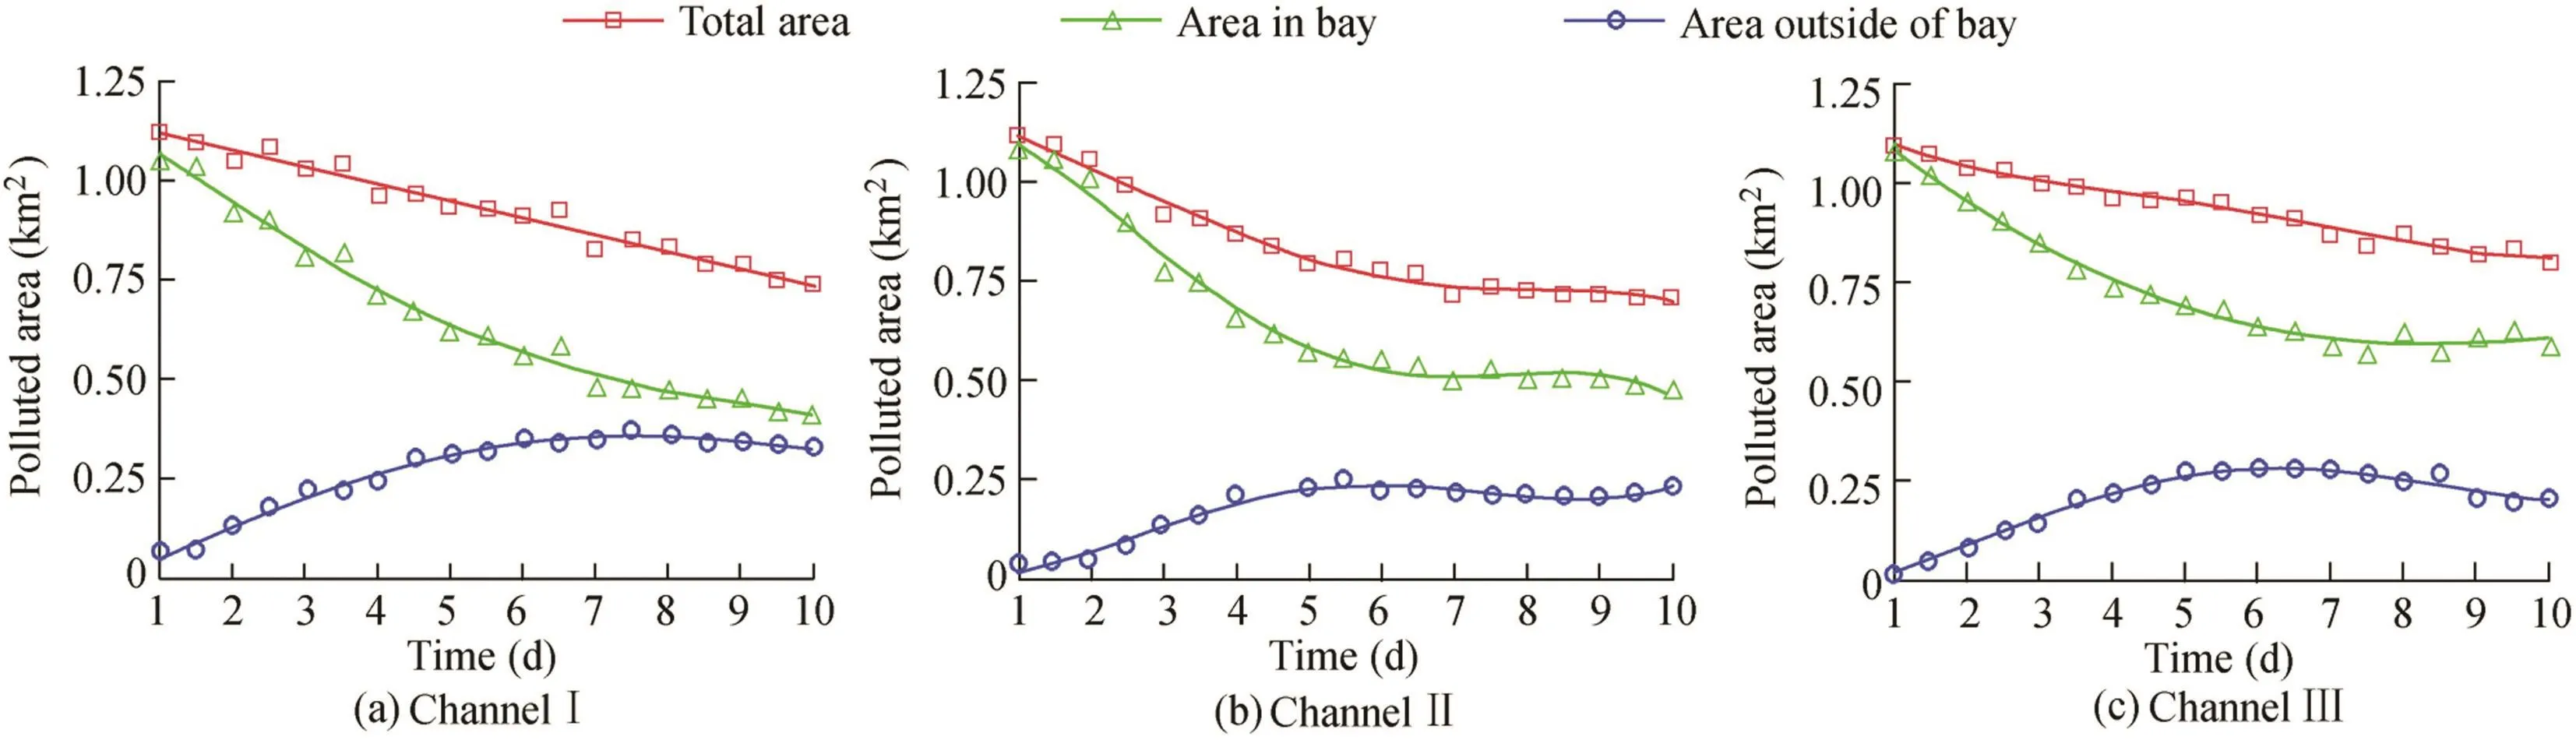
Fig.23.Temporal evolution of polluted area under disposable release with different channels.
The efficiencies of the proposed channels under continuous release conditions were numerically studied.The same setup as that in section 5.1.2 was applied.Fig.24 shows the snapshots of the particle distribution after the implementation of channel I.As time went on,more and more particles gathered in Tangdao Bay,and the number of particles outside the bay also increased due to the existence of channel I.Compared with the case without channels,more particles were pushed out of the bay gradually by the current circulation caused by the proposed channel.It was found that the particles that flowed out of the bay through the applied channel were more than those that flowed through the mouth of the bay,as demonstrated in Fig.24.Nevertheless,compared with the amount of the particles staying in the bay,the percent of the particles leaving the bay was still low when the particles were continuously released into the bay.
Figs.25 and 26 present the snapshots of the particle distributions at different time instances for channel II and channel III,respectively.Similar findings can be drawn from Figs.25 and 26 as from the results shown in Fig.24.It is interesting to learn that the positions of the channels will greatly affect the gathering positions of the released particles.The particles prefer to gather near the channels,possibly due to the newly formed circulation between the bay and the open sea through the channels.

Fig.24.Snapshots of particle distributions at different time instances with channel I.
In order to analyze the particle distribution and the seawater exchange ability,the particle ratio results in the bay are summarized for cases with the implementation of channels,as shown in Fig.27.When the computation time is less than 6 d,the particle ratios for all of the cases continue to decrease,indicating that more and more particles flow out the bay.Channel III seemingly has the best efficiency.Meanwhile,the efficiency of channel III decreases gradually just after 6 d.This is probably due to the fact that channel III is near the mouth of the bay.The particles at the entrance can flow out of the bay very easily at the initial stage due to the enhanced circulation caused by the existence of channel III.After 6 d,with more and more particles released and gathered at the position close to channel III,channel III no longer has the advantage over the other two channels.The temporal evolution of the particle ratio for channel II shares a similar trend as that for channel III.Only channel I has a monotonous performance that can greatly reduce the percentage of particles residing inside the bay.
Fig.28 demonstrates the temporal evolution of the polluted area for different conditions.When the particles are released continuously,the polluted area continues to increase and the density of particles is also increased for these three situations.The increasing rate of the polluted area for the channel I case is little higher than that of the other two cases.This indicates that the overall particle density for the channel I case is lower and the corresponding water purification capability is higher.Based on the simulation results presented in previous sections,the implementation of the channels connecting the bay and open sea can enhance the water exchange capability and reduce the degree of pollution in the bay to some extent.Among the implemented channels,channel I is the most stable and efficient.Under continuous release conditions,the pollution environment can be improved to some extent by building channels.However,when pollution sources are releasing contaminants endlessly,it is hard to calculate and assess the residence time as it relates only to the particle trajectory at different times.Meanwhile,the severe pollution in the bay cannot be settled completely by the proposed improvement measures.Enforcement of the environmental protection laws is an essential prerequisite.
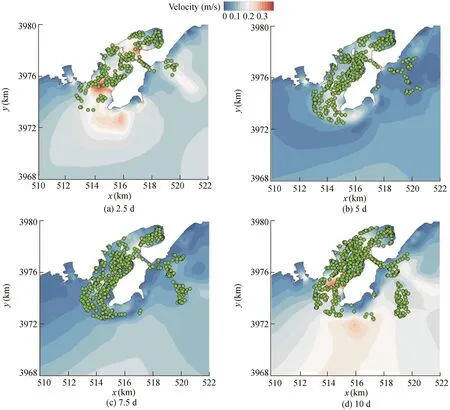
Fig.25.Snapshots of particle distributions at different time instances with channel II.
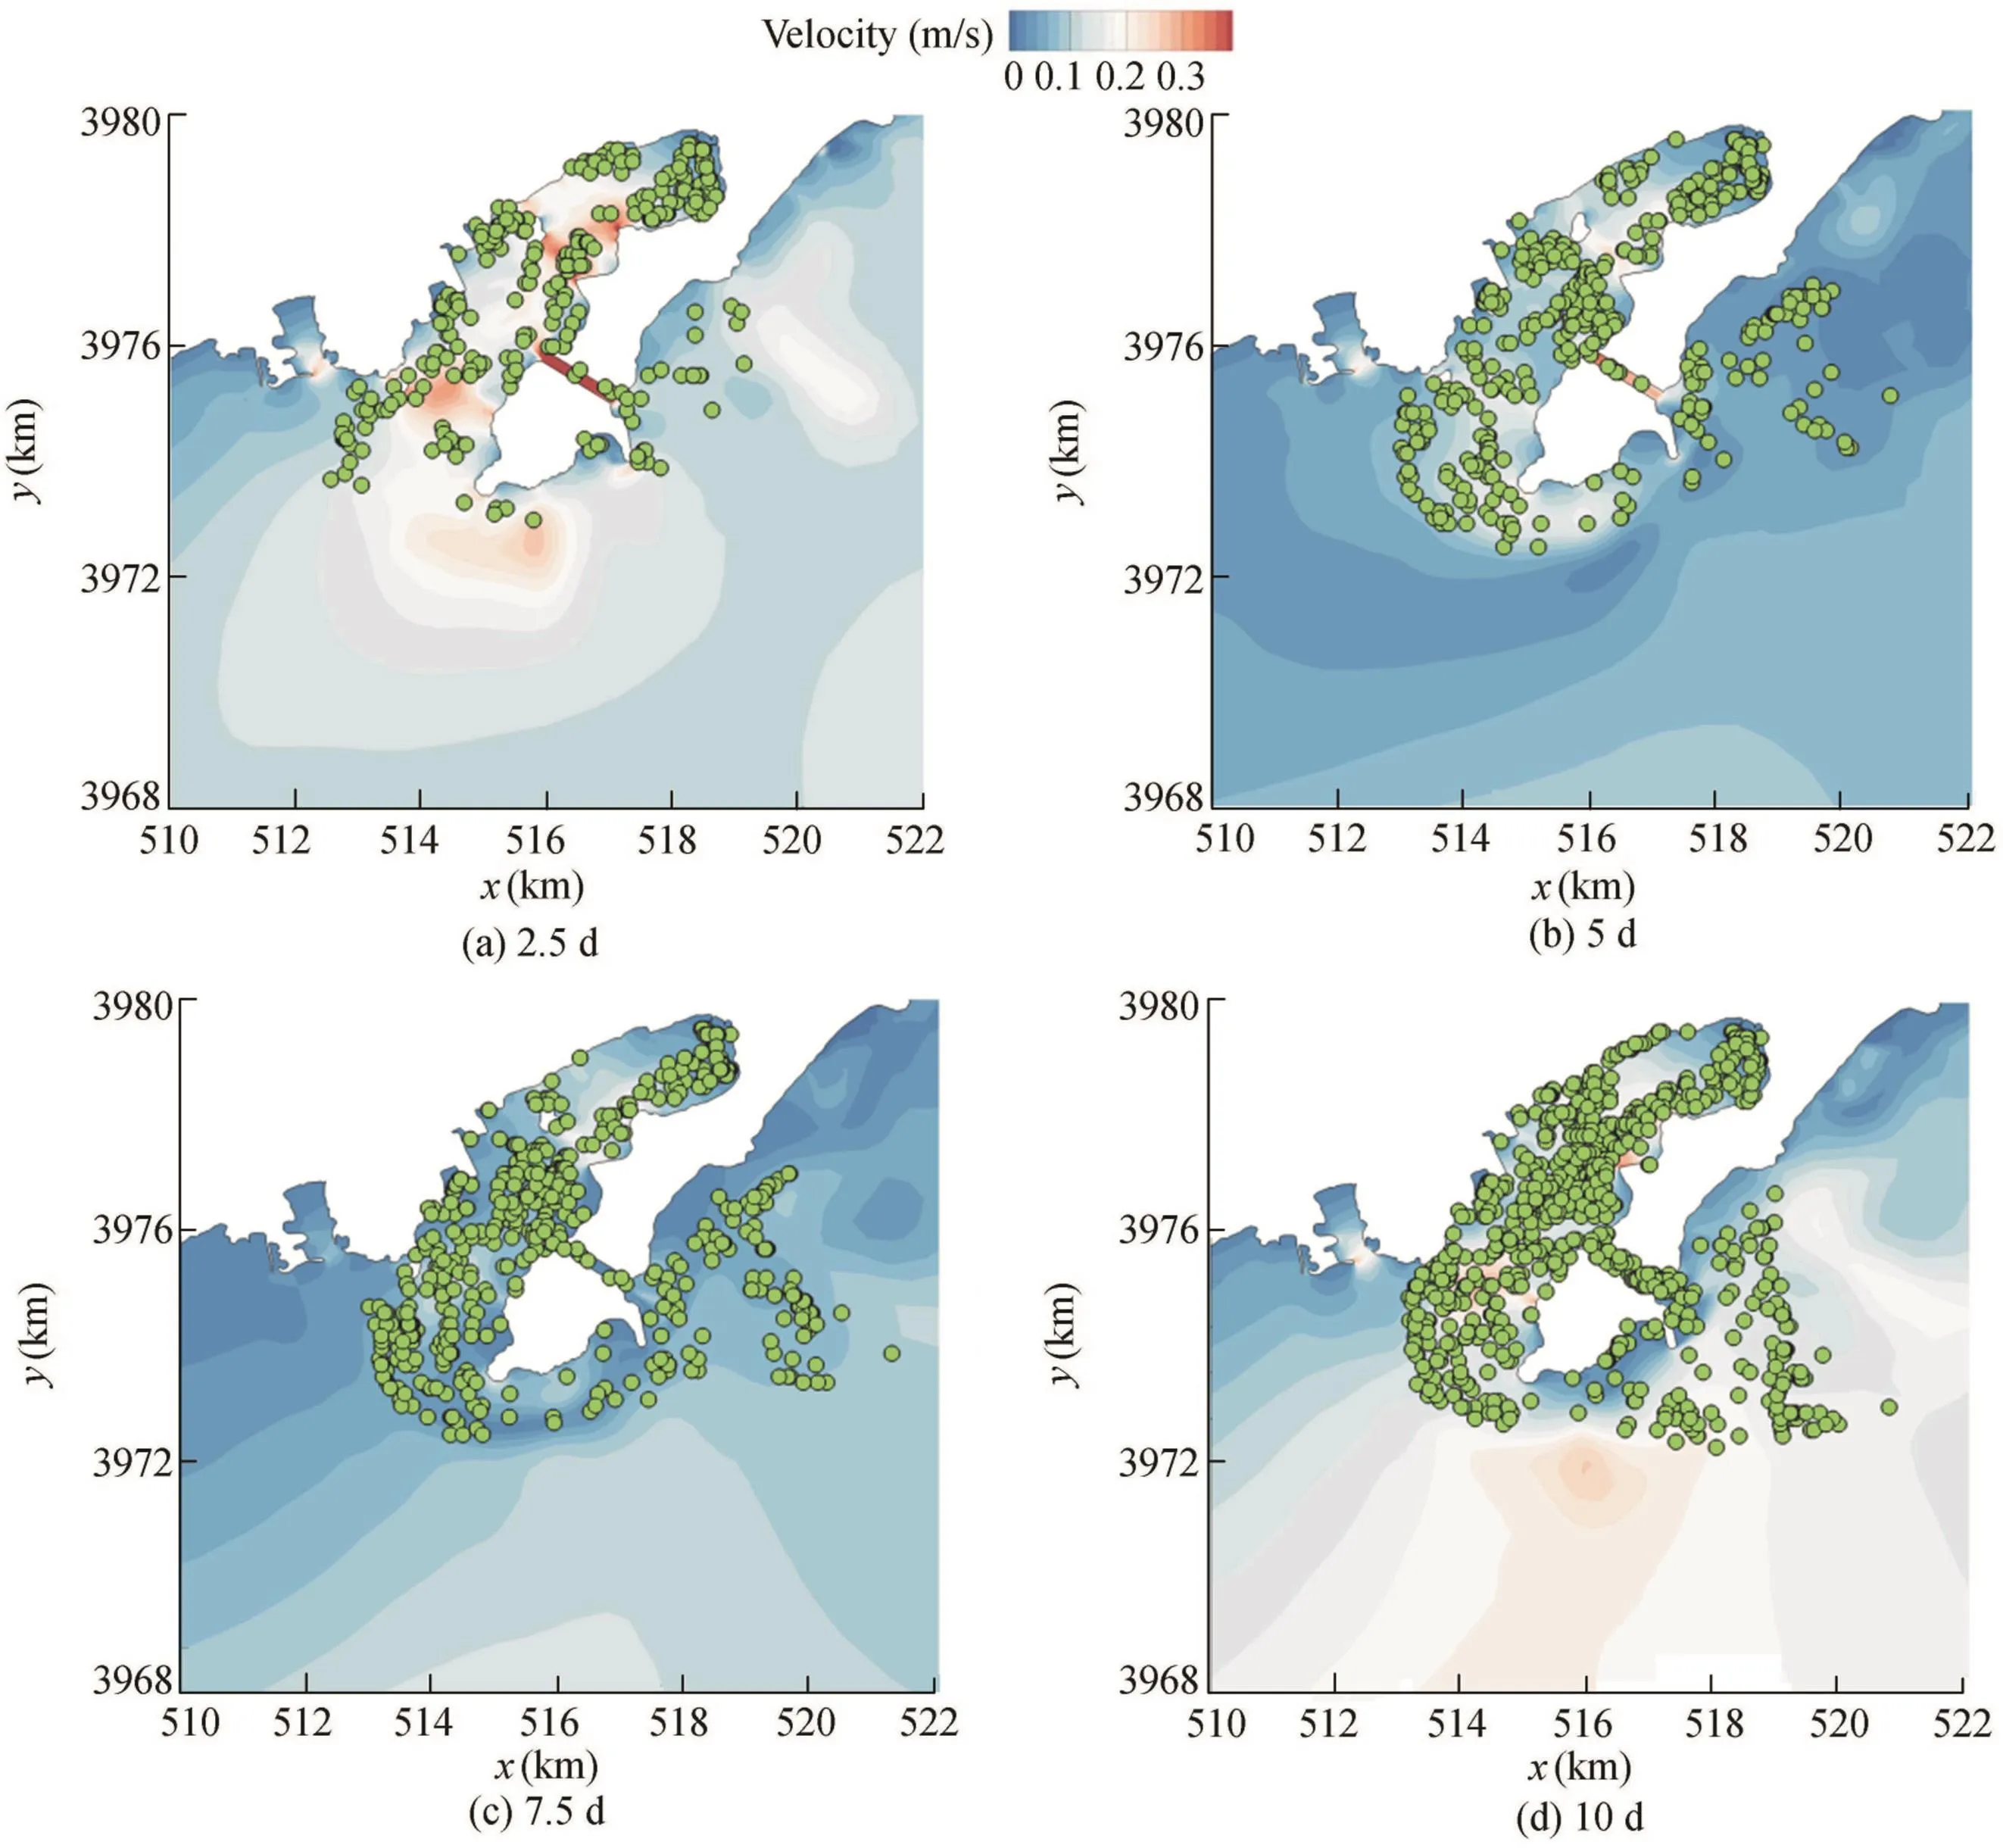
Fig.26.Snapshots of particle distributions at different time instances with channel III.

Fig.27.Temporal evolution of particle ratio under continuous release in bay.
6.Conclusions
Coupled with a 3D hydrodynamic model(FVCOM),a Lagrangian particle-tracking model was used to study the coastal pollution in Tangdao Bay,in China.The major conclusions can be summarized as follows:
(1)The reliability of the numerical model has been well calibrated by simulating the tidal flow in Tangdao Bay and the particle tracing trajectory in JZB.The predicted water elevations,velocities,and particle tracing trajectories have been proven to be in agreement with the measurement data.
(2)The severe coastal pollution in Tangdao Bay has been numerically simulated by releasing and tracking the particles in the bay in two different ways.The first method was to have the uniformly distributed particles released.The other way was to continuously release the particles at the selected eight sites in the bay.All of the simulation results indicate that the bay is suffering from a high level of pollution due to its low water exchange capability and long water residence time properties.The pollution level could become even worse if the pollutants are continuously discharged.
(3)Since the severe pollution in Tangdao Bay is mainly caused by the low water exchange capability and long residence time,in order to improve the situation and enhance the water purification rate in the bay,three different channels connecting the bay and open sea have been proposed as environmental improvement measures.Their effects on the water exchange capability have been numerically studied.It is determined that the implementation of the proposed channels can greatly enhance the water exchange capability and reduce the residence time,which can gradually reduce the percentage of the particles residing inside the bay.Channel I,at the top of the bay,has been shown to be the most stable and efficient in reducing the pollution level in the bay.The study findings are believed to be instructive and useful for future environmental policy makers.It is also anticipated that the numerical model in this paper can serve as an effective technological tool to study many emerging coastal environmental problems.
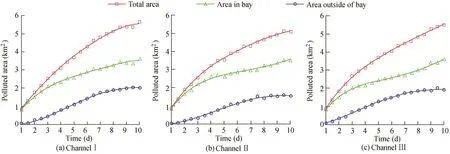
Fig.28.Temporal evolution of polluted area under continuous release with different channels.
Acknowledgements
The authors are grateful to Dr.C.S.Chen for his input on FVCOM.
References
Carpenter,S.R.,Caraco,N.F.,Correll,D.L.,Howarth,R.W.,Sharpley,A.N.,Smith,V.H.,1998.Nonpoint pollution of surface waters with phosphorus and nitrogen.Ecol.Appl.8(3),559-568.
Chen,C.S.,Liu,H.D.,Beardsley,R.C.,2003.An unstructured grid, finitevolume,three-dimensional,primitive equations ocean model:Application to coastal ocean and estuaries.J.Atmos.Ocean.Technol.20,159-185.https://doi.org/10.1175/1520-0426(2003)020<0159:augfvt>2.0.co;2.
Chen,C.S.,Beardsley,R.C.,Cowles,G.,2006.FVCOM User Manual,second ed.University of Massachusetts,Amherst.
Chen,D.X.,1993.Marine Atlas of the Bohai Sea,Yellow Sea and East China Sea:Hydrology.China Ocean Press,Beijing(in Chinese).
Delhez,E.J.M.,Campin,J.M.,Hirst,A.C.,Deleersnijder,E.,1999.Toward a general theory of the age in ocean modelling.Ocean Model.1(1),17-27.https://doi.org/10.1016/s1463-5003(99)00003-7.
Gong,W.P.,Shen,J.,Jia,J.J.,2008.The impact of humanactivities on the flushing properties ofa semi-enclosed lagoon:Xiaohai,Hainan,China.Mar.Environ.Res.65(1),62-76.https://doi.org/10.1016/j.marenvres.2007.08.001.
Kemp,W.M.,Boynton,W.R.,Adolf,J.E.,Boesch,D.F.,Boicourt,W.C.,Brush,G.,Cornwell,J.C.,Fisher,T.R.,Glibert,P.M.,Hagy,J.D.,et al.,2005.Eutrophication of Chesapeake Bay:Historical trends and ecological interactions.Mar.Ecol.Prog.Ser.303,1-29.https://doi.org/10.3354/meps303001.
Korotenko,K.A.,Mamedov,R.M.,Kontar,A.E.,Korotenko,L.A.,2004.Particle tracking method in the approach for prediction of oil slick transport in the sea:Modelling oil pollution resulting from river input.J.Mar.Syst.48(1-4),159-170.https://doi.org/10.1016/j.jmarsys.2003.11.023.
Kraufvelin,P.,Sinisalo,B.,Lepp¨akoski,E.,Mattila,J.,Bonsdorff,E.,2001.Changes in zoobenthic community structure after pollution abatement from fish farms in the Archipelago Sea(N.Baltic Sea).Mar.Environ.Res.51(3),229-245.https://doi.org/10.1016/s0141-1136(00)00101-x.
Li,Y.S.,Chen,X.J.,Chen,C.S.,Ge,J.Z.,Ji,R.B.,Tian,R.C.,Xue,P.F.,Xu,L.X.,2014.Dispersal and survival of chub mackerel(Scomber Japonicus)larvae in the East China Sea.Ecol.Model.283,70-84.https://doi.org/10.1016/j.ecolmodel.2014.03.016.
Liu,W.C.,Chen,W.B.,Cheng,R.T.,Hsu,M.H.,Kuo,A.Y.,2007.Modeling the in fluence of river discharge on salt intrusion and residual circulation in Danshuei River Estuary,Taiwan.Continent.Shelf Res.27(7),900-921.https://doi.org/10.1016/j.csr.2006.12.005.
Liu,Z.,Hao,W.,Liu,G.S.,Zhang,J.,2004.Simulation of water exchange in Jiaozhou Bay by average residence time approach.Estuarine.Coast.Shelf Sci.61(1),25-35.https://doi.org/10.1016/j.ecss.2004.04.009.
Marinone,S.G.,Lavin,M.F.,Par′es-Sierra,A.,2011.A quantitative characterization of the seasonal Lagrangian circulation of the Gulf of California from a three-dimensional numerical model.Continent.Shelf Res.31(14),1420-1426.https://doi.org/10.1016/j.csr.2011.05.014.
Murray,A.G.,Gillibrand,P.A.,2006.Modelling salmon lice dispersal in loch Torridon,Scotland.Mar.Pollut.Bull.53(1-4),128-135.https://doi.org/10.1016/j.marpolbul.2005.09.013.
Nakano,M.,Povinec,P.P.,2003.Oceanic general circulation model for the assessment of the distribution of137Cs in the world ocean.Deep Sea Res.Part II Top.Stud.Oceanogr.50(17-21),2803-2816.https://doi.org/10.1016/S0967-0645(03)00149-8.
Peri′a~nez,R.,Elliott,A.J.,2002.A particle-tracking method for simulating the dispersion of non-conservative radionuclides in coastal waters.J.Environ.Radioact.58(1),13-33.https://doi.org/10.1016/s0265-931x(01)00028-5.
Peri′a~nez,R.,Pascual-Granged,A.,2008.Modelling surface radioactive,chemical and oil spills in the Strait of Gibraltar.Comput.Geosci.34(2),163-180.https://doi.org/10.1016/j.cageo.2007.02.002.
Tilburg,C.E.,Dittel,A.I.,Epifanio,C.E.,2007.Retention of crab larvae in a coastal null zone.Estuarine.Coast.Shelf Sci.72(4),570-578.https://doi.org/10.1016/j.ecss.2006.11.030.
Wang,P.C.,Zhang,X.Q.,Zhao,Q.,Shi,M.Z.,2013.Numerical study of water age in fluenced by tide and runoff in Daliaohe Estuary in China.J.Hydrodyn.25(1),39-47.https://doi.org/10.1016/S1001-6058(13)60336-4.
Wang,S.D.,Shen,Y.M.,Zheng,Y.H.,2005.Two-dimensional numerical simulation for transport and fate of oil spills in seas.Ocean Eng.32(13),1556-1571.https://doi.org/10.1016/j.oceaneng.2004.12.010.
Xiao,Y.,Cheng,H.K.,Tang,H.W.,Li,Z.W.,2015.Three-dimensional numerical simulation of tidal current in offshore area of Haizhou Bay.J.Hohai Uni.(Natural Sciences)43(5),480-488.https://doi.org/10.3876/j.issn.1000-1980.2015.05.013.
Xiao,Z.J.,Zhao,H.T.,Zhu,X.K.,2011.The marine pollution of Tangdao Bay and it shows no correlation with Jiaozhou Bay.In:Proceedings of 2011 International Conference on Remote Sensing,Environment and Transportation Engineering.IEEE,Nanjing,pp.55-58.
Zhao,E.J.,Shi,B.,Zhang,J.,Liu,J.,2014.Numerical study of water dynamic exchange and improvement measure for Tangdao Bay.Trans.Oceanol.Limnol.3,44-50(in Chinese).
杂志排行

Water Science and Engineering的其它文章
- Understanding groundwater table using a statistical model
- Application of a water quality model for determining instream aeration station location and operational rules:A case study
- Influence of pH on short-cut denitrifying phosphorus removal
- Effects of elevated atmospheric CO2and nitrogen fertilization on nitrogen cycling in experimental riparian wetlands
- A simplified physically-based breach model for a high concrete-faced rock fill dam:A case study
- Effect of trapezoidal collars as a scour countermeasure around wing-wall abutments