Understanding groundwater table using a statistical model
2018-05-11ShaofngYanShuangYuYubaiWucfngPanJiagnDong
Shao-fng Yan,Shuang-n Yu*,Yu-bai Wuc,D-fng Pan,Jia-gn Dong
aKey Laboratory of Efficient Irrigation-Drainage and Agricultural Soil-Water Environment in Southern China,Ministry of Education,Hohai University,Nanjing 210098,China
bHubei Provincial Water Resources and Hydropower Planning Survey and Design Institute,Wuhan 430064,China
cJiangsu Water Conservancy Research Institute,Nanjing 210017,China
dJiangsu Coastal Water Conservancy Research Institute,Dongtai 224200,China
eJiangsu Province Hydrology and Water Resources Investigation Bureau,Nanjing 210008,China
1.Introduction
Farmland groundwater,as a major water source,serves an important function in the farmland system.Shallow groundwater is closely related to soil water,and therefore its depth,i.e.,groundwater table,significantly affects vegetation development and contaminant transport(Gong et al.,2006;Nayak et al.,2006).The upward movement of groundwater toward the crop root zone increases with the decrease in groundwater table,and the decrease in the amount of groundwater recharge to soil water will directly affect crop growth(Gong et al.,2006).Therefore,changes in the groundwater table can indicate effects of groundwater on agricultural land and public assets.Researchers have studied the rise in groundwater and have attempted to explain this phenomenon statistically(Ferdowsian et al.,2001).Furthermore,continuous monitoring of groundwater table is now technologically possible,and it is required for the effective use of any statistical water management model(Nayak et al.,2006).This continuous monitoring can also help administrators improve the utilization of groundwater.
Groundwater dynamics reflect a complex natural process,which is influenced by various factors,e.g.,climate,geology,and topography(Wang et al.,2012).Climatological conditions cause temporal fluctuations of groundwater to exhibit periodic and seasonal cycling(Yu et al.,2016).Groundwater cycles mainly occur in a vertical direction,with climatic(precipitation and evaporation)and human factors(surface water irrigation and groundwater exploitation)being considered factors of groundwater dynamics(Du et al.,2013).
Recent studies have mostly focused on long-term reduction in groundwater table because of global climate change,overexploitation,and other human activities.However,short-or mid-term fluctuations of groundwater table attributed to climate variation are also a considerable problem(Apaydin,2010).Some relatively short-term factors,like rainfall and evaporation,have obvious annual periodicity and result in the annually periodical fluctuation of the groundwater table.From the management point of view,estimation and prediction of short-period groundwater table dynamics are more efficient ways to plan for urgent action,for example,to prepare for natural disasters.
This study focused on a short-term fluctuation of groundwater table in the Jiangsu coastal plain,in China.A regression model is presented to describe the response of groundwater table to daily precipitation,evaporation,the river stage of the Liangduo River,and the tide level of the Yellow Sea,as well as to provide a practical model to estimate temporally and spatially variable groundwater recharge and consumption.The relationship of the two models is also discussed.The models are demonstrated and verified through calibration with a limited time-series of climate factors,river stage,tide level,and groundwater table data.This study reports on the potential of regression analysis in forecasting groundwater table fluctuations in an unconfined coastal aquifer in China.
2.Materials and methods
2.1.Study site description
The study site is located on the coastal plain of Dongtai City(120°07′E to 120°53′E and 32°33′N to 32°57′N)in Jiangsu Province,China(Fig.1).This low-lying flat area is located beside the Yellow Sea and its elevation ranges between 2.6 and 4.6 m.The coastal plain is located at the northern boundary of a northern subtropical zone.The area is dominated by a subtropical moist monsoon climate and affected by both a continental climate and a maritime climate(Hu et al.,1992;She et al.,2014).

Fig.1.Geographical location of study area.
The average annual temperature,average annual precipitation,and evaporation rate are approximately 15.0°C,1059.8 mm,and 1006.7 mm,respectively.The precipitation is generally concentrated in July,August,and September.The area receives more than 70%of its annual precipitation between May and September.Precipitation in winter and early spring is light.Most of the precipitation during the summer is in the form of local showers and thunderstorms(Table 1).During the study period in 2013,the annual mean precipitation was approximately 859 mm.The maximum precipitation was recorded in June before it gradually decreased.The annual evaporation was approximately 651.5 mm,which was lower than the annual precipitation.Both the precipitation and evaporation levels were lower than the average annual levels in 2013.
2.2.Experiment design
A farmland covering an area of 50 m×150 m was selected as a typical site with a shallow groundwater table to study the groundwater dynamics during different seasons.The farmland was bulldozed by machine to make sure the land was flat and there was no vegetation in the farmland.The farmland(120°52′44′′E,32°51′02′′N)is approximately 5 km away from the Yellow Sea and 2 km away from the Liangduo River.Twelve observation wells were constructed and installed at a depth of 5 m in the aquifer of the farmland.The plain sandy area has a highly permeable soil that consists of mealy sand and extremely fine sand particles.The phreatic surface is at a shallow depth.

Table 1Monthly precipitation,evaporation,and temperature in study area in 2013.
Data of daily precipitation,evaporation,river stage,and tide level were gathered from the Liangduo River Dam Monitoring Point of the Jiangsu Province Hydrology and Water Resources Investigation Bureau,which is located around 1.5 km northeast of the farmland.The bureau staff collected precipitation data using a rain gauge,and measured evaporation using an E601 evaporation pan.Both types of data were recorded manually.Mean daily river stage and tide data were recorded manually and automatically using a groundwater table monitoring system at the Liangduo River Dam.The recorded groundwater table data were based on the National Vertical Datum 1985.All data were collected from January 1,2013 to December 31,2013.
A manual monitoring logger was set to observe the daily groundwater table from the twelve wells across the area.The recorded groundwater table data were below the Yellow Sea 1985 height.The values of daily groundwater table of all wells were manually monitored and analyzed,and they had the same trend.The difference in water level variation range for the twelve wells was small,within 0-3 cm.The average values of the daily groundwater table of the twelve wells were obtained from January 1,2013 to December 31,2013.
2.3.Analysis methods
Regression analysis is a statistical process for estimating relationships between a key response variable and a number of other factors.This method is used to understand which among the independent variables are related to the dependent variable,as well as to explore the forms of these relationships.Regression analysis is widely used for estimation and prediction.
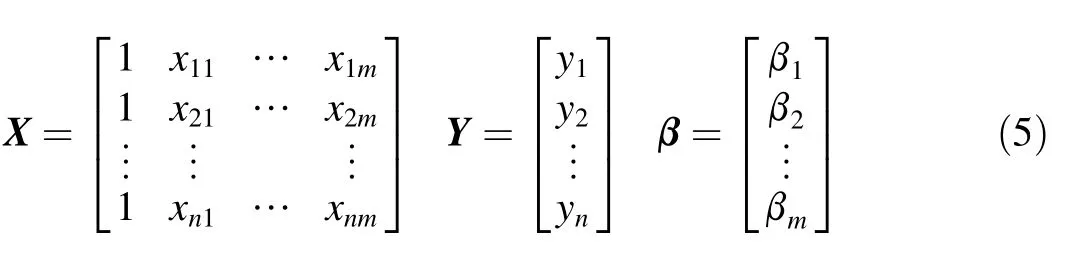
A linear regression model in the present case has the following form:

wherexi1,xi2,…,ximaremindependent variables and linearly related to the dependent variableyi;εiis a random error with εi~N(0,σ2),Cov(εi,εj)=0,i≠j,andi,j=1,2,…,n,where σ is variance;and β0,β1,…,βmare termed regression coefficients and they are estimated using the least squares method.Observational data should meet the model in Eq.(1).
We then established and optimized the objective function:

Thus,the estimates of βk(k=1,2,…,m)were transformed to solve an optimization problem,as shown in the following function:
Eq.(3)is a linear equation withm+1 variables.After arrangement,the canonical equation can be obtained as follows:

where
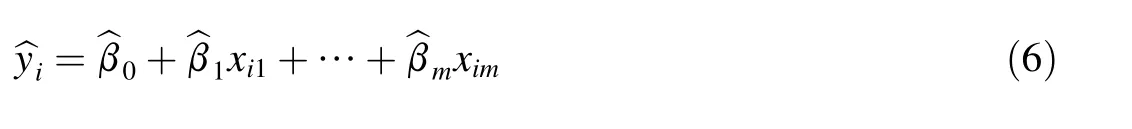
As long as (XTX)-1exists,the equation can be solved,and the solution is expressed as.is the function of samplexi1,xi2,…,xim,wherei=1,2,…,n,and in this studywas defined as the estimator of β,namely=(XTX)-1XTY.The regression variance is defined as follows:
The linear relationship between Yand X must also be tested.
Finally,an F test was used to judge whether the linear relationship between Y and X was significant or not(Wang et al.,2010).
Correlation coefficients were calculated to identify the factors that influence the different classes of groundwater hydrographs.Statistical Product and Service Solutions(SPSS)for Windows was used for statistical analysis.
3.Results and discussion
3.1.Relationship between groundwater table and factors
The average groundwater table in the study area was 173 cm.The shallowest recorded groundwater table was 30 cm(on August 26),whereas the deepest was 274 cm(on May 8).
The recharge of rainfall to groundwater and groundwater evaporation are important components of groundwater resources(Yang et al.,1997).Precipitation is a major source of groundwater recharge(Jan et al.,2013).Analyses of the effects of precipitation and evaporation on groundwater table fluctuations are shown in Fig.2 and Fig.3,respectively.The diachronic change of groundwater table is closely related to precipitation and evaporation.The groundwater table generally rises with precipitation and declines with increasing evaporation.
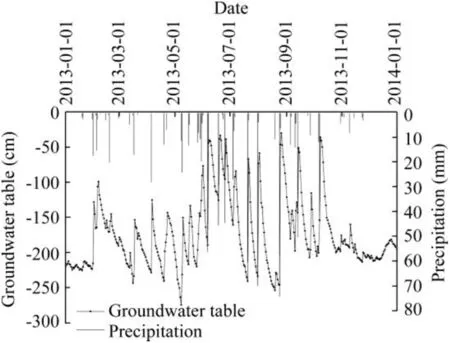
Fig.2.Groundwater table fluctuation with precipitation in 2013.
A typical groundwater hydrograph and daily precipitation variation are shown in Fig.2.The groundwater table curve exhibits multiple peaks and multiple valleys,and the fluctuation cycle is synchronized with precipitation events.Each curve peak of the groundwater table exhibits one-to-one correspondence with the curve peak of rainfall.The groundwater table exhibits quick responses to precipitation events.In January,November,and December,the amount of precipitation was small,and the groundwater table showed insignificant variations.From February to October,the sufficient amount of precipitation resulted in significant variations in groundwater table fluctuation.
During a non-rainfall period,because of evaporation,the groundwater table presented a downward trend and did not stop decreasing until the next precipitation event occurred.From March to October,the frequent precipitation events resulted in significant fluctuations in groundwater table.Fig.2 shows the fluctuation range related to precipitation,the largest of which reached 199 cm after heavy rain with 74.4-mm precipitation on August 24 and a day of precipitation in filtration.From November to December,the groundwater table fluctuated within a narrow range of 0-10 cm with the reduction in precipitation and decrease in evaporation(Figs.2 and 3).
In addition to climate factors,the groundwater table of the study area near the Liangduo River and the Yellow Sea may be affected by the river stage and tide level.Figs.4 and 5 show the curves of fluctuation of groundwater table with the river stage and tide level,respectively.

Fig.3.Groundwater table fluctuation with evaporation in 2013.

Fig.4.Groundwater table fluctuation with river stage in 2013.
Multiple linear regression analysis was conducted to investigate the relationships between precipitation,evaporation,river stage,tide level,and groundwater table(Fig.6).The multiple linear regression methods were used to select the best model to identify the effective factors in groundwater table(Praveena et al.,22011).An analysis of the coefficient of determination(R)was conducted to select the best model.
We analyzed the relationships bet ween precipitation,evaporation2,river stage,tide level,and groundwater table.The values ofRbetween the groundwater table,and precipitation,evaporation,river stage,and tide level ranged from 0.003 to 0.833.The output showed that precipitation,evaporation,and river stage were significant factors in the groundwater table in the study area(p<0.01,wherepis the probability value).The fitting curve showed a positive correlation between groundwater table and precipitation,as well as negative correlations between groundwater table,and evaporation and river stage.Estimating a dependent variable (precipitation)largely2contributed to obtaining groundwater table with the highestRvalue.The significance of factors in groundwater table were ranked in the following descending order:precipitation,evaporation,and river stage.The tide level did not affect the groundwater table(p>0.05).
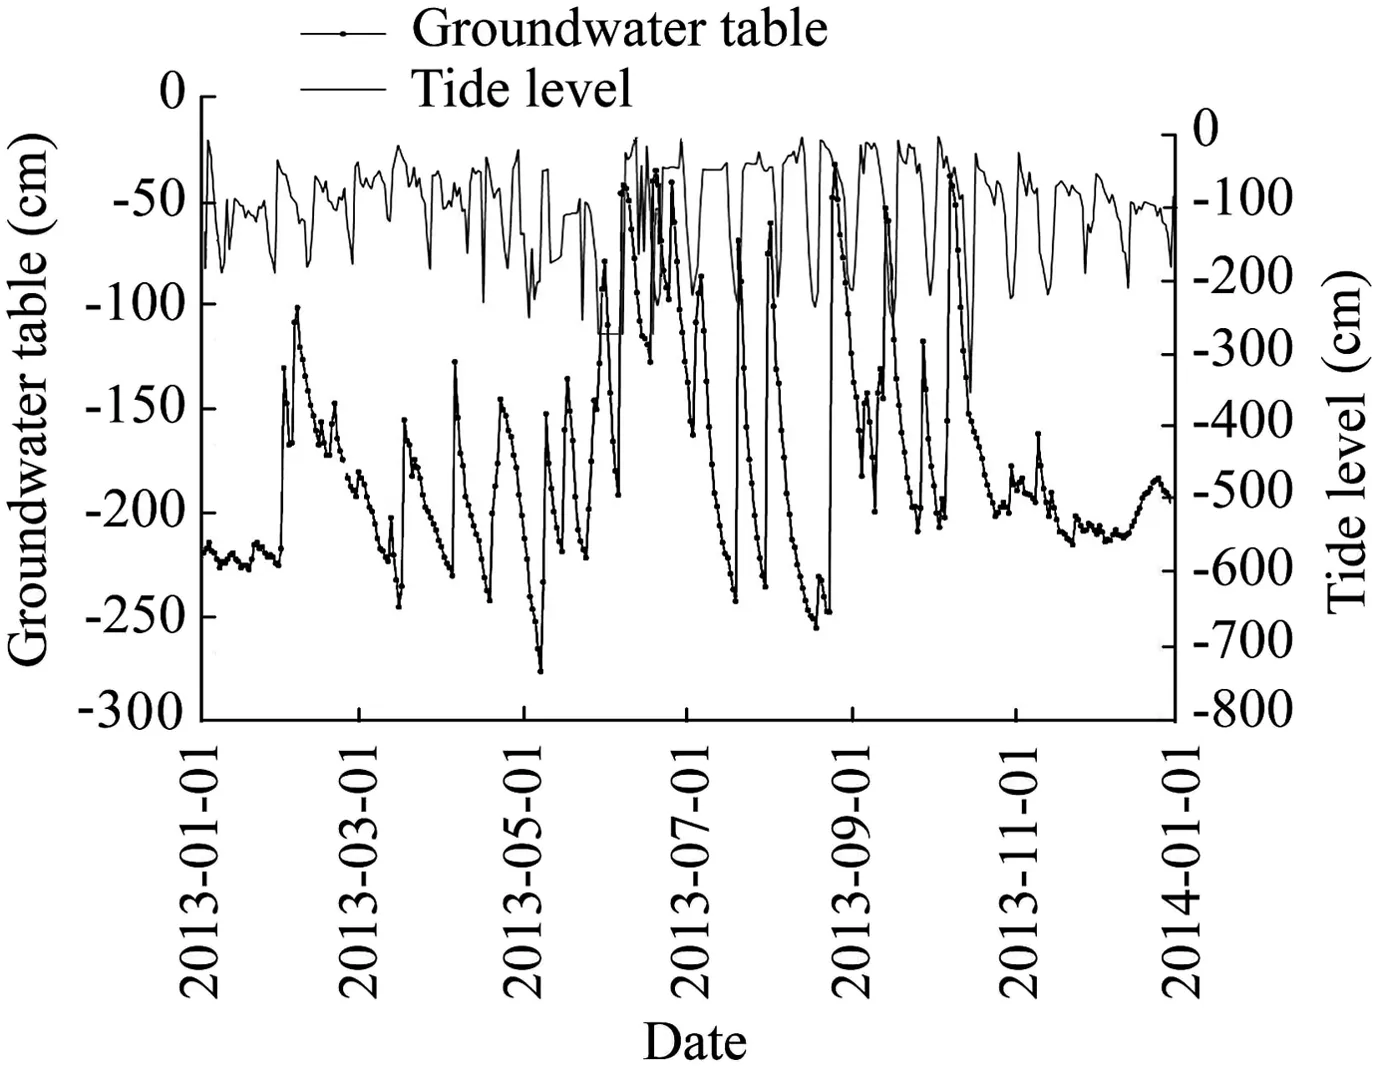
Fig.5.Groundwater table fluctuation with tide level in 2013.
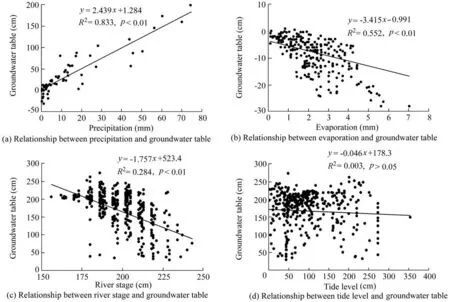
Fig.6.Linear regressions for precipitation,evaporation,river stage,tide level,and groundwater table.
Based on the analysis above,we know the relationships between groundwater table and factors including precipitation,evaporation,river stage,and tide level.The values ofR2between the groundwater table,and precipitation,evaporation,river stage,and tide level were 0.833(p<0.01),0.552(p<0.01),0.284(p<0.01),and 0.003(p>0.05),respectively.Precipitation,evaporation,and river stage are significant factors in groundwater table,while the tide level is not.According to the values ofR2between the groundwater table and its factors,we established a regression equation for the groundwater table,precipitation,evaporation,and river stage.
3.2.Regression model
3.2.1.Regression equation establishment
The model was calibrated to measure the daily groundwater table for 2013.Gis the daily groundwater table,andp,e,andrare precipitation,evaporation,and river stage,respectively,which were determined through linear regression in order to analyze and predict the groundwater table.From Table 2,we know that precipitation has the most significant influence on the groundwater table(the standardized coefficient is 0.889).
The regression equation was established as follows:

3.2.2.Test of regression equation
The data were analyzed using the SPSS software package for F test(Table 3).The output results showed that significance was 0.000(approximate value).The results showed that the regression equation is significant and suitable for estimation.With the condition of percentages greater than 99.9%,theindependent variables(p,e,andr)have a significant effect on the dependent variable(G).The value ofR2was calculated to be 0.841,indicating that the model provides a better fit to the real data.

Table 2Equation coefficients of fluctuation of groundwater table.

Table 3Analysis of variance.
3.3.Discussion
In our study,the groundwater table fluctuated with precipitation events.After precipitation,the groundwater table maintained a downward trend due to evaporation until the next precipitation event occurred.In December,the groundwater table increased without precipitation events.This may have been caused by the change of the river stage.The analysis indicated that the groundwater table fluctuation was affected by climate factors and the river nearby.Xi et al.(2010)found that the river flow could significantly influence groundwater table fluctuations near the riverbanks,and the river serves an important function in recharging groundwater.Zhou et al.(2006)found that tides affect the groundwater table in coastal aquifers near Beihai City.Zhou et al.(2013)found that the groundwater table fluctuation was sensitive to the hydraulic conductivity and specific yield,and the influences of rainfall and evaporation were negligible with regard to their research on Donghai Island.According to these studies,the groundwater table is controlled by different factors in different places.It is related to rivers or other water bodies nearby,topography,soil texture,climate factors,and other factors.
The tide level did not significantly affect the groundwater table(p>0.05).Subjected to oceanic oscillations such as tides and waves,groundwater table fluctuate in coastal unconfined aquifers.This dynamic behavior significantly affects water exchange between the land and ocean(Kong et al.,2015).Declines in the sea level lead to declines in the corresponding groundwater table of the surrounding areas(Salameh and El-Naser,2000).Sherif and Singh(1999)noted that a 500-mm rise in the Mediterranean Sea level will cause seawater intrusion of 9.0 km in the Nile Delta aquifer in Egypt and this same rise in sea water level in the Bay of Bengal will only cause an additional increase in seawater intrusion of 0.4 km,a vastly different result.We can see that sea water level affects inland groundwater in ways that depend on the distance to the shoreline,soil texture,and so on.In our study,the river stage had an impact on the groundwater table,but the tide level did not affect the groundwater table significantly.This may relate to the soil texture or the distance to the ocean shoreline.
Using values ofGfor groundwater table,andp,e,andrfor precipitation,evaporation,and river stage,a regression equation was established.The regression equation was found to be significant and suitable for estimation.Considering the water budget of groundwater storage,groundwater recharge and discharge should include water flow from upstream or river fluxes.Though the farmland was bulldozed flat,the influence from upstream or river fluxes should be included.To understand more accurately other effects on hydrodynamics in the study area,further research will be conducted.
This regression model is a first pass for the dynamics of the groundwater table.In order to strengthen the model,we will consider how the groundwater table may be influenced by different factors according to geographical location in the future.More observation wells will be installed with different distances to the sea and a longer time series of groundwater table will be studied.
4.Conclusions
A calibrated steady-state groundwater table model for a coastal plain in eastern China indicated that the groundwater table was affected by climate factors,river stage,and tide level in this study area.Based on a regression groundwater model and sensitivity and regression analyses,the following conclusions are drawn:
(1)The main factors affecting groundwater were the climate factors;the groundwater table showed quick responses to climate factors.The river stage of nearby rivers also affected the groundwater table.
(2)In the study area,precipitation,evaporation,and river stage were significant factors(p<0.01)affecting the groundwater table.Analysis of the results indicated that the groundwater table was especially s2ensitive to precipitation,with considerably high values ofR.The significance of the factors in the groundwater table were ranked in the following descending order:precipitation,evaporation,and river stage.
(3)A regression model was established.The model was calibrated to measure daily groundwater table for the year 2013 with climate factors and river stage data as inputs.Using the model,we determined the mechanisms of groundwater fluctuation in the study area.The linear relationship between groundwater table and the main factors was satisfied by the actual v2alues versus the simulated values of the groundwater table(R=0.841).
Acknowledgements
We thank the Jiangsu Province Hydrology and Water Resources Investigation Bureau for providing climate data.
References
Apaydin,A.,2010.Response of groundwater to climate variation:Fluctuations of groundwater level and well yields in the Halacli aquifer(Cankiri,Turkey).Environ.Monit.Assess.165(1-4),653-663.https://doi.org/10.1007/s10661-009-0976-8.
Du,W.,Wei,X.M.,Li,P.,Li,P.,Han,Y.Z.,2013.Dynamic evolutionary tendency of groundwater in irrigation district in changing environment and its driving factors.J.Drain.Irrig.Mach.Eng.31(11),993-999.https://doi.org/10.3969/j.issn.1674-8530.2013.11.014.
Ferdowsian,R.,Pannell,D.J.,McCarron,C.,Ryder,A.,Crossing,L.,2001.Explaining groundwater hydrographs:Separating atypical rainfall events from time trends.Soil Res.39(4),861-876.https://doi.org/10.1071/SR00037.
Gong,Z.N.,Gong,H.L.,Deng,W.,Zhao,W.J.,2006.An overview of water movement in groundwater-soil-plant-atmosphere continuum with shallow water table.J.Agro-Environ.Sci.25(s1),365-373(in Chinese).
Hu,H.B.,Lin,W.D.,Zhang,J.C.,1992.The research of soil erosion regularities in Jiangsu coastal plain sandy area.J.Nanjing For.Univ.(Nat.Sci.Ed.)16(2),25-30.https://doi.org/10.3969/j.jssn.1000-2006.1992.02.006(in Chinese).
Jan,C.D.,Chen,T.H.,Huang,H.M.,2013.Analysis of rainfall-induced quick groundwater-level response by using a Kernel function.Paddy Water Environ.11(1-4),135-144.https://doi.org/10.1007/s10333-011-0299-6.
Kong,J.,Xin,P.,Hua,G.F.,Luo,Z.Y.,Shen,C.J.,Chen,D.,Li,L.,2015.Effects of vadose zone on groundwater table fluctuations in unconfined aquifers.J.Hydrol.528,397-407.https://doi.org/10.1016/j.jhydrol.2015.06.045.
Nayak,P.C.,Satyaji Rao,Y.R.,Sudheer,K.P.,2006.Groundwater level forecasting in a shallow aquifer using artificial neural network approach.Water Resour.Manag.20(1),77-90.https://doi.org/10.1007/s11269-006-4007-z.
Praveena,S.M.,Abdullah,M.H.,Bidin,K.,Aris,A.Z.,2011.Understanding of groundwater salinity using statistical modeling in a small tropical island,East Malaysia.Environmentalist 31(3),279-287.https://doi.org/10.1007/s10669-011-9332-y.
Salameh,E.,El-Naser,H.,2000.Changes in the Dead Sea level and their impacts on the surrounding groundwater bodies.Acta Hydrochim.Hydrobiol.28(1),24-33.https://doi.org/10.1002/(SICI)1521-401X(200001)28:1<24::AID-AHEH24>3.0.CO;2-6.
She,D.L.,Fei,Y.H.,Liu,Z.P.,Liu,D.D.,Shao,G.C.,2014.Soil erosion characteristics of ditch banks during reclamation of a saline/sodic soil in a coastal region of China:Field investigation and rainfall simulation.Catena 121(5),176-185.https://doi.org/10.1016/j.catena.2014.05.010.
Sherif,M.M.,Singh,V.P.,1999.Effect of climate change on sea water intrusion in coastal aquifers.Hydrol.Process.13(8),1277-1287.https://doi.org/10.1002/(SICI)1099-1085(19990615)13:8<1277::AID-HYP765>3.0.CO;2-W.
Wang,S.Q.,Song,X.F.,Wang,Q.X.,Xiao,G.Q.,Wang,Z.M.,Liu,X.,Wang,P.,2012.Shallow groundwater dynamics and origin of salinity at two sites in salinated and water-deficient region of North China Plain,China.Environ.Earth Sci.66(3),729-739.https://doi.org/10.1007/s12665-011-1280-9.
Wang,Y.N.,Gao,G.Q.,Cai,M.K.,2010.Dynamic prediction for groundwater level in Baoji Urban District based on multiple regression analysis.Journal.Water Resour.Archit.Eng.8(5),101-102(in Chinese).
Xi,H.Y.,Feng,Q.,Si,J.H.,Chang,Z.Q.,Cao,S.K.,2010.Impacts of river recharge on groundwater level and hydrochemistry in the lower reaches of Heihe River Watershed,northwestern China.Hydrogeol.J.18(3),791-801.https://doi.org/10.1007/s10040-009-0562-8.
Yang,J.F.,Li,T.B.,Li,Y.,1997.The application of zero flux plane method in groundwater resources evaluation in Shenyang area.World Geol.16(2),55-60(in Chinese).
Yu,X.,Ghasemizadeh,R.,Padilla,I.Y.,Kaeli,D.,Alshawabkeh,A.,2016.Patterns of temporal scaling of groundwater level fluctuation.J.Hydrol.536,485-495.https://doi.org/10.1016/j.jhydrol.2016.03.018.
Zhou,P.P.,Li,G.M.,Lu,Y.D.,Li,M.,2013.Numerical modeling of the effects of beach slope on water-table fluctuation in the unconfined aquifer of Donghai Island,China.Hydrogeol.J.22(2),383-396.https://doi.org/10.1007/s10040-013-1045-5.
Zhou,X.,Ruan,C.X.,Yang,Y.Y.,Fang,B.,Ou,Y.C.,2006.Tidal effects of groundwater levels in the coastal aquifers near Beihai,China.Environ.Geol.51(4),517-525.https://doi.org/10.1007/s00254-006-0348-4.
杂志排行

Water Science and Engineering的其它文章
- Application of a water quality model for determining instream aeration station location and operational rules:A case study
- Influence of pH on short-cut denitrifying phosphorus removal
- Numerical investigation of pollution transport and environmental improvement measures in a tidal bay based on a Lagrangian particle-tracking model
- Effects of elevated atmospheric CO2and nitrogen fertilization on nitrogen cycling in experimental riparian wetlands
- A simplified physically-based breach model for a high concrete-faced rock fill dam:A case study
- Effect of trapezoidal collars as a scour countermeasure around wing-wall abutments