Application of a water quality model for determining instream aeration station location and operational rules:A case study
2018-05-11CharlesMelching
Charles S.Melching
Melching Water Solutions LLC,Green field,WI 53221,USA
1.Introduction
In the U.S.,despite the fact that all industrial wastewater and nearly all domestic wastewater receive biological(secondary)treatment and a growing portion of the wastewater receives tertiary treatment,many rivers still suffer from low dissolved oxygen(DO)concentrations.In these cases,it may be necessary to introduce additional DO to the rivers.Instream aeration stations(IASs)have been used to improve DO concentrations since at least 1943,when an instream aerator was installed on the Flambeau River in Wisconsin(Tyler,1946).The presumption,in the early studies,was that in any river where secondary treatment of effluents is insufficient to achieve desired DO concentrations,instream aeration will be a more economical means than advanced wastewater treatment to achieve desired DO concentrations(Whipple et al.,1970).For example,in the 1970s,when the Illinois Pollution Control Board(IPCB)proposed to impose strict limits on biochemical oxygen demand(BOD)in the effluent from the Northside Water Reclamation Plant(WRP)(now known as the O'Brien WRP),the Metropolitan Water Reclamation District of Greater Chicago(MWRDGC)did a study to compare the relative effectiveness and cost of more stringent BOD limits versus instream aeration for improving DO concentrations.As a result of this study,the MWRDGC proposed to voluntarily install several IASs that would add oxygen directly to the river system in exchange for less stringent effluent limits on discharges from the O'Brien WRP.The IPCB agreed to this proposal and amended the effluent limits and discharge permits accordingly.In so doing,the IPCB recognized the evidence provided by the MWRDGC's study that the use of instream aeration could achieve the same DO results as more stringent effluent limits,but for roughly$100 million less.As wastewater treatment technology improved,the MWRDGC later added tertiary treatment processes to the O'Brien WRP such that for the three representative years examined in this study(water years 2001,2003,and 2008)the removal rate of carbonaceous BOD ranged between 96.7%and 97.0%,the removal rate of ammonia nitrogen ranged between 92.3%and 97.8%,and the removal rate of organic nitrogen ranged between 84.0%and 84.9%.Despite these high levels of reduction in organic loading it is still necessary to operate the IASs to meet DO standards because of the low slope,low velocity,and deep flow that limit natural reaeration and the effects of a limited number of combined sewer over flows each year.
Other regulatory agencies have similarly accepted the use of instream aeration as a supplement to secondary or tertiary treatment of wastewater toward the goal of achieving acceptable DO concentrations in receiving streams.This acceptance is owed in large part to detailed studies of artificial aeration of rivers done in New Jersey(Whipple et al.,1969,1970;Yu,1970;Hunter and Whipple,1970;Whipple and Yu,1971)and elsewhere(Amberg and Aspitarte,1969;Imhoff,1969).
In recent years,several studies have reviewed the effectiveness of instream aeration in improving the water quality in urban rivers in China,particularly heavily polluted rivers with so-calledblack-odor water.For example,Wang et al.(1999)did a pilot study on aeration in the Suzhou River in Shanghai using a pure oxygen aeration method.The results showed that pure oxygen aeration could reduce the chemical oxygen demand of the black-odor water by 19.5%-56%.Wang et al.(2012)noted that eight aerators were placed in the Qing River during the Beijing Asian Games in 1990,and these aerators caused the DO concentration to rise from 0 to 6 mg/L.Wang et al.(2012)also reported that the Shanghai Academy of Environmental Sciences did some experiments on aeration and bioremediation in a river.In these experiments,the DO concentration of a river that was initially in an anaerobic state increased significantly,the growth of indigenous aerobic microorganisms was well stimulated,and the removal rate of organic pollutants was increased by 10.7%-23%.Sheng et al.(2013)placed nine floating water wheels as aerators in a 23 km-long reach of the Dihe River in Changyi,Shandong Province.These aerators were run continuously for two months until the DO concentration in the river exceeded 3.5 mg/L,after which they were used as needed to bring the DO concentration to acceptable levels and to decrease operational costs.The average final DO concentration was around 3 mg/L,and,thus,the production of reduced sulfide was prevented,decreasing the odorous pollution.
In most cases,instream aeration is used to provide supplemental aeration,on a part-time,as needed basis at the most critical times of the year,as was the case for Sheng et al.(2013)after the desired DO range was achieved.Rinaldi and Soncini-Sessa(1978)developed an approach to optimally allocate aeration stations to achieve a specified DO standard during short,steady-state periods of low flow and high temperature.They applied this approach to the Rhine River Basin in Germany.The proposed approach yielded the number of aerators needed,the locations of the aerators,and the power capacity of the aerators.These features of the aeration system are a function of the DO increases necessary to achieve the fixed DO standard at all points of a given river reach while at the same time minimizing the total aeration cost.
Many researchers have used computer models to design systems of IASs to improve DO concentrations in impaired streams.Todd and Bedient(1985)evaluated instream aeration needs for Buffalo Bayou,a major stream in Houston,Texas,which was subject to critically low DO concentrations through much of its length during low- flow,high-temperature periods.Through computer modeling,they found that stream aeration that could achieve a DO concentration of 4 mg/L throughout the bayou with six IASs with a total capacity of 103 kW.Campolo et al.(2002)used a non-steady state advectiondispersion reaction equation to examine water quality management alternatives for improving DO concentrations in the Arno River in Italy,which was prone to low DO concentrations over a 25-km reach.They found that two IASs placed 5 km apart could bring the water to DO saturation would be sufficient to keep DO concentrations above 4 mg/L,which is required for fish survival.Houck et al.(1997)used STREAMDO IV(Zander and Love,1990)to evaluate the effectiveness of six water quality management alternatives to improve DO concentrations in the South Platte River downstream from Denver,Colorado.They found that the management alternative involving installation of both passive(lowhead drop structures)and active(IASs)aeration structures could potentially save$25 million to$65 million in capital costs with substantial savings in annual operational costs.
In stream aeration has been applied to parts of the Chicago Area Waterway System(CAWS)since the late 1970s.Diffused air system IASs were installed on the North Shore Channel(NSC)at Devon Avenue and on the North Branch Chicago River(NBCR)at Webster Avenue(Fig.1)and began operating on February 8,1979,and June 6,1980,respectively.This was done in response to the negotiations with the IPCB,discussed earlier.Later,between 1992 and 1993,the MWRDGC installed five sidestream elevated pool aeration(SEPA)stations along the Calumet River,Little Calumet River(north),and Calumet-Sag Channel to improve DO concentrations in these waterways on the south side of the Chicago area(Robison,1994).In the 2000s,a use attainability analysis(UAA)was initiated for the CAWS,including a revision of the DO standards for these waterways.Two modeling studies were performed to inform the decision making process for the UAA and associated revision of the DO standards.In the first study,Alp and Melching(2011)applied the DUFLOW model(STOWA,2000)developed for the CAWS for determining the size and location of IASs needed to meet a planning target of 90%attainment of a 5-mg/L DO standard in the north and south branches of the Chicago River.They found that four new IASs with oxygen supply capacities ranging from 30 to 80 g/s would be sufficient to meet the proposed target DO concentration 90%of the time.In the second study,Melching et al.(2013)determined a combination of new IASs and aerated flow transfers needed to achieve full attainment of the DO standards for the CAWS proposed by the Illinois Environmental Protection Agency(IEPA)as part of the UAA(note:these standards were later adopted by the IPCB in July 2015).It was found that 28 new IASs with maximum oxygen supply capacities of 80 or 100 g/s and aerated flow transfers at three locations in the CAWS would be needed to achieve the IEPA DO standards 100%of the time at all locations in the CAWS for two test water years:a wet year(2001)and a dry year(2003).

Fig.1.Sketch of study area.
As noted earlier,the Devon Avenue IAS is more than 35 years old and it shows the effects of wear and tear.Thus,in 2012 the MWRDGC initiated a modeling project to evaluate whether to rehabilitate or replace/relocate this station.The possibility of relocating the station was considered because it was generally thought that the Devon Avenue IAS was too close to the O'Brien WRP(3.5 km upstream,see Fig.1),and the relatively high DO concentration in the WRP effluent limits the effectiveness of the IAS.In the course of the evaluation of the rehabilitation or relocation of the IAS it was also determined that new operational guidance for the IAS should be developed.The current paper reports the results of evaluation of the appropriate location for the IAS and the development of operational guidance through the use of water quality modeling considering three test water years,2001,2003,and 2008,which represent a wet year,a dry year,and an extreme year,respectively(although detailed results for only one test year,2003,are presented,in order to save space).The effluent quality from the O'Brien WRP(the dominant source of pollutant loads to the NSC and NBCR)has remained essentially unchanged from the early 2000s to the present.
2.Methods
2.1.Water quality model
The DUFLOW model(STOWA,2000)was selected for modeling of the CAWS,and the MWRDGC entered into an agreement with Marquette University in 2000 to adapt the DUFLOW model for simulation of the hydraulics and water quality processes of the CAWS in response to unsteady flows.The DUFLOW model was selected because it offered a number of computational and practical advantages in 2000 compared to models developed by U.S.government agencies,for example,the Water Quality Analysis and Simulation Program Version 5(WASP5,Ambrose et al.,1993),developed by the U.S.Environmental Protection Agency(USEPA),and the branched Lagrangian transport model(BLTM,Jobson and Schoellhamer,1987;Jobson,1997),developed by the U.S.Geological Survey(USGS).These models required separate hydraulic and water quality models to be developed,whereas DUFLOW coupled the hydraulic and water quality models.DUFLOW also had been applied with great success to several European river systems(e.g.,Manache and Melching,2004).In the study of Manache and Melching(2004),DUFLOW was found to be computationally robust with few computational failures encountered over thousands of runs.Finally,DUFLOW's compatibility with geographical information systems(GIS)facilitated representation and display of the river system,its compatibility with Microsoft Windows facilitated ease of use and the import and export of input and results to and from Microsoft Excel,and its relatively low license cost made it affordable for many applications.
DUFLOW applications allow several options for the simulation of water quality in stream systems,including allowing the user to add relations for the simulation of additional water quality properties or constituents not originally included in the preprogrammed DUFLOW options.To simulate water quality in the CAWS,the DUFLOW water quality simulation option that add stheDiToro and Fitzpatrick(1993)sediment flux model to the WASP4 model(Ambrose et al.,1988)of constituent interactions in the water column is applied.DUFLOW distinguishes among transported material that flows with water,bottom materials that are not transported with the water flow,and pore water in bottom materials that are not transported but can be subject to similar water quality interactions to those in the water column.Flow movement and constituent transport and transformation are simulated with DUFLOW and constituent transport is defined by advection and dispersion.The flow simulation in DUFLOW is based on the one-dimensional(1D)partial differential equations that describe unsteady flow in open channels(de Saint-Venant equations).These equations are the mathematical translation of the laws of conservation of mass and momentum.
The DUFLOW model of the CAWS has been used to evaluate water quality management scenarios in the CAWS involving(a)supplemental aeration on the NBCR and SBCR(Alp and Melching,2011),(b) flow augmentation on the NSC(Alp et al.,2009),and(c)a combination of these for the South Fork of the South Branch(Bubbly Creek)(Alp and Melching,2006).The model was also used to determine the ineffectiveness of pollutant removal at selected gravity combined sewer over flows(CSOs)(Alp et al.,2007).Subsequently,the model was refined and used to develop an integrated strategy combining flow augmentation and instream aeration to achieve the applicable DO standards throughout the CAWS(Melching et al.,2013).From 2012 to 2014 the refined model was applied in the water quality modeling of the CAWS as part of the Great Lakes and Mississippi River Interbasin Study(GLMRIS)by the U.S.Army Corps of Engineers(USACE).The GLMRIS study involved simulating water quality in the CAWS and loads of pollutants to Lake Michigan in response to the No Project,Lakefront Separation,and Midsystem Separation scenarios for three test water years,and three levels of completion of the Tunnel and Reservoir Plan(TARP)(Melching et al.,2015).
The DUFLOW model of the CAWS was calibrated for water year 2001 and verified for water years 2003 and 2008.Complete details on the calibration and verification of the DUFLOW model of the CAWS can be found in Melching et al.(2010,2013)and Melching and Liang(2013).The relative root mean square error(RMSE),i.e.,RMSE divided by the range of the data,is a commonly used measure of the accuracy of water quality models.For example,in the Quality Assurance Project Plan for the Illinois River(in Arkansas and Oklahoma)Watershed Nutrient Modeling Development(Michael Baker Jr.,Inc.,2013)for the calibration and validation of the Environmental Fluid Dynamics Code(EFDC)applied to Lake Tenkiller(Oklahoma),the targets for acceptable calibration and verification were average relative RMSEs of±20%for DO.Table 1 lists the relative RMSEs of the DUFLOW model of the CAWS in the lower NSC and NBCR,which make up the study reach,in order to evaluate the effectiveness of the Devon Avenue(or alternative)IAS.All the relative RMSEs in Table 1 are substantially below the simulation quality target of 20%,with four of the twelve comparisons less than 10%and another three only slightly above 10%.Therefore,the DUFLOW model of the CAWS is well suited to the study detailed here.
2.2.Devon Avenue in stream aeration station
The existing Devon Avenue IAS delivers atmospheric oxygen to the NSC through porous,coarse bubble,ceramicdiffusers.Blowers located on the shore send atmospheric oxygen through a manifold system to the instream diffusers located near the bottom of the channel.Fig.2 shows the Devon Avenue IAS in operation and the manifold system can be seen on the banks of the channel.The water in the NSC is at least 3 m deep at Devon Avenue,which is sufficient for a reasonable oxygen transfer efficiency from the coarse bubbles to the water column(Wang et al.,2014).It is assumed that any new IAS would have a similar con figuration and performance efficiency in delivering oxygen as the Devon Avenue IAS as determined by Polls et al.(1982).
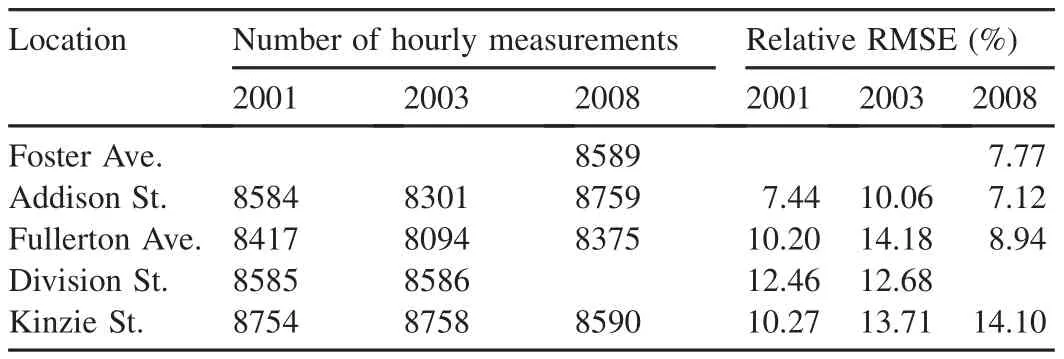
Table 1Relative RMSEs of simulated and measured hourly DO concentrations for specified number of hourly measurements for locations on NSC and NBCR.
2.3.Procedure for locating in stream aeration station
In order to evaluate the effectiveness of a rehabilitated IAS at Devon Avenue or a new IAS at several alternative locations,a preliminary operational protocol must be considered.Once the best location for the IAS is determined,the operational protocol can be refined as discussed in Section Procedure for determining operational guidance.The original operational protocol for the Devon Avenue IAS is based on DO concentrations measured at the North Branch Pumping Station(NBPS),3.1 km downstream from the Devon Avenue IAS(0.3 km downstream from the junction of the NSC and NBCR).The blowers at the Devon Avenue IAS are operated based on DO concentrations observed at the NBPS as follows:
(1)All blowers are off whenever DO concentrations are greater than 5.5 mg/L(i.e.,1.5 mg/L above the original DO standard for the NSC and NBCR downstream from the O'Brien WRP).
(2)One blower is turned on if DO concentration falls below 5.5 mg/L and remains on until the DO concentration is above 5.5 mg/L,but for at least 2 h.
(3)A second blower is turned on if DO concentration falls below 5.0 mg/L and remains on until the DO concentration is above 5.0 mg/L,but for at least 2 h.
(4)A third blower is turned on if DO concentration falls below 4.5 mg/L and remains on until the DO concentration is above 4.5 mg/L,but for at least 2 h.
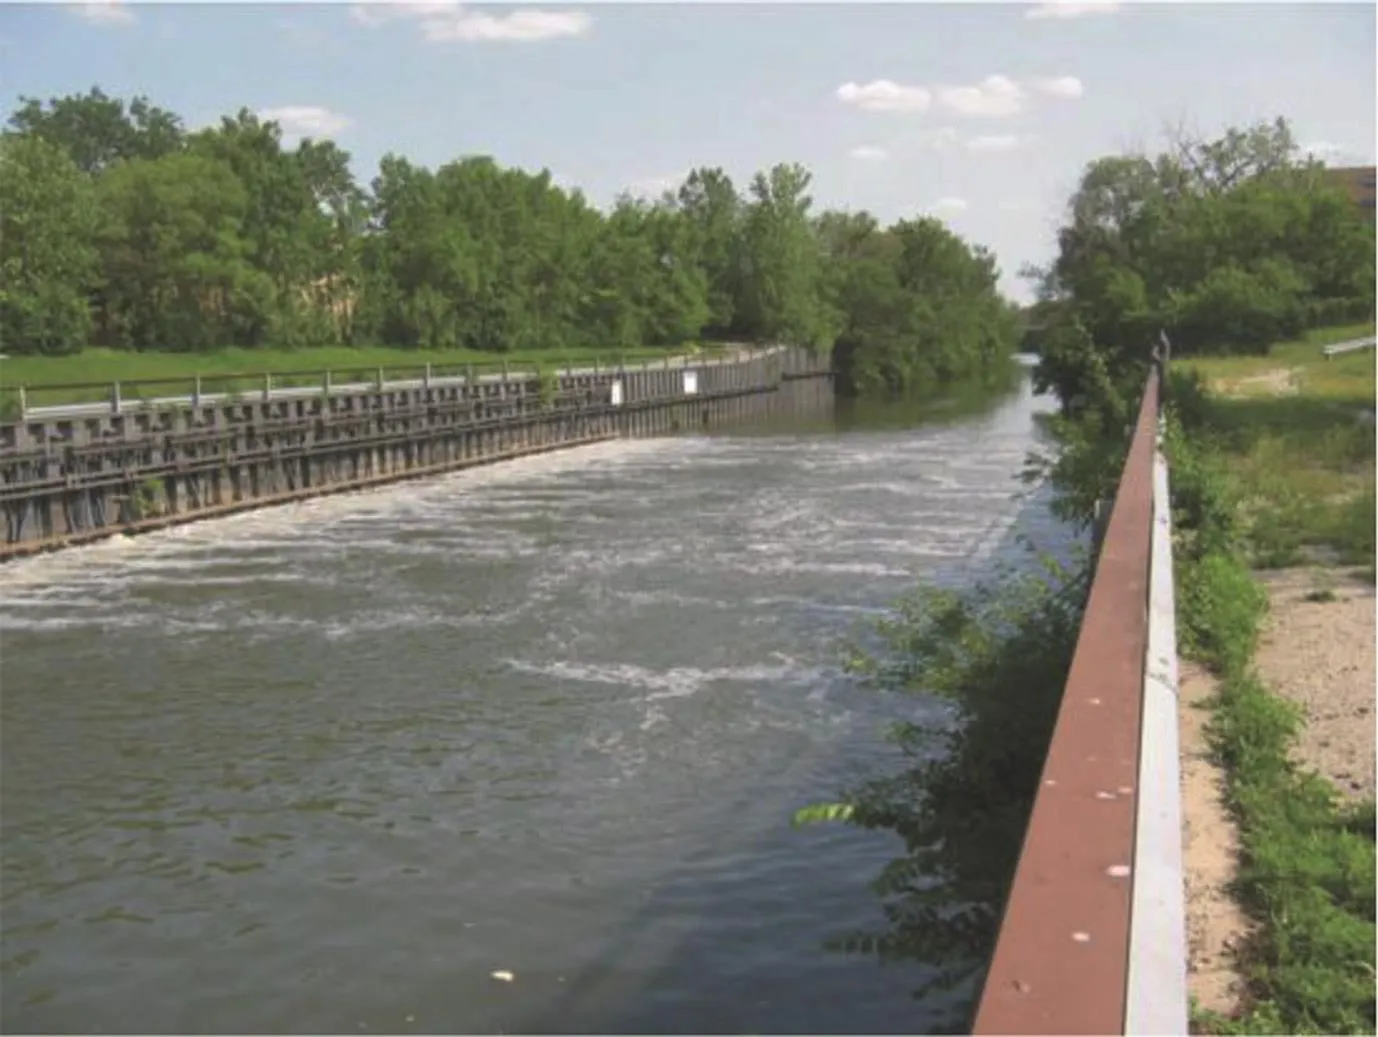
Fig.2.Devon Avenue IAS in operation.
The Devon Avenue IAS was also operated to supplement the Webster Avenue IAS in improving DO concentrations downstream in the NBCR at Ohio Street(the monitoring point for operation of the Webster Avenue IAS near the junction with the Chicago River main stem and south branch,13.8 km downstream of the Devon Avenue IAS and 0.45 km upstream from Kinzie Street).This supplemental operation of the Devon Avenue IAS occurs any time three blowers are required at the Webster Avenue IAS,and consists of the following modified blower operational protocol at the Devon Avenue IAS:
(1)If DO concentration at the NBPS is less than 7.5 mg/L,one blower is operated.
(2)If DO concentration at the NBPS is less than 6.5 mg/L,two blowers are operated.
(3)If DO concentration at the NBPS is less than 6.0 mg/L,three blowers are operated.
The supplemental operation of the Devon Avenue IAS to improve DO concentrations at Ohio Street may have been more frequent than the operation of the Devon Avenue IAS to improve DO concentrations locally at the NBPS.For example,in water year 2008 the Devon Avenue IAS was operated more frequently to raise DO concentrations downstream from Webster Avenue at Ohio Street than it was to mitigate DO problems at the NBPS(2675 h vs.1080 h).The reason for this pattern is the selection of the NBPS as the location for the operational monitor for the IAS.Both the measured and simulated DO concentrations at Foster Avenue(0.5 km upstream from the NBPS)indicate relatively high values,and,thus,infrequent need for Devon Avenue IAS operation.However,further down the NBCR at Fullerton Avenue(8.5 km downstream of the Devon Avenue IAS and 0.8 km upstream of the Webster Avenue IAS)low DO concentrations and violations of the DO standards are more frequent.Thus,in this study,the operations of a rehabilitated Devon Avenue IAS and of possible new IASs,replacing the Devon Avenue IAS,were determined using simulated DO concentrations at Fullerton Avenue.
The preliminary operational procedure for each of the evaluated IASs is based on the simulated DO concentrations at Fullerton Avenue.The operational procedure is similar to the original operational procedure for the Devon Avenue IAS considering the local DO concentrations at the NBPS,except that the monitoring point has been moved to Fullerton Avenue and the target DO concentrations are based on the new DO standards as follows:
(1)All blowers are off whenever DO concentrations are greater than 1.5 mg/L above the DO standard(i.e.,5.0 mg/L for August to February and 6.5 mg/L for March through July).
(2)One blower is turned on if the DO concentration falls below 1.5 mg/L above the DO standard(i.e.,5.0 mg/L for August to February and 6.5 mg/L for March through July)and remains on until the DO concentration is greater than 1.5 mg/L above the DO standard.
(3)A second blower is turned on if the DO concentration falls below 1.0 mg/L above the DO standard(i.e.,4.5 mg/L for August to February and 6.0 mg/L for March through July)and remains on until the DO concentration is greater than 1.0 mg/L above the DO standard.
(4)A third blower is turned on if the DO concentration falls below 0.5 mg/L above the DO standard(i.e.,4.0 mg/L for August to February and 5.5 mg/L for March through July)and remains on until the DO concentration is greater than 0.5 mg/L above the DO standard.
In this study,the rehabilitated Devon Avenue IAS or the potential new IASs were not specifically operated to supplement the operation of the Webster Avenue IAS in obtaining higher DO concentrations at the downstream end of the NBCR.However,it can be seen that using Fullerton Avenue as the monitoring point could effectively identify periods that would result in low DO at Ohio Street if it could not be counteracted upstream on the NBCR by revised operations of the rehabilitated/new upstream IAS.
In the simulations,the following steps were followed to determine the operations of the various IASs.First,a run was made with the Devon Avenue IAS(and all other potential IASs)turned off.The DO concentration results of this run at Fullerton Avenue were then examined to determine the periods for which one blower should be turned on.The DO load for the IAS was then computed based on the relations derived by Polls et al.(1982)for the case of one blower turned on,considering the DO concentration and flow upstream of the IAS.The DO load was then added to the model at the appropriate location,and a new run was made.The DO concentration results of this second run at Fullerton Avenue were then examined to determine the periods in which two blowers should be turned on. The DO loadfor the IAS was then computed based on the relations derived byPolls et al.(1982)for the cases of one or two blowers turned on as appropriate.The revised DO load was then added to the model at the appropriate location,and a new run was made.The DO concentration results of this third run at Fullerton Avenue were then examined to determine the periods for which three blowers should be turned on.The DO load for the IAS was then computed based on the relations derived by Polls et al.(1982)for the cases of one,two,or three blowers turned on,as appropriate.The revisedDOload was then added to the model atthe appropriate location, and a new run was made. The DOconcentration results of this fourth run at Fullerton Avenue werethen used to adjust theDOload delivered by theWebsterAvenueIAS. The revised DO load for the Webster Avenue IAS was theninput to the model, and the final DO concentrations throughoutthe NSC and NBCR downstream of the O'Brien WRP wereobtained and attainment of the DO standards at various locationsalong the NSC and NBCR was determined.2.4. Procedure for determining operational guidance
2.4.Procedure for determining operational guidance
The study(in Section 2.3)of the possible relocation of the Devon Avenue IAS using the preliminary operational procedure found that for the simulated DO concentrations at Fullerton Avenue there were many cases of simulated DO concentrations getting within 1.5 or 1.0 mg/L of the DO standard but not really getting close to the DO standard(i.e.,the lowest DO concentration may be more than 0.5 mg/L from the standard).Thus,a study to determine more appropriate operational rules for when to turn on one,two,or three blowers such that high levels of attainment of the DO standards could be achieved with a minimum amount of operational blower hours was done for the Devon Avenue and Webster Avenue IASs.
Table 2 lists the operational rules for the IASs evaluated in this study.As was done for the preliminary operational procedure,the operational rules were applied step-by-step in the simulations.That is,periods requiring one blower were determined from the simulation with no blowers turned on,then periods requiring two blowers were determined from the simulation with one blower turned on,and, finally,periods requiring three blowers were determined from the simulation with two blowers turned on.Furthermore,the full operations for the Devon Avenue IAS were determined first,and then the operations for the Webster Avenue IAS were determined.In the full study,water years 2001,2003,and 2008 were considered,but only the results for water years 2001 and 2003 will be discussed here because of space limitations.
3.Results and discussion
3.1.In stream aeration station location
The objective of this study was to evaluate the effectiveness of a rehabilitated IAS at Devon Avenue in meeting the DO standards for the NSC and NBCR using DO concentrations at Fullerton Avenue as the trigger for operation of this rehabilitated IAS.The performance of the rehabilitated IAS in meeting the DO standards was compared to that for proposed IASs located at 10 potential sites(listed in Table 3)between Devon Avenue and Fullerton Avenue.While the study considered conditions of three water years,only the results for water year 2003 are presented in detail here because the other years yielded similar results.
Fig.3 shows the number of hours not meeting the DO standards along the NSC and NBCR from Devon Avenue(river kilometer(RK)538.6,where RK 0 is the confluence between the Mississippi River and Illinois River near Alton,Illinois)on the NSC to Kinzie Street(RK 524.3)on the NBCR.All the IAS locations on the NSC(Devon Avenue IAS to Sch 10,see Table 3)yield similar levels of attainment downstream of the confluence of the NSC and NBCR(i.e.,RK 536.4),while all the IAS locations on the NBCR(Wilson Avenue to Diversey Street,see Table 3)yield similar levels of attainment at the downstream locations,and these levels of attainment are higher(i.e.,lower levels of non-attainment)than those achieved for the IAS locations on the NSC.The in flow from the upper NBCR(i.e.,upstream of the junction of the NSC and NBCR)results in a larger flow volume being aerated at Wilson Avenue and points downstream,which increases the DO load and improves attainment at downstream locations.However,as the proposed IAS moves downstream,the decrease in non-attainment at the locations downstream of the IAS is typically small,whereas the increase in nonattainment at locations upstream of the IAS is much larger.Thus,it does not seem reasonable to move the proposed IAS to downstream locations on the NSC or NBCR to obtain small improvements in attainment at locations downstream of the IAS in exchange for large decreases in attainment at locations upstream of the IAS.There seems to be only two reasonable locations for the IAS either at its current Devon Avenue location or at a point immediately downstream of the confluence of the NSC and upper NBCR.
Table 3 lists the number of hours during which one,two,or three blowers are operating and the total number of blower hours(equal to the sum of the number of blowers operating times the number of hours of such operations)for the various proposed IAS locations.Also listed in Table 1 is the actual number of hours during which one,two,or three blowers were operating in water year 2003.Because of the shorter travel time from the downstream potential IAS locations to the Fullerton Avenue DO monitoring point the DO concentration at Fullerton Avenue reacts more quickly to operation of blowers at these locations.Thus,fewer and fewer blowers need to operate at IASs at the downstream locations to yield similar results at Fullerton Avenue compared to IASs at more upstream locations,reducing the number of total blower hours and the operational cost for the proposed IAS.For example,a new IAS at Wilson Avenue would need to operate 646 blower hours less than a refurbished IAS at Devon Avenue(a 7.9%reduction;note:a 7%reduction was found for water year 2001).It was decided that this small decrease in operational cost did not offset the additional cost of building a new IAS,and so the Devon Avenue IAS is being rehabilitated.
Fig.4 shows the simulated DO concentrations at Fullerton Avenue for the cases with the Devon Avenue IAS turned off,operating as per the new protocol proposed in this study,and operating as per the actual operations in water year 2003.In this figure,the improvement in DO concentrations resulting from the new operational protocol compared to the original operating protocol can be seen.Specifically,using the new operational protocol,the number of hours not meeting the DO standards decreased from 101 to 25 h at Foster Avenue(RK 536.6),265 to 79 h at Addison Street(RK 533.2),825 to 208 h at FullertonAvenue(RK 530.1),713 to 121 h at Division Street(RM 526.7),and 854 to 174 h at Kinzie Street(RK 524.3).

Table 2Operational rules for IASs evaluated in this study.

Table 3Proposed IAS locations,number of hours with different numbers of blowers operating,and total number of blower hours for water year 2003.
3.2.Additional benefit of moving operational monitoring location

Fig.3.Number of hours not meeting DO standards along NSC and NBCR for IASs located at various points along these waterways for water year 2003.

Fig.4.Simulated DO concentrations at Fullerton Avenue for different operational conditions at Devon Avenue IAS for water year 2003.
In water year 2003,the number of hours with at least one blower operating is nearly identical for the actual operations(4824 h)and the operations based on the new protocol(4843 h).However,in this case the new protocol has identified a more efficient pattern of when to operate the blowers,such that attainment of the DO standards is substantially increased while blower hours are reduced by 1752(17.7%).The high use of three blowers in the actual operations compared to the operations based on the new protocol indicates the inefficiency of turning the blowers on at the Devon Avenue IAS when DO is low at Ohio Street and the Webster Avenue IAS has three blowers in operation.The travel time from Devon Avenue to Ohio Street during dry weather periods is nearly two days.Thus,operating the Devon Avenue IAS once low DO has occurred at Ohio Street is like“closing the barn door after the horse ran away”(i.e.,it is acting too late).Conversely,the periods that may result in low DO at Fullerton Avenue,identified in the new operational protocol,are also likely to cause low DO at Ohio Street.Therefore,operating the Devon Avenue IAS or an IAS at another alternative location to mitigate low DO at Fullerton Avenue effectively mitigates low DO at Ohio Street and nearby Kinzie Street.Thus,moving the operational monitoring location to Fullerton Avenue explains why the new operational protocol yields improved attainment of DO standards and reduced operation hours in comparison with the original operational protocol for the Devon Avenue IAS.
3.3.Operational guidance
Whereas the project evaluated new operational guidance for both the Devon Avenue and Webster Avenue IASs,this paper focuses on the details of the Devon Avenue IAS because of space limitations.Tables 4 and 5 list the number of hours with different numbers of blowers operating,the total number of blower hours,and the percent reduction in blower hours in comparison to rule 1 for water years 2001 and 2003,respectively,for the Devon Avenue IAS under the various operational rules.Tables 6 and 7 list the number of hours for which the DO concentrations do not meet the DO standards at the Foster Avenue,Addison Street,Fullerton Avenue,Division Street,and Kinzie Street monitoring sites for water years 2001 and 2003,respectively,under the various operational rules.Comparing the results for water years 2001 and 2003 in Tables 4 and 5 with those in Tables 6 and 7,it can be seen that reductions in the total number of blower hours on the order of 20%-30% result in only very small increases in nonattainment of the DO standards.In fact,for Foster Avenue and Addison Street,the reduced blower operation hours have almost no effect on attainment of the DO standards.

Table 4Number of hours with different numbers of blowers operating,total number of blower hours,and percent reduction in blower hours in comparison to rule 1 for water year 2001 for Devon Avenue IAS under various operational rules.
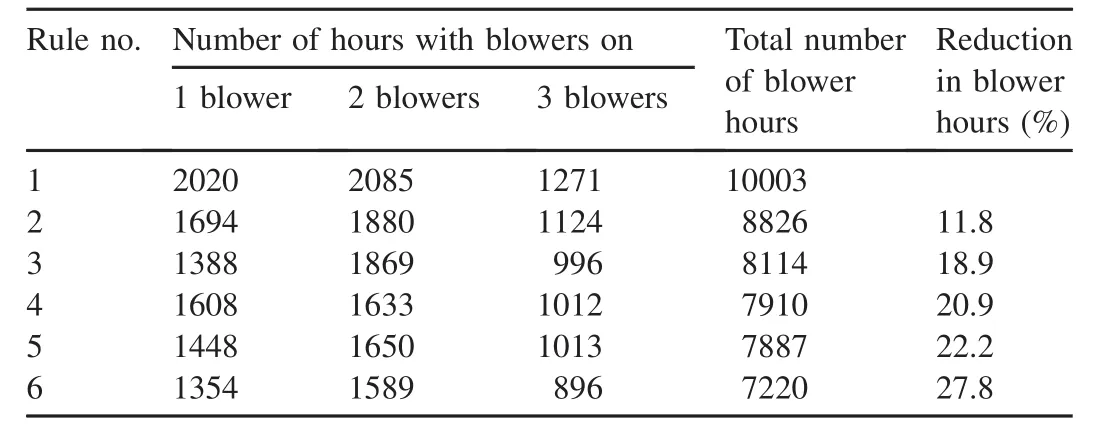
Table 5Number of hours with different numbers of blowers operating,total number of blower hours,and percent reduction in blower hours in comparison to rule 1 for water year 2003 for Devon Avenue IAS under various operational rules.
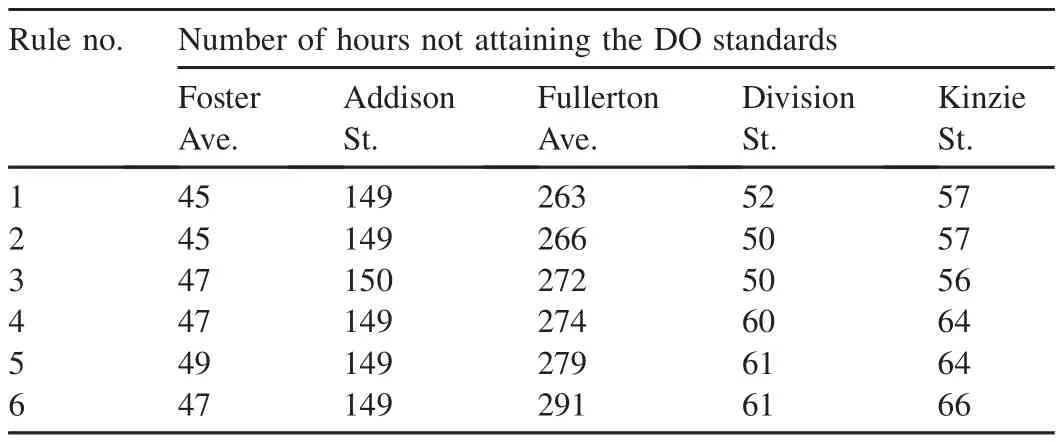
Table 6Number of hours with DO concentrations not attaining the DO standards at monitoring locations on North Shore Channel and North Branch Chicago River for water year 2001 under various operational rules.

Table 7Number of hours with DO concentrations not attaining the DO standards at monitoring locations on North Shore Channel and North Branch Chicago River for water year 2003 under various operational rules.
Attainment of the DO standards is most affected by changes in operation rules(total number of blower hours)at Fullerton Avenue.Comparing operational rules 1 to 6 indicates too large of an increase in non-attainment of the DO standards,especially for water year 2003.Tables 4 and 5 indicate that the largest reduction in blower hours occurs between operational rules 1 and 3 with only minor decreases in blower hours between operational rules 3 and 5.Thus,operational rule 3 seems to provide a good balance between reduced blower operation hours and high attainment of the DO standards.Furthermore,selecting this relatively more conservative operational protocol compared to operational rules 4 through 6 provides a safety factor to account for modeling uncertainties and inaccuracies.
The results of the evaluations of operational rules for the Devon Avenue and Webster Avenue IASs also revealed that little improvement in attainment of the DO standards was gained by switching from operation of two blowers to three.Thus,the operations of these stations have been changed such that only two blowers are turned on at any time.
4.Conclusions
Computer simulations of the water quality in the NSC and NBCR were used to determine whether the Devon Avenue IAS should be rehabilitated or relocated.Computer simulations were then used to determine operational guidance for the IAS.The findings of this study and subsequent actions based on this study are as follows:
(1)Using Fullerton Avenue as the monitoring point for the operation of a rehabilitated Devon Avenue IAS or a new IAS on the NSC or NBCR between Devon Avenue and Fullerton Avenue will yield effective mitigation of low DO concentrations downstream of this IAS.The Fullerton Avenue monitoring point will be used to operate the rehabilitated Devon Avenue IAS.
(2)The original practice of operating the Devon Avenue IAS to supplement the performance of the Webster Avenue IAS during periods when three blowers are operating at Webster Avenue is ineffective because of the nearly two-day travel time from Devon Avenue to Ohio Street(the trigger point for Webster Avenue IAS operation).This practice has been discontinued on the basis of the results of this study.
(3)The rehabilitated IAS at Devon Avenue would yield nearly identical attainment of the DO standards at points downstream as a new IAS located anywhere else on the NSC and slightly lower attainment compared to a new IAS located along the NBCR.However,the attainment between Devon Avenue IAS and any new IAS would be substantially less than it would be in this reach if the IAS remained at Devon Avenue.Thus,Devon Avenue is the best location for an IAS.
(4)In the determination of whether to rehabilitate the Devon Avenue IAS or build a new IAS,the results of this study indicate that the final comparison is between rehabilitating the Devon Avenue IAS or building a new IAS near Wilson Avenue.An IAS near Wilson Avenue would require slightly fewer blower operations(7%-8%for water years 2001 and 2003 in this study)than a refurbished IAS at Devon Avenue.This relatively modest savings in operational costs cannot offset the substantially increased construction cost to build a new station compared to rehabilitating the Devon Avenue IAS.Thus,the Devon Avenue IAS is being rehabilitated.
(5)The final operational guidance for the Devon Avenue and Webster Avenue IASs has been changed to the following:(a)All blowers are off whenever DO concentrations are at least 1.0 mg/L above the DO standard(i.e.,4.5 mg/L for August to February and 6.0 mg/L for March through July).(b)One blower is operated if the DO concentration falls below 1.0 mg/L above the DO standard(i.e.,4.5 mg/L for August to February and 6.0 mg/L for March through July)and remains on until the DO concentration is greater than 1.0 mg/L above the DO standard.(c)A second blower is operated if the DO concentration falls below 0.7 mg/L above the DO standard(i.e.,4.2 mg/L for August to February and 5.7 mg/L for March through July)and remains on until the DO concentration is greater than 0.7 mg/L above the DO standard.
References
Alp,E.,Melching,C.S.,2006.Calibration of a Model for Simulation of Water Quality during Unsteady Flow in the Chicago Waterway System and Application to Evaluate Use Attainability Analysis Remedial Actions.Institute for Urban Environmental Risk Management(Technical Report No.18),Marquette University,Milwaukee,and Research and Development Department(Report No.2006-84),Metropolitan Water Reclamation District of Greater Chicago,Chicago.
Alp,E.,Melching,C.S.,Zhang,H.,Lanyon,R.,2007.Effectiveness of combined sewer over flow treatment for dissolved oxygen improvement in the Chicago Waterways.Water Sci.Technol.56(1),215-222.https://doi.org/10.2166/wst.2007.455.
Alp,E.,Melching,C.S.,Lanyon,R.,2009.Flow augmentation for dissolved oxygen improvement in Chicago Waterways.In:Proceedings of World Environmental and Water Resources Congress.ASCE,Kansas City,pp.2823-2832.
Alp,E.,Melching,C.S.,2011.Allocation of supplementary aeration stations in the Chicago Waterway System for dissolved oxygen improvement.J.Environ.Manag.92(6),1577-1583.https://doi.org/10.1016/j.jenvman.2011.01.014.
Amberg,H.R.,Aspitarte,T.R.,1969.Aeration of streams with air and molecular oxygen.TAPPI 52(10),1866-1871.
Ambrose,R.B.,Wool,T.A.,Connolly,J.P.,Schanz,R.W.,1988.WASP4,a Hydrodynamic and Water Quality Model:Model Theory,User's Manual,and Programmer's Guide.U.S.Environmental Protection Agency(EPA/600/3-87-039),Athens,GA.
Ambrose,R.,Wool,T.A.,Martin,J.L.,1993.The Water-quality Analysis Simulation Program,WASP5.Environmental Research Laboratory,Athens,GA.
Campolo,M.,Andreussi,P.,Soldati,A.,2002.Water quality control in the river Arno.Water Res.36(10),2673-2680.https://doi.org/10.1016/S0043-1354(01)00483-3.
Di Toro,D.M.,Fitzpatrick,J.,1993.Chesapeake Bay Sediment Flux Model.HydroQual,Inc.(Contract Report EL-93-2),Mahwah.
Houck,C.P.,Thorton,R.J.,Brooks,J.,Saunders,J.F.,1997.A model of alternative ways to meet dissolved oxygen standards.Water Environ.Res.69(5),948-954.https://doi.org/10.2175/106143097X125632.
Hunter,J.F.,Whipple Jr.,W.,1970.Evaluating in stream aerators of polluted river.J.Water Pollut.Control Fed.42(8),249-262.
Imhoff,K.R.,1969.Oxygen management and artificial reaeration in the area of Baldeney Lake and the Lower Ruhr River.GWF Das Gas under Wasserfach 110(20),543-545.
Jobson,H.E.,Schoellhamer,D.H.,1987.Users Manual for a Branched Lagrangian Transport Model.U.S.Geological Survey(Water-Resources Investigations Report 87-4163).Reston,VA.
Jobson,H.E.,1997.Enhancements to the Branched Lagrangian Transport Modeling System,U.S.Geological Survey (Water-Resources Investigations Report 97-4050).Reston,VA.
Manache,G.,Melching,C.S.,2004.Sensitivity analysis of a water-quality model using Latin hypercube sampling.J.Water Resour.Plann.Manag.130(3),232-242.https://doi.org/10.1061/(ASCE)0733-9496(2004)130:3(232).
Melching,C.S.,Alp,E.,Ao,Y.,2010.Development of Integrated Strategies to Meet Proposed Dissolved Oxygen Standards for the Chicago Waterway System.Institute for Urban Environmental Risk Management(Technical Report No.20),Marquette University,Milwaukee.
Melching,C.S.,Ao,Y.,Alp,E.,2013.Modeling evaluation of integrated strategies to meet proposed dissolved oxygen standards for the Chicago Waterway System.J.Environ.Manag.116,145-155.https://doi.org/10.1016/j.jenvman.2012.11.040.
Melching,C.S.,Liang,J.,2013.Modeling Evaluation of the Water-quality Effects of Separation of the Great Lakes and Mississippi River Basins in the Chicago Area Waterways System.Institute for Urban Environmental Risk Management(Technical Report21),Marquette University,Milwaukee.
Melching,C.S.,Liang,J.,Fleer,L.A.,Wethington,D.M.,2015.Modeling the water quality impacts of the separation of the Great Lakes and Mississippi River basins for invasive species control.J.Great Lake.Res.41(1),87-98.https://doi.org/10.1016/j.jglr.2014.11.009.
Michael Baker Jr.,Inc.,2013.Quality Assurance Project Plan:Modeling QAPP,Illinois River Watershed Nutrient Modeling Development.Alexandria,VA.
Polls,I.,Washington,B.,Lue-Hing,C.,1982.Improvements in Dissolved Oxygen Levels by Artificial In-stream Aeration in Chicago Waterways(Report No.82-16).Department of Research and Development.Metropolitan Sanitary District of Greater Chicago,Chicago.
Rinaldi,S.,Soncini-Sessa,R.,1978.Optimal allocation of artificial instream aeration.J.Environ.Eng.Div.104(EE1),147-160.
Robison,R.,1994.Chicago's waterfalls.Civil Eng.64(7),36-39.
Sheng,Y.,Qu,Y.,Ding,C.,Sun,Q.,Mortimer,R.J.G.,2013.A combined application of different engineering and biological techniques to remediate a heavily polluted river.Ecol.Eng.57,1-7.https://doi.org/10.1016/j.ecoleng.2013.04.004.
Stichting Toegepast Onderzoek Waterbeheer(STOWA),2000.DUFLOW for Windows V3.3:DUFLOW Modelling Studio:User's Guide,Reference Guide DUFLOW,and Reference Guide RAM.STOWA,Utrecht,The Netherlands.
Todd,D.A.,Bedient,P.B.,1985.Stream dissolved oxygen analysis and control.J.Environ.Eng.111(3),336-352.https://doi.org/10.1061/(ASCE)0733-9372(1985)111:3(336).
Tyler,R.G.,1946.Polluted streams cleared up by aeration.Civil Eng.16,348-349.
Wang,C.X.,Ling,H.,Shi,K.H.,1999.Oxygen restoration of polluted water with pure oxygen aeration.Shanghai Environ.Sci.18,411-413(in Chinese).
Wang,J.,Liu,X.D.,Lu,J.,2012.Urban river pollution control and remediation.Procedia Environ.Sci.13,1856-1862.https://doi.org/10.1016/j.proenv.2012.01.179.
Wang,Z.Y.,Lee,J.H.W.,Melching,C.S.,2014.River Dynamics and Integrated River Management.Springer,Berlin,and Tsinghua University Press,Beijing.
Whipple Jr.,W.,Hunter,J.V.,Davidson,B.,Dittman,F.W.,Yu,S.L.,1969.Instream Aeration of Polluted Rivers.Water Resources Research Institute,Rutgers University,New Brunswick,N.J.
Whipple Jr.,W.,Coughlan Jr.,F.P.,Yu,S.L.,1970.Instream aerators for polluted rivers.J.Sanit.Eng.Div.ASCE 96(SA5),1153-1165.
Whipple Jr.,W.,Yu,S.L.,1971.Aeration system for large navigable rivers.J.Sanit.Eng.Div.ASCE 97(SA6),883-901.
Yu,S.L.,1970.Aeration performance in natural stream.J.Sanit.Eng.Div.ASCE 96(SA5),1099-1113.
Zander,B.,Love,J.,1990.STREAMDO IV and Supplemental Ammonia Toxicity Models.U.S.Environmental Protection Agency,Region VIII,Denver.
杂志排行

Water Science and Engineering的其它文章
- Understanding groundwater table using a statistical model
- Influence of pH on short-cut denitrifying phosphorus removal
- Numerical investigation of pollution transport and environmental improvement measures in a tidal bay based on a Lagrangian particle-tracking model
- Effects of elevated atmospheric CO2and nitrogen fertilization on nitrogen cycling in experimental riparian wetlands
- A simplified physically-based breach model for a high concrete-faced rock fill dam:A case study
- Effect of trapezoidal collars as a scour countermeasure around wing-wall abutments