A simplified physically-based breach model for a high concrete-faced rock fill dam:A case study
2018-05-11QimingZhongShengshuiChenZhoDeng
Qi-ming Zhong*,Sheng-shui ChenZho Deng
aDepartment of Geotechnical Engineering,Nanjing Hydraulic Research Institute,Nanjing 210024,China
bKey Laboratory of Failure Mechanism and Safety Control Techniques of Earth-rock Dam of the Ministry of Water Resources,Nanjing 210024,China
1.Introduction
The concrete-faced rock fill dam(CFRD)is a type of dam widely used throughout the world for different purposes,with sizes ranging from small irrigation projects to large reservoirs on major rivers.The CFRD design is considered to have a high degree of fundamental safety,especially against strong earthquake shaking,and to be appropriate for high dams(Li and Yang,2012;Cen et al.,2016;Chen et al.,2016).It also has substantial advantages over the clay-core rock fill dam design(Sherard and Cooke,1987),e.g.,lower cost and easily available materials.This has led to the selection of the CFRD design for very large reservoirs,for which low-level release facilities are neither feasible nor necessary(Sherard and Cooke,1987;Modares and Quiroz,2016;Gurbuz and Peker,2016).At present,with the development and utilization of water resources,an array of high CFRDs with heights greater than 200 m are being built or planned in China(Chen,2015;Zhou et al.,2015a;Du et al.,2015).These high dams and large reservoirs will bring tremendous financial benefits,but hidden safety issues should be given more attention(Zhou et al.,2015b;Jia et al.,2016;Yang et al.,2016;Niu et al.,2016).Although the CFRD has many advantages,there have also been some failure cases due to overtopping or seepage erosion(Wahl,1998;Xu and Zhang,2009;Xu,2010).For several decades now,a series of physically-based breach models for earth dams have been put forward(ASCE/EWRI Task Committee on Dam/Levee Breaching,2011;Chen,2012;Xie et al.,2013;Zhong et al.,2016).Unfortunately,there have been few records made of CFRD breach modeling,except for some parametric models.
Investigation of CFRD failure cases around the world has revealed that only the Gouhou CFRD breach case in China has detailed records.Based on the survey data and model tests,the Gouhou CFRD breach may have begun with a piping failure.The subsequent breaching process can be delineated as follows:At first,a large amount of water leaked at the junction of a concrete slab and the bottom of a wave wall(Fig.1).Then,the drained water scoured the downstream slope and caused sloughing.Under the effects of piping,scouring,and sloughing,the wave wall collapsed,and then overtopping dominated(Liu et al.,1998).Owing to the support of the concrete slab,the water head of overtopping flow increased slowly at the initial stage.With the erosion of dam materials,the breach crest diminished,and the length of the concrete slab suspended in air increased.The concrete slab broke off when it could no longer support the self-weight and water loads,and the discharge increased rapidly after the breaking of the concrete slab(Li,1995;Chen et al.,2012).Then,the breach continued to deepen and widen until the remaining dam was stabilized under various loads.
In this study,based on the survey data and model tests of the Gouhou CFRD breach case,a simplified physically-based breach model for the Gouhou CFRD was developed.Considering the dam height,the initial scour position on the downstream slope was simulated using a hydraulic method.The broad-crested weir equation was used to simulate the breach flow discharge.The backward erosion was considered the key mechanism of breaching of compacted rock fill materials,which was reflected with a time-averaged headcut migration rate from an empirical formula of the energy method.The moment equilibrium method was adopted to simulate the ultimate length of the concrete slab.
2.Numerical model for Gouhou CFRD breach
2.1.Water balance equation
The water balance equation for the reservoir can be described as

whereVis the volume of water in the reservoir,tis time,Asis the surface area of the reservoir,zsis the water surface elevation,Qinis the in flow discharge,Qbis the breach flow,Qspillis the flow through spillways,andQsluiceis the flow through sluice gates.
2.2.Breach flow
The overt opping flow at the breach can be calculated using the broad-crested weir equation:
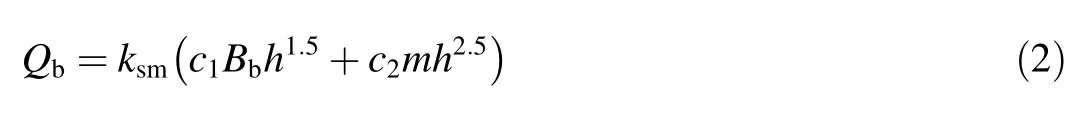

Fig.1.Initial leakage position of Gouhou CFRD.
whereBbis the breach bottom width;h=zs-zb,wherezbis the elevation of the breach bottom;mis the slope of the breach;c1=1.7;c2=1.3;andksmis the submergence correction for tail water effects on weir out flow.
2.3.Initial scour position
Visser(1998)pointed out that,on account of the steepness of the downstream slope of the dam, flow accelerates from pointFat the top of the downstream slope to pointPon the downstream slope,where the normal flow velocity is reached if the slope is long enough(Fig.2).Beyond pointP,breach flow remains uniform with its velocity and water depth being normal values,and it is defined as the initial scour position.The distancelnbetweenFandPcan be approximated with the following expression:

where β is the inclination angle of the downstream slope,dnis the normal water depth,andFrnis the Froude number at pointP.Frnis calculated as follows:
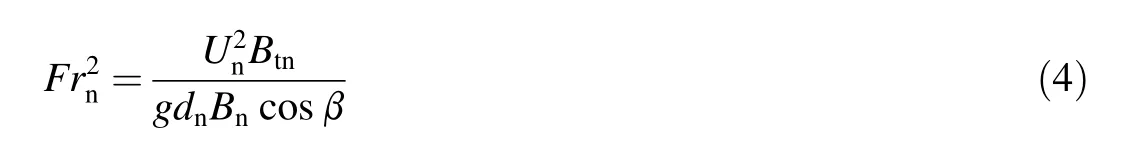
whereUnis the cross-sectional averaged normal flow velocity,Btnis the breach width at the dam crest under the normal flow conditions,Bnis the breach width at the downstream slope,andgis the gravitational acceleration.

Fig.2.Lowering of dam crest and steepening of downstream slope.
Unanddnbeyond pointPare calculated,respectively,as
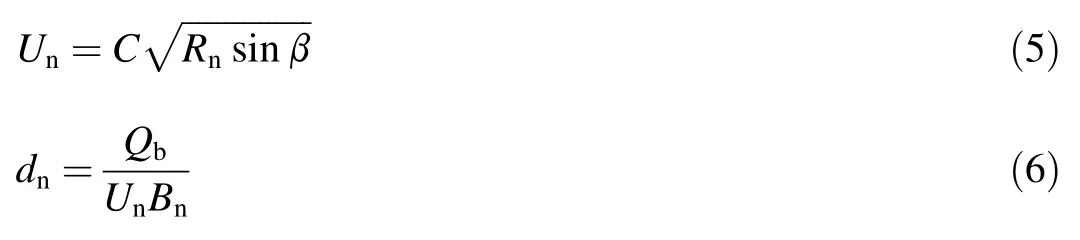
whereRnis the hydraulic radius of breach under the normal flow conditions,andCis the Chezy coefficient.
2.4.Breach development
At the initial stage of dam breaching,the breach flow velocity at the dam crest is relatively small compared with that of the downstream slope.Due to the larger erosion rate at pointPthan at the upper part of the downstream slope,the slope becomes steeper as the breach develops,and,accordingly,the slope angle increases from an initial value β att=t0to a critical value φ att=t1,which is assumed to be the internal friction angle of rock fill materials(Fig.2).
A shear stress equation is used to describe the erosion rate of soil(USDA-NRCS,1997):

whereEis the erosion rate,kdis the erodibility coefficient,τbis the bed shear stress,and τcis the critical shear stress determined using the Shields diagram.
The coefficientkdis usually calculated with the empirical formula proposed by Temple and Hanson(1994):
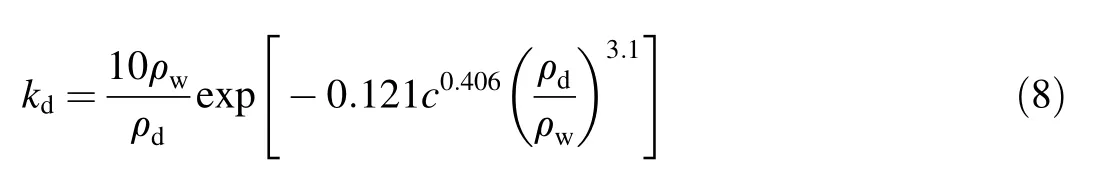
where ρwis the density of water,ρdis the dry density of soil,andcis the clay ratio.
The bed shear stress is determined by the Manning equation:

whereAis the flow area,andRis the hydraulic radius.The Manning's roughness coefficientnis related to sediment median sized50(m)as follows:
whereMnis an empirical coefficient,andMn=12 for the field cases in this study(Wu,2013).
Eq.(7)can be used to describe the erosion at the dam crest dzb/dt.With regard to the erosion on the downstream slope,the equation for the increment dβ can be expressed as
whereE1is the erosion rate at the initial scour position on the downstream slope,andE0is the erosion rate at the top of the downstream slope.
When the downstream slope angle reaches the internal friction angle φ,it is assumed that the slope angle maintains a constant value.Then,a formula of the time-averaged migration rate is utilized to reflect the backward erosion(Temple,1992):

where dx/dtis the backward erosion rate,CTis the backward erosion coefficient,qis the discharge per unit width,andHeis the overfall height.
When a breach occurs along the dam axis(Fig.3),the relationship between horizontal expansion and vertical undercutting is determined by
whereBtis the breach top width;ΔBtand ΔBbare the horizontal expansion values of breach at the breach top and breach bottom for each time step,respectively;nlocis the indicator of breach location,withnloc=1 for a breach located on a side of the dam,andnloc=2 for a breach located at the middle of dam length(Wu,2013);and Δzbis the vertical undercutting value for each time step.In this study,because the dam was made of rock fill materials,the breach slope angle was assumed to be the same as the internal friction angle.
2.5.Failure of concrete slab
Owing to the supporting function,the concrete slabs retain water.The initial breach deepens and widens under the erosion by the over flow water.With the erosion of downstream rock fill materials,the breach crest decreases gradually,and the length of suspended concrete slabs increases.The concrete slabs break off when they cannot sustain the self-weight and water loads.

Fig.3.Breach development along dam axis.
In this study,the moment equilibrium method was utilized to analyze the stability of each concrete slab.In order to simplify the analysis,the concrete slab was assumed to be a cantilever slab when the supporting sand gravel vanished.The self weight-induced bending moment can be calculated as follows:
where ρmis the density of the concrete slab,m1is the upstream slope,δ is the thickness of the concrete slab,wis the width of the concrete slab,andLdis the length of the damaged concrete slab.
The water load-induced bending moment is
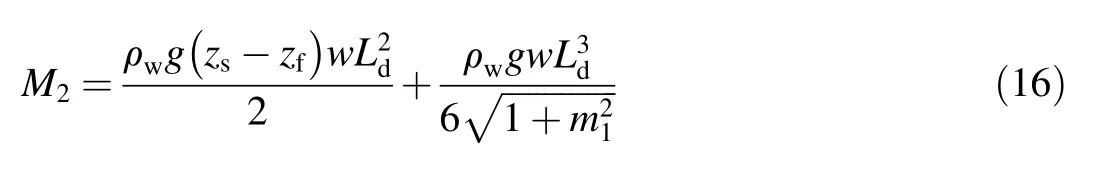
wherezfis the crest elevation of the concrete slab.
The total bending moment of the concrete slab is
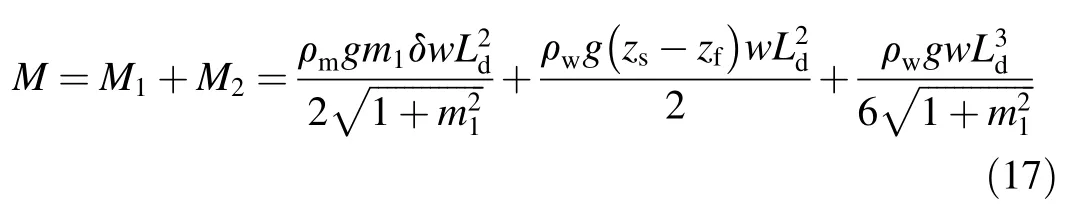
The ultimate bending moment of the concrete slab can be calculated according to theDesign Code for Hydraulic Concrete Structures(SL191-2008):

wherefyis the design value of rebar's tensile strength;Acis the cross-sectional area of rebar in the tensile region;h0is the distance from the barycenter of the tensile rebar to the edge of the compressive zone;andfcis the design value of concrete axial compressive strength.Thus,Ldcan be determined by

3.Case study
3.1.Calculated parameters
The Gouhou CFRD breach case,with detailed measurement data,was chosen as the representative case study.The Gouhou CFRD has a maximum height of 71.0 m and a total storage of3.3 million m3.Because the failure time of the Gouhou CFRD was only 2.33 h,it was assumed that there was no in flow during dam breaching.The crest length(L)and width(B)of the dam were 265.0 m and 7.0 m,respectively.The upstream slope(m1)and downstream slope(m2)were 0.625 and 0.667,respectively.The concrete slab crest elevation was 3277.00 m.The initial water level elevation was set at 3277.30 m.The data used in the present study were selected from Xu and Zhang(2009),as well as several laboratory experiments and field investigations(Li,1995;Liu et al.,1998;Li and Sheng,2000).The initial breach depth and width were both 5.0 m.The median size(d50)of the materials was determined to be 15.0 mm,an average value obtained from the typical grain composition curves of the Gouhou CFRD(Li and Sheng,2000);the Manning's roughness coefficient(n)was calculated as 0.041 using Eq.(10);the cohesion and internal friction angle of soil were determined to be 60 kPa and 40°,respectively,from the results of large-scale tri-axial tests(Li and Sheng,2000);the clay ratio was assumed to be 0;and the erodibility coefficient(kd)was estimated to be 5.66 cm3/(N⋅s)using Eq.(8).Based on the experimental data and those from Robinson(1996),Bennett et al.(2000),and Mei et al.(2016),the backward erosion coefficient(CT)was assumed to be 0.015 m-1/6⋅s-2/3.Other parameters related to reservoir characteristics and soil properties of the Gouhou CFRD are listed in Table 1.
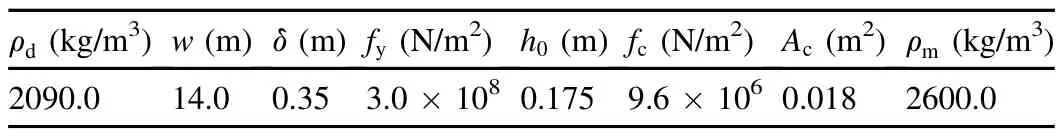
Table 1Parameters of Gouhou CFRD.
Fig.4 shows the layout of the concrete slabs of the Gouhou CFRD,and the damaged slabs are denoted with numbers.According to the field investigation,the slab failure occurred at the center of the dam.
3.2.Calculated results
In this study,the simulation of Gouhou CFRD breaching started at the occurrence of wave wall collapse.The overt opping flow then eroded the downstream slope.The calculated results of peak breach flow(Qp), final breach top width(Btf), final breach bottom width(Bbf),time of the peak breach flow(tp),and failure time(tf),as well as the measured data from Xu and Zhang(2009),are shown in Table 2,wheretfis the time period from the beginning of dam breaching to the moment when 99%of the final breach width is reached.Figs.5 and 6 show the calculated breach flow hy drograph and the breach width development.
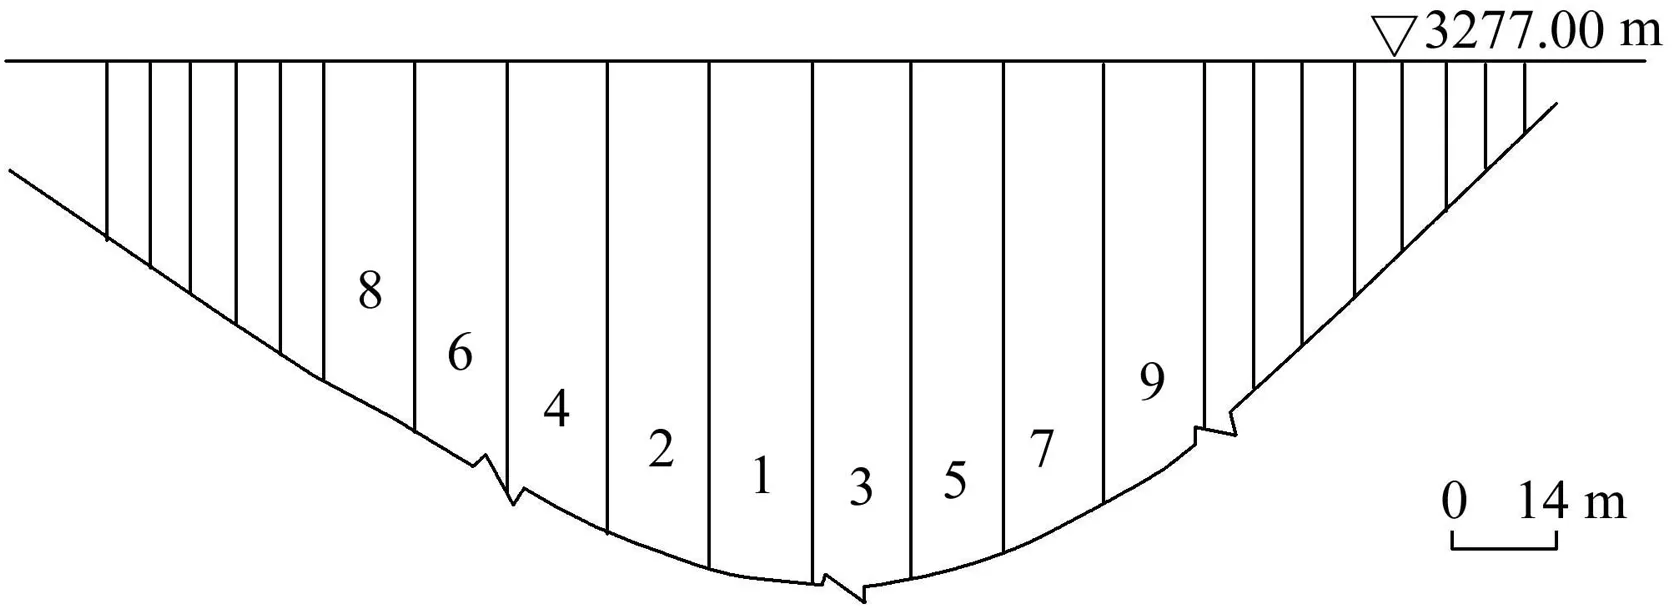
Fig.4.Layout of concrete slabs of Gouhou CFRD.

Table 2Results of Gouhou CFRD breach case.
The calculated results show that,with the erosion of dam materials,the concrete slabs broke off,and the length of the first damaged concrete slab was 7.4 m at 0.50 h after dam breaching;then,the breach flow discharge increased immediately,and the peak breach flow,which was 5.0%larger than the measured data,occurred at 0.65 h after dam breaching.Likewise,the final breach top and bottom widths of the calculated results were 4.1%and 10.7%larger than the measured data,respectively;for the failure time,the calculated result was 14.6%longer than the measured one.Overall,the proposed model gives reasonable results,with relative errors less than 15.0%.
3.3.Sensitivity analysis
Sensitivity analysis of model parameters was conducted in this study.The erodibility coefficient and the backward erosion coefficient are the key parameters,and they are highly empirical with significant uncertainties.Owing to the wide grading of the CFRD materials,the grain size should be taken into account.Thus,the influences of the three parameters on the calculated breach characteristics were assessed for the proposed model.In the parameter sensitivity analysis,kdandCTwere multiplied by 0.5 and 2.0,respectively,andd50was chosen from the top and bottom boundary lines,which were 3 mm and 500 mm,respectively.In addition,the effects of the geometry of the dam(e.g.,the crest length and the upstream and downstream slopes)and the internal friction angle were also taken into account.Considering the final top breach width in Table 2,the crest length of the dam was assumed to be 100.0 m and 530.0 m,respectively.Using actual CFRDs as references,the upstream and downstream slopes were set as 0.556 and 0.714 for sensitivity analysis,respectively.For the internal friction angle,the values were assumed to be 30°and 50°,respectively.The calculatedQp,Btf,Bbf,andtpregarding the varied parameters are shown in Table 3.The changes of these quantities in percentage as compared with the calculated data in Table 2 are also given.

Fig.5.Breach flow hydrograph.

Fig.6.Breach width development.
Table 3 shows that the peak breach flow is most sensitive to the erodibility coefficient and least sensitive to the internal friction angle,the final breach top and bottom widths are both most sensitive to the soil erodibility coefficient and least sensitive to the upstream and downstream slopes,and the time of peak breach flow is most sensitive to the backward erosion coefficient and least sensitive to the crest length of the dam.
3.4.Comparison with parametric breach models
Owing to the lack of relevant physically-based models,the proposed breach model was compared with three parametric breach models with regard to the calculation of the peak breach flow, final average breach width,and failure time of dam breaching:the USBR(1988),Froehlich(1995a,1995b),and Xu and Zhang(2009)models.The USBR(1988)model is as follows:

whereHwis the depth of water above the breach invert at the failure time,andBaveis the final average breach width.
The Froehlich(1995a,1995b)model considers the overtopping and piping using a coefficientK0.The formulas are as follows:

whereVwis the volume of water above the breach invert,Hbis the breach depth,andK0is 1.4 for overtopping and 1.0 for piping.
The Xu and Zhang(2009)model considers more factors,such as the dam type,erodibility,failure mode,and so on.The formulas are as follows:
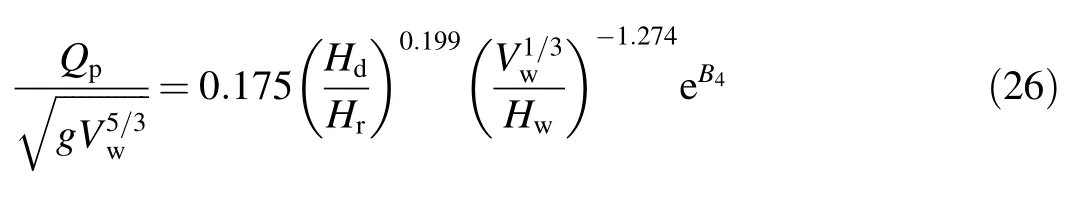
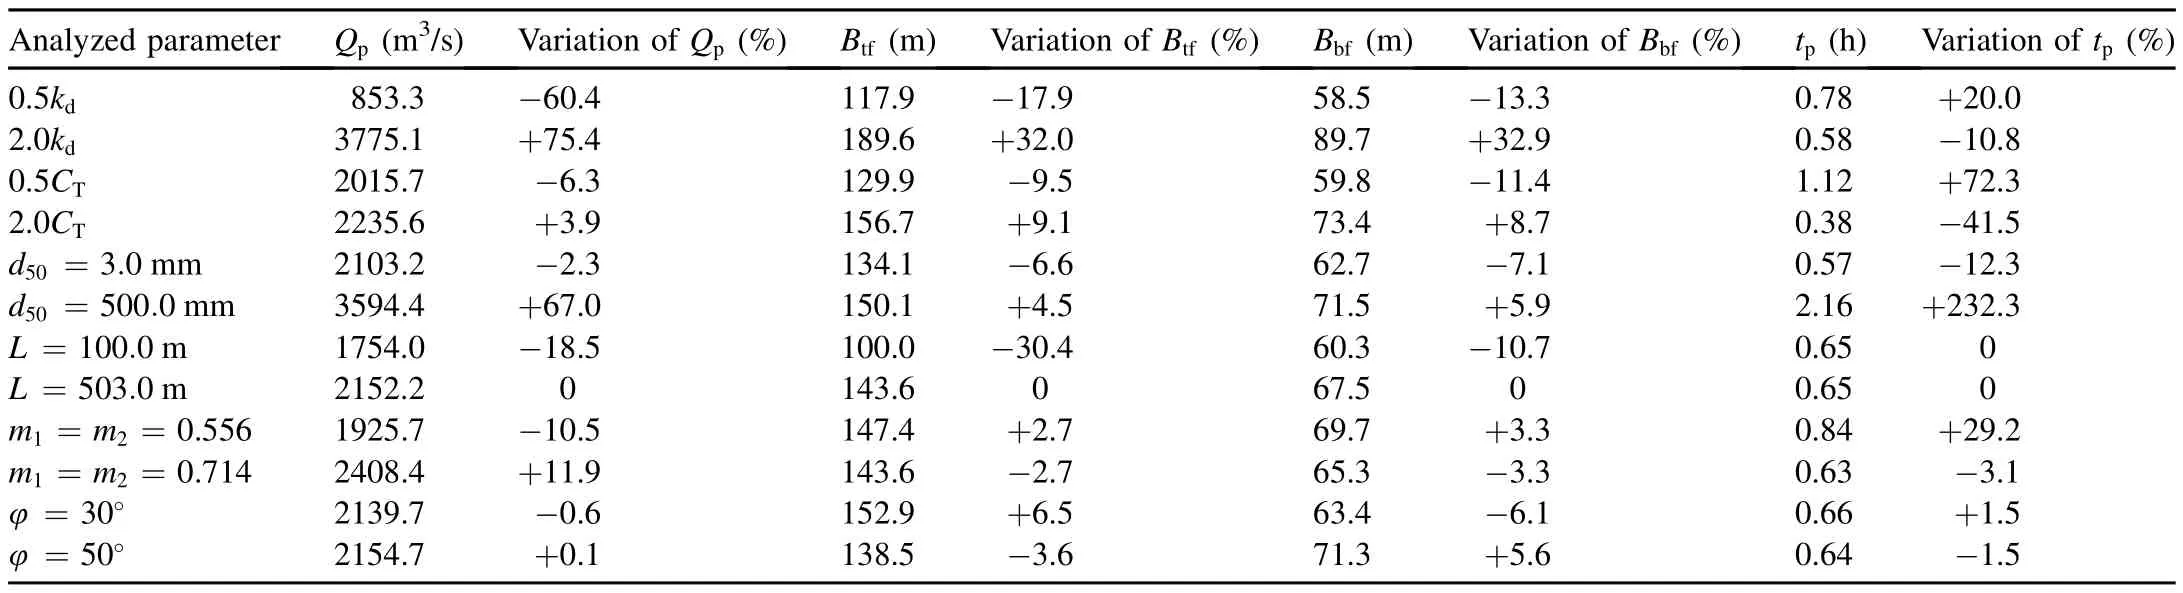
Table 3Sensitivity analysis results for different parameters.
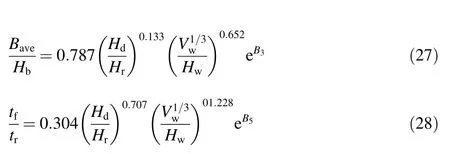
whereHdis the dam height,Hris a reference dam height set as 15 m,andtris a reference failure time set as 1 h.The coefficientB3=b3+b4+b5,whereb3=-0.041,0.026,and 0.226 for dams with core walls,concrete-faced dams,and homogeneous/zoned- fill dams,respectively;b4=0.389 for piping;andb5=0.291,0.140,and 0.391 for high,medium,and low dam erodibility,respectively.The coefficientB4=b3+b4+b5,whereb3=-0.503,-0.591,and-0.649 for dams with core walls, concrete-faced dams, and homogeneous/zoned- fill dams,respectively;b4=-1.039 for piping;andb5=-0.007,-0.375,and-1.362 for high,medium,and low dam erodibility,respectively.The coefficientB5=b3+b4+b5,whereb3=-0.327,-0.674,and-0.189 ford ams with core walls,concrete-faced dams,and homogeneous/zoned- fill dams,respectively;b4=-0.611 for piping;andb5=-1.205,-0.564,and 0.579 for high,medium,and low dam erodibility,respectively.
The formulas from USBR(1982,1988),Froehlich(1995a,1995b),and Xu and Zhang(2009)represent three generations of parametric breach models obtained by regressions of single to multiple variables.The Gouhou CFRD was considered to have low erodibility and categorized to be piping failure in the models above because the dam breach initiated with theseepage erosion.Hd,Hb,Hw,andVwwere determined to be 71.0 m,48.0 m,44.0 m,and 3.18×10⁶m3,respectively,according to the conditions of the dam breach case.

Table 4Results of parametric breach models and proposed physically-based breach model for Gouhou CFRD breach case.
Table 4 gives the results of the three parametric breach models and the proposed physically-based breach model,as well as their comparison with the measured data.Of the three models,the Xu and Zhang(2009)formulas perform best,followed by the Froehlich(1995a,1995b)formulas and the USBR(1982,1988)formulas.This is understandable because the Xu and Zhang(2009)formulas consider more factors and are based on larger databases.
Table 4 also shows that the proposed physically-based breach model performs significantly better than the three parametric breach models.In addition,a simplified physically based breach model can give more detailed results,such as the breach hydrograph and breach development process shown in Figs.5 and 6,than a parametric model.
4.Conclusions
A simplified physically-based breach model for high CFRDs was developed,and the Gouhou CFRD breach case,with detailed measured data,was chosen to test the proposed model.The calculated results show that the proposed model gives reasonable values for the peak breach flow, final breach width,and failure time,with relative errors less than 15%.Sensitivity studies show that the peak breach flow is most sensitive to soil erodibility and least sensitive to the internal friction angle,the final breach top and bottom widths are both most sensitive to soil erodibility and least sensitive to the upstream and downstream slopes,and the failure time is most sensitive to the backward erosion coefficient and least sensitive to the dam crest length.In addition,the proposed breach model was compared with three typical parametric breach models.The comparison shows that the proposed physically based breach model performs better and provides more detailed results than the parametric models.The proposed model adopts an alternative method to describe the characteristics of widely graded soil materials,and further studies and tests are needed to validate and improve the proposed breach model.
References
ASCE/EWRITask Committeeon Dam/Levee Breach,2011.Earthen embankment breaching.J.Hydraul.Eng.137(12),1549-1564.https://doi.org/10.1061/(ASCE)HY.1943-7900.0000498.
Bennett,S.J.,Alonso,C.V.,Prasad,S.N.,R¨omkens,M.J.M.,2000.Experiments on headcut growth and migration in concentrated flows typical of upland areas.Water Resour.Res.36(7),1911-1922.https://doi.org/10.1029/2000WR900067.
Cen,W.J.,Zhang,Z.Q.,Zhou,T.,Yang,H.K.,Lu,P.C.,2016.Maximum seismic capacity of a high concrete-face rock fill dam on alluvium deposit.Adv.Sci.Technol.Water Resour.36(2),1-5.https://doi.org/10.3880/j.issn.1006-7647.2016.02.001(in Chinese).
Chen,S.S.,2012.Breach Mechanism and Simulation of Breach Process for Earth-rock Dams.China Water&Power Press,Beijing(in Chinese).
Chen,S.S.,Cao,W.,Huo,J.P.,Zhong,Q.M.,2012.Numerical simulation for overtopping-induced break process of concrete-faced sandy gravel dams.Chin.J.Geotech.Eng.34(7),1169-1175(in Chinese).
Chen,S.S.,2015.Safety Problems of Earth and Rock fill Dams Subjected to Earthquakes.Science Press,Beijing(in Chinese).
Chen,S.S.,Fu,Z.Z.,Wei,K.M.,Han,H.Q.,2016.Seismic responses of high concrete face rock fill dams:A case study.Water Sci.Eng.9(3),195-204.https://doi.org/10.1016/j.wse.2016.09.002.
Du,X.H.,Li,B.,Chen,Z.Y.,Wang,Y.J.,Sun,P.,2015.Evaluations on the safety design standards for dams with extra height or cascade impacts,Part II:Slope stability of embankment dams.Chin.J.Hydraul.Eng.46(6),640-649.https://doi.org/10.13243/j.cnki.slxb.20150251(in Chinese).
Froehlich,D.C.,1995a.Peak out flow from breached embankment dam.J.Water Resour.Plann.Manag.121(1),90-97.https://doi.org/10.1061/(ASCE)0733-9496(1995)121:1(90).
Froehlich,D.C.,1995b.Embankment dam breach parameters revisited.In:Proceedings of the First International Conference on Water Resources Engineering.ASCE,New York,pp.887-891.
Gurbuz,A.,Peker,I.,2016.Monitored performance of a concrete-faced sandgravel dam.J.Perform.Constr.Facil.30(5),04016011.https://doi.org/10.1061/(ASCE)CF.1943-5509.0000870.
Jia,J.S.,Xu,Y.,Hao,J.T.,Zhang,L.M.,2016.Localizing and quantifying leakage through CFRDs.J.Geotech.Geoenviron.Eng.142(9),06016007.https://doi.org/10.1061/(ASCE)CF.1943-5509.000087010.1061/(ASCE)GT.1943-5606.0001501.
Li,J.C.,1995.A research for break of Gouhou face dam.J.Nanjiang Hydraul.Res.Inst.4,425-434(in Chinese).
Li,L.,Sheng,J.B.,2000.Engineering behavior of gravel materials of Gouhou Dam.J.Nanjiang Hydraul.Res.Inst.3,27-32(in Chinese).
Li,N.H.,Yang,Z.Y.,2012.Technical advances in concrete face rock fill dams in China.Chin.J.Geotech.Eng.34(8),1361-1368(in Chinese).
Liu,J.,Ding,L.Q.,Miao,L.J.,Yang,K.H.,1998.Model test for dam breach of Gouhou concrete face sandy gravel dam.Chin.J.Hydraul.Eng.11,69-75(in Chinese).
Mei,S.A.,Huo,J.P.,Zhong,Q.M.,2016.Determination of headcut migration parameters for homogeneous earth dam due to overtopping failure.Hydro-Sci.Eng.2,24-31.https://doi.org/10.16198/j.cnki.1009-640X.2016.02.004(in Chinese).
Modares,M.,Quiroz,J.E.,2016.Structural analysis framework for concretefaced rock fill dams.Int.J.GeoMech.16(1),04015024.https://doi.org/10.1061/(ASCE)GM.1943-5622.0000478.
Niu,X.Q.,Tan,J.X.,Tian,J.Z.,2016.Analysis on CFRD defect's characteristics and its reinforcement.Yangtze River 47(13),1-5.https://doi.org/10.16232/j.cnki.1001-4179.2016.13.001(in Chinese).
Robinson,K.M.,1996.Gully Erosion and Headcut Advance.Ph.D.Dissertation.Oklahoma State University,Still water.
Sherard,J.L.,Cooke,J.B.,1987.Concrete-face rock fill dam,I:Assessment.J.Geotech.Eng.113(10),1096-1112.https://doi.org/10.1061/(ASCE)0733-9410(1984)110:10(1381).
Temple,D.M.,1992.Estimating flood damage to vegetated deep soil spillways.Appl.Eng.Agric.8(2),237-242.https://doi.org/10.13031/2013.26059.
Temple,D.M.,Hanson,G.J.,1994.Headcut development in vegetated earth spillways.Appl.Eng.Agric.10(5),677-682.https://doi.org/10.13031/2013.25898.
U.S.Bureau of Reclamation(USBR),1982.Guidelines for De fining Inundated Areas Downstream from Bureau of Reclamation Dams,Reclamation Planning Instruction No.82-11.U.S.Bureau of Reclamation,U.S.Department of the Interior,Denver.
U.S.Bureau of Reclamation(USBR),1988.Downstream Hazard Classification Guidelines,ACER Technical Memorandum No.11.U.S.Bureau of Reclamation,U.S.Department of the Interior,Denver.
U.S.Department of Agriculture,Natural Resources Conservation Service(USDANRCS),1997.Earth Spillway Erosion Model,Chapter 51,Part 628 Dams,National Engineering Handbook.U.S.Department of Agriculture,Natural Resources Conservation Service of the United States,Washington,D.C.
Visser,P.J.,1998.Breach Growth in Sand-dikes.Ph.D.Dissertation.Delft University of Technology,Delft.
Wahl,T.L.,1998.Prediction of embankment dam breach parameters:A literature reviewand needs assessment. In:DamSafety ReportNo.DSO-98-9004.U.S.Bureau of Reclamation. U.S. Department of the Interior, Denver.
Wu,W.,2013.Simplified physically based model of earthen embankment breaching.J.Hydraul.Eng.139(8),837-851.https://doi.org/10.1061/(ASCE)HY.1943-7900.0000741.
Xie,Y.L.,Zhu,Y.H.,Guo,X.L.,2013.Advances and problems in earth-dam failure research.J.Yangtze River Sci.Res.Inst.30(4),29-33.https://doi.org/10.3969/j.issn.1001-5485.2013.04.007(in Chinese).
Xu,Y.,Zhang,L.M.,2009.Breaching parameters for earth and rock fill dams.J.Geotech.Geoenviron.Eng.135(12),1957-1969.https://doi.org/10.1061/(ASCE)GT.1943-5606.0000162.
Xu,Y.,2010.Analysis of Dam Failures and Diagnosis of Distresses for Dam Rehabilitation.Ph.D.Dissertation.The Hong Kong University of Science and Technology,Hong Kong.
Yang,Q.G.,Tan,J.X.,Zhou,X.M.,Gao,D.X.,2016.Discussion on several issues of concrete face rock- fill dam.Yangtze River 47(2),62-66.https://doi.org/10.16232/j.cnki.1001-4179.2016.14.013(in Chinese).
Zhong,Q.M.,Wu,W.M.,Chen,S.S.,Wang,M.,2016.Comparison of simplified physically based dam breach models.Nat.Hazards 84(2),1385-1418.https://doi.org/10.1007/s11069-016-2492-9.
Zhou,J.P.,Wang,H.,Chen,Z.Y.,Zhou,X.B.,Li,B.,2015a.Evaluations on the safety design standards for dams with extra height or cascade impacts,Part I:Fundamentals and criteria.Chin.J.Hydraul.Eng.46(5),505-514.https://doi.org/10.13243/j.cnki.slxb.20150249(in Chinese).
Zhou,X.B.,Chen,Z.Y.,Huang,Y.F.,Wang,L.,Li,X.N.,2015b.Evaluations on safety design standards for dams with extra height or cascade impacts,Part III:Risk analysis of embankment break in cascade.Chin.J.Hydraul.Eng.46(7),765-772.https://doi.org/10.13243/j.cnki.slxb.20150252(in Chinese).
杂志排行

Water Science and Engineering的其它文章
- A quantitative model for danger degree evaluation of staged operation of earth dam reservoir in flood season and its application
- Experimental and numerical analysis of flow over a rectangular full-width sharp-crested weir
- Study of total variation diminishing(TVD)slope limiters in dam-break flow simulation
- Cloud-Verhulst hybrid prediction model for dam deformation under uncertain conditions
- Effect of trapezoidal collars as a scour countermeasure around wing-wall abutments
- Effects of elevated atmospheric CO2and nitrogen fertilization on nitrogen cycling in experimental riparian wetlands