A Novel Approach for Enhancement of Geometric and Contrast Resolution Properties of Low Contrast Images
2018-05-02KoushlendraKumarSinghManishKumarBajpaiandRajeshKumarPandey
Koushlendra Kumar Singh,Manish Kumar Bajpai,and Rajesh Kumar Pandey
I.INTRODUCTION
THE image enhancement is a process to improve the visual interpretation or perception of information contained in an image for human viewers or to provide better input image for any automated image processing systems.Image enhancement is widely applicable in many real life applications such as medical imaging,criminal investigation,astronomy,geographical information system,satellite imaging etc.
Several image enhancement techniques have been proposed in literature.These techniques are application dependent.One particular technique is not applicable for all types of applications,e.g.,removing blurring effect of an image,improving contrast of an image,removing the blocky effects of an image etc.Contrast,brightness and sharpness plays crucial role in any image.Contrast is created by difference in luminance reflected from two adjacent surfaces with in an image.It enables user to distinguish between objects present in the image and its background.Contrast depends on various factors,such as,quality of camera,weather condition in geographical imaging,density of tissues in medical imaging and distance in satellite imaging.
The resultant images will not provide all the details and some information may be washed-out and also it will give unnatural look.Contrast enhancement algorithms target to eliminate these issues[1],[2].
Contrast enhancement algorithms can be categorized in two categories:1)direct method;and 2)indirect method.Direct contrast enhancement algorithms comprise with the use of original contrast value.Two important direct contrast enhancement measures are:1)Michelson contrast measure;and 2)Weber contrast measure[3],[4].Michelson contrast measure is used to measure the periodic pattern while Weber contrast measure is used to calculate a large uniform luminance background by use of a small target.These algorithms are not able to measure the contrast value of complex images[5].
Indirect contrast enhancement algorithms include improvement in the intensity span of the pixels by assigning it specified mapping function.The indirect contrast enhancement algorithms can be categorized in three categories:1)transform based contrast enhancement algorithms;2)histogram based contrast enhancement algorithms;3) filter decomposition algorithms for image enhancement.Many transform based image enhancement algorithms have been proposed in[1],[2],[6]-[9].These algorithms are computationally efficient.It is easy to view and handle frequency composition of the image without direct dependence on spatial domain.These algorithms suffer with blocking effect;hence,we are unable to enhance every part of image simultaneously.
The histogram based algorithms are quite popular among the researchers.We are naming few like histogram equalization,adaptive histogram equalization(AHE),generalized histogram equalization(GHE),local histogram equalization(LHE),dynamic histogram equalization(DHE),brightness preserving bi-histogram equalization(BPBHE),brightness preserving dynamic histogram equalization(BPDHE),equal area dualistic sub-image histogram equalization(DSIHE),minimum mean brightness error bi-histogram equalization(MMBEBHE)algorithm[10]-[18].These algorithms are sensitive to noise and also not able to adjust the level of enhancement.
Filter based image enhancement algorithms are proposed by many researchers to overcome the histogram spikes present in an image.The special low-pass,high pass and band pas filtering,unsharp masking and crisping,directional smoothing,median filtering,local-mean-weighted adaptive filter,weighting high pass filter and many more adoptive filtering algorithms have been developed[19]-[26].These algorithms preserve the original histogram pro file features and also improve the contrast dynamically.
Demirelet al.used discrete wavelet transform(DWT)and singular value decomposition(SVD)for contrast enhancement[27],[28].Illumination problem has been solved with SVD in literature.It uses the ratio of largest singular value of the generated normalized matrix with mean zero and variance of one over a normalized image which can be calculated according to following equation

where Σ(µ=0,var=1)is the singular value matrix of the synthetic intensity matrix.This coefficient can be used for regeneration of an equalized image.

This operation reduces the effect of illumination problem.Chenet al.proposed a new image enhancement algorithm based on the fractional order Savitzky-Golay differentiator[25].Fractional order calculus is generalization of integral order calculus from integer order to fractional order.It is very old concept in mathematics and given by Leibniz(1695)to a response of L Hospital letter[29].It translates the reality of nature in better way because of their non-local distributed effects.Mathematicians are very keen in this area for last three centuries.Researchers,across the globe,have started working on the application of this field in engineering and sciences.From theoretical point of view,it extends the order of image processing from integral to fraction which means an extension of information processing methods and ways.Real world problem can be expressed better in term of real order as compared to integer order.
The most popular application of fractional order derivatives are in nuclear science,design of controller,boundary value problems,description of physical system,practical application of semi-in finite line in circuits,electrical circuit analysis and electromagnetics,electrochemistry and optics,etc.[30],[31].Fractional order derivatives are also used in field of image processing and signal processing.Image sharpening,image enhancement,motion detection,de-blurring,edge detection in iris and many more application of fractional derivatives have already been developed[31].Design of finite impulse response(FIR) filter,in finite impulse response(IIR) filter and fixed fractional delay FIR filter are very popular in the field of signal processing[25],[31].Design of filter and differentiator helps us in different applications and increases the acceptability of filter.
Fractional order derivative of any function has been calculated by different derivative definitions which exist in literature.The most popular ones among them are Riemann-Liouville definition,Grunwald-Letnikov definition,Caputo definition(1967),Oldham and Spanier definition(1974),K.S.Miller and B.Ross method(1993),Kolwankar and Gangal definition(1994)[29]-[31].Fractional order differentiator has been designed for continuous as well as for discrete time domain.Carlsons method,Dutta Roys method,Chareffs method,Matsudas method and Oustaloups method are most popular methods for continuous time domain[25].Least square method,Newton series method,Tustin method,Taylor method,fractional differencing formulas and continued fractional expansion,etc.,are some example of discrete time domain method[26].These methods are unable to accurately estimate the derivative of noisy data or signal.Genetic algorithms have been developed for estimation of derivative of contaminated signals.Genetic algorithms have complex mathematical calculations[32].Savitzky-Golay proposed a differentiator based on polynomial regression for estimation and fitting of data.They have used least square polynomials for approximation of the contaminated signals.Integer order derivatives of contaminated signal have been easily estimated by it[25],[26],[33].
The Chebyshev polynomials have wide applications in the field of numerical analysis,interpolation of data,approximation,integration using Chebyshev polynomials,boundary value problems,solution of differential equations,signal processing specially for variable bandwidth finite length filter and filter designing,etc.[34]-[36].It has been first introduced by P.L.Chebyshev in 1854[37].Chebyshev polynomials are a sequence of orthogonal polynomials which can be de fined recursively.Chebyshev polynomials have been wildly useful because of their orthogonal properties[36].
We have proposed an algorithm which uses a Chebyshev polynomial based approximation of fractional order differentiator.This differentiator is further used for generation of lowpass and high-pass filter.This filter enables us to enhance the geometrical as well as contrast resolution properties of an image[38].We have applied our algorithm only on L-L sub-band of the image.
The structure of paper is as follow.Section II discussed the proposed Chebyshev polynomial based fractional order differentiator(CPBFOD)algorithm.Section III presents the detail of experiments.Section IV reports the results obtained from experiments.Section V gives the conclusions.
II.POLYNOMIAL BASED FRACTIONAL ORDER APPROXIMATION OF FILTER FUNCTION FOR IMAGE ENHANCEMENT
Consider two higher order differentiable functions in asandY(t)which are observed function and original function respectively.The observed function can be written as

whereξ(t)is an error.The present work encompasses smoothing of observed function by the use ofnth order derivative,Lpoint filtering window andn-degree polynomial approximation.

t=1,2,3,...,Lis the position of thetth point in the filtering window andckis thekth coefficient of polynomial function.Least-square method is used for the estimate of the coefficientsck.Equation(2)can expanded in the following form

whereY=[y1,y2,...,yL]denotes the measured function points in the filtering window.Tis a matrix of orderL×(n+1)and can be de fined as

The elements of matrixTare calculated by using Chebyshev polynomial[37].The Chebyshev polynomial is solution of following differential equation


The Chebyshev polynomial of first kind can be obtained by the following recursive relation

whereT0(t)=1,T1(t)=t.
The vectorsCstoring the coefficients of the polynomial are obtained by following expression.

Equations(7)and(8)are used to solve(3).It will result

whereWdenotes windows coefficient matrix.Smoothing can be performed by use of different window coefficient matrix.
Mainly,there are three most popular definition of fractional derivative which are frequently used in the various applications,i.e.,Riemann Liouville(RL)definition,Grnwald Letnikov(GL)definition and Caputo definition.The fractional derivative of constant(α>0)is not zero when evaluated using RL and GL definition but it is zero for Caputo definition.This is the main difference between Caputo and other two.The fractional derivative of constant,which is non-zero,is the most useful fact regarding image processing perspective.Hence we are not going to use Caputo definition.RL definition provides the exact solution of fractional derivative of any function while GL provide the approximate solution for same.This plays a vital role in choosing the RL definition for our purpose.
制作硬颗粒饲料过程中的水分调控涉及混合机处水分调控、调质过程的水分调控和颗粒冷却过程的水分调控,是一项系统工程。实施这一系统工程的目标应当是:①使粉料在调质过程得到良好的调质质量,即达到理想的水分、熟化程度和流变学特性;②获得较高的制粒产量、成品率、生产效率和较低的电耗;③得到理想的颗粒坚实度(耐久性);④得到较好的成品储存特性指标,包括安全水分、低水分活度,均匀的水分分布;⑤获得好的动物生产性能。本文就如何实现这一系统工程技术进行综合论述,以期为相关企业和人员进行这类操作提供借鉴。
Riemann-Liouville fractional order derivative can be expressed as

where 0≤l-1<α<l,and Γ(l-α)is the Gamma function of(l-α).αis the positive order of differentiation and its value lies betweenl-1 tol.It is called the first order derivative when value ofαbecomes 1 and for other integer values it becomes normal integer order differentiation.The fractional order differentiator,corresponding to window coefficient matrixW,can be obtained by(10).Different properties of fractional order differentiation are applied on(9)especially the properties of linearity and property for integer order derivative.The fractional order derivative is generalization of integral order derivative.This concept is used for calculation of fractional order differentiator.We will get[29]-[31].

The proposed algorithm uses generalized histogram technique(GHT)technique to generate the equalized imageI′.The image is decomposed into four sub band images by newly designed digital fractional order differentiator.The newly designed fractional order digital differentiator behaves like a one-dimensional filter of filter lengthL.It works as a low pass filter.The high pass filter,for proposed digital fractional order filter,has been calculated by mirror image of low pass filter.The low pass and high pass filters,used in analysis section,areG0(n)andh0(n),respectively.The high pass filterh0(n)is a mirror image of low pass filterG0(n)and can be expressed as

The corresponding filters belonging to reconstruction section areG1(n)andh1(n),respectively.
The input image is first filtered row wise using newly designed filter into sub bands.The output image has been decimated by two.The input image has been also filtered row wise with high pass filter.The each sub images has been decimated by 2.The same processes has been repeated columns wise also for both low pass filter and also for high pass filter.The process results into four sub bands as shown in Fig.1.Four bands,labeled as low-low(L-L),low-high(L-H),highlow(H-L),and high-high(H-H)shown in decomposed image,are known as approximation,vertical detail,horizontal detail and diagonal detail sub bands,respectively.High frequency sub bands L-H,H-L,and H-H contain the edge information of the image.The main focus of the present work is on illumination information of an image;hence we are only focusing on L-L sub band[19].Singular value decomposition(SVD)applied on the L-L sub band.Block diagram of calculating correction coefficient is shown in Fig.2.
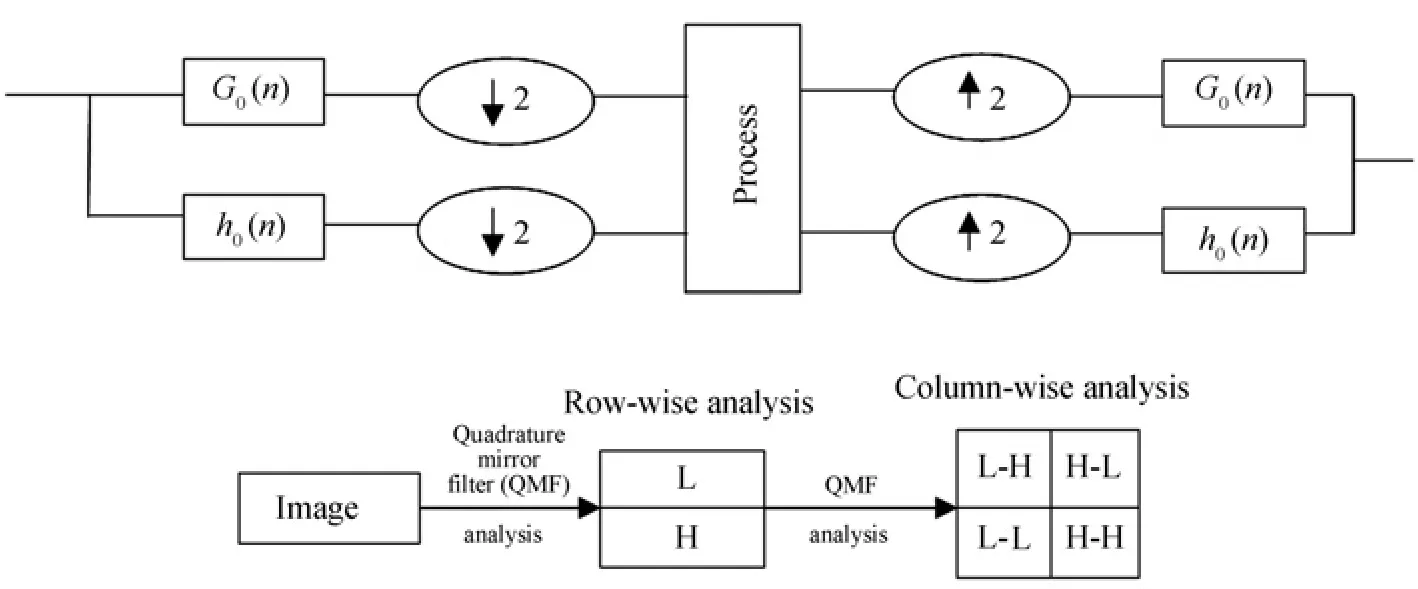
Fig.1.Image decomposition by fractional order differentiator.

Fig.2. Flow chart for calculation of correction coefficient.
Correction coefficient for any singular value matrix is equal to ratio of maximum singular value of the original input imageIto the maximum singular value of output imageI′.Input image has been processed with generalized histogram equalization.The decomposition of image has been performed by applying one dimensional newly designed filter coefficient along the rows of image first and then the results are decomposed along the columns.It produces four decomposed sub-band images referred to as L-L,L-H,H-L and H-H.The original input image has been also processed with the newly designed filter and followed by SVD on L-L band of resultant image.
The correction coefficient is calculated by using the following equation

where ΣLLI′is L-L sub band singular value matrixI′and ΣLLIis the L-L singular value matrix of input image.
The new L-L sub band of imageIis can be computed as follows

Enhanced imageIenhancedhas been reconstructed by using newLLInew,L-H,H-L and H-H sub bands.
The Algorithm 1 describes the detail about design process of filter and their application for image enhancement.Algorithm 1 clearly shows that,there are total five input parameters input image,size of image,length of filter,order of polynomial,and order of derivative.
There are some intermediate variables in algorithm,e.g.,Tas intermediate matrix,ais constant,Wis window matrix,Gamma function.Order of Chebyshev polynomial and length of filter has been taken for initial approximation of given function.We have used the least square polynomial approximation method for approximation of filter function.
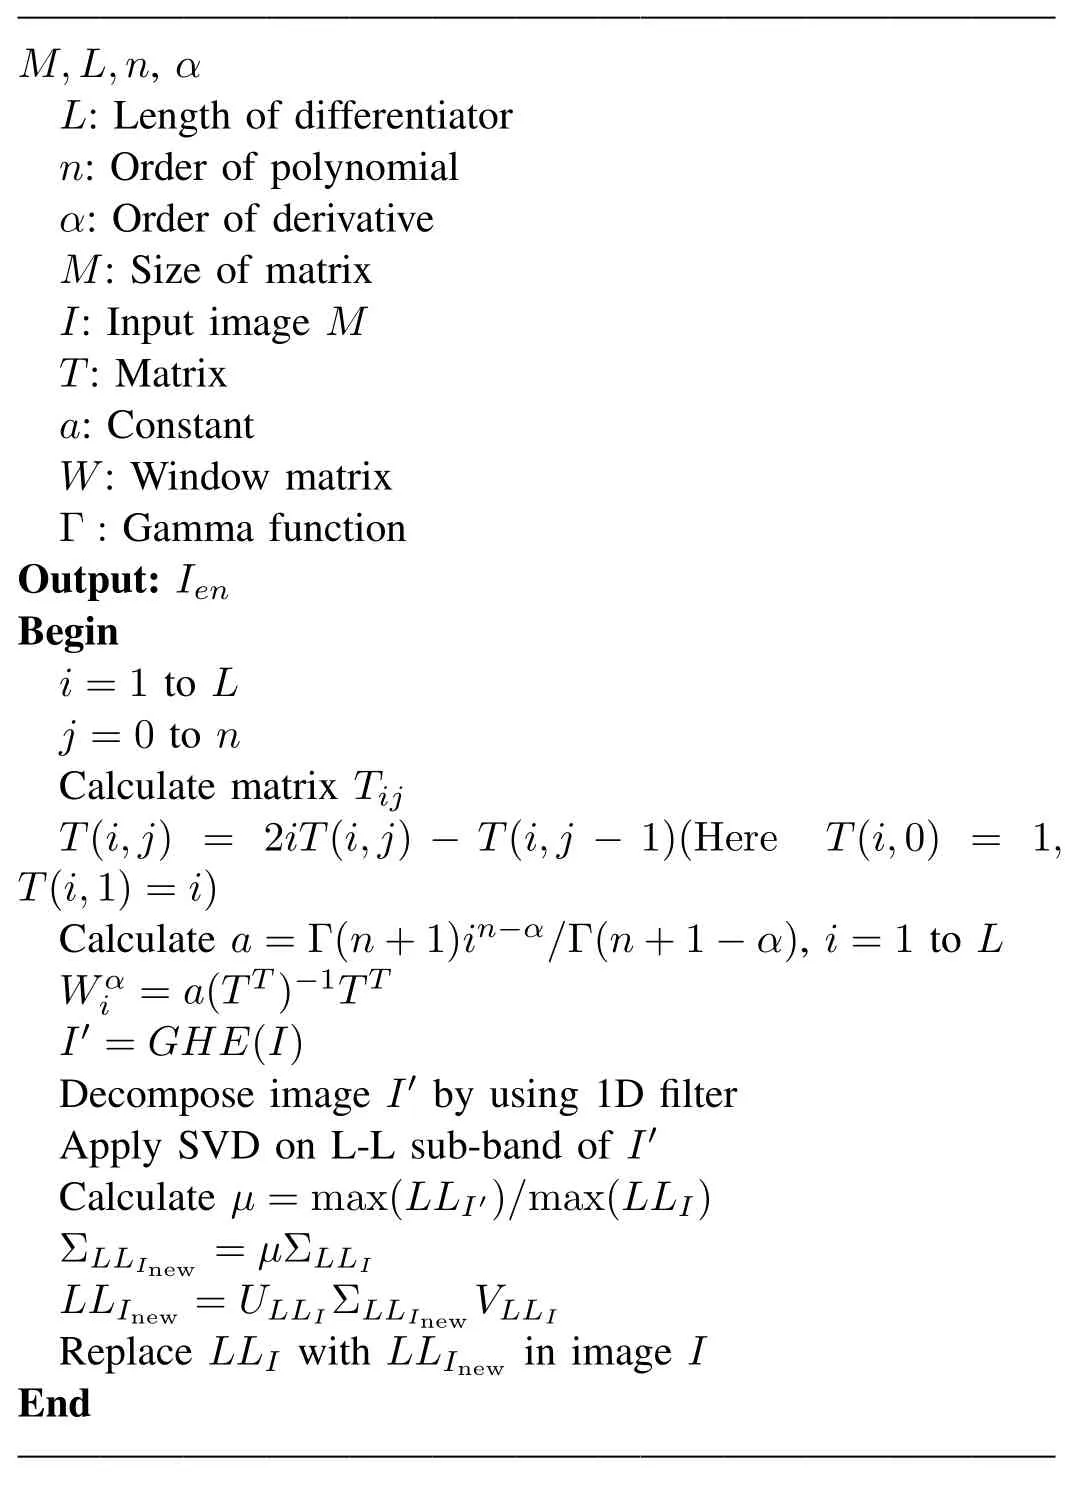
Algorithm 1(I,M,L,n,α,Ien)
The proposed algorithm has two major parts;one is calculation of filter coefficient by use of Chebyshev polynomial and fractional order derivative algorithm which is based on the approximation concept.The second part accomplishes the decomposition of image by newly designed filters and calculation of correction coefficient by applying SVD on L-L sub band decomposed images.The singular value of L-L sub band has been updated by the new value of correction coefficient.
Proposed algorithm is only affecting the L-L sub-band of image.It has been expected that the algorithm has minimum effect on the edges of input image.The edge of image has been found by applying the Canny edge detection algorithm[39].The detail analysis of effect of order of differentiation on edges has been also analyzed in the proposed article.
III.EXPERIMENT
The algorithm has been validated with three test cases.Each test case is having one test image.Images have been chosen in such a way that they should represent the contrast properties as well as geometric properties.
A.Test Case 1
Fig.3 shows the test image chosen to validate our algorithm.This image has geometrical resolution properties built in it.The contrast of the image is very low.Contrast enhancement has been performed by using our algorithm with different values ofα.
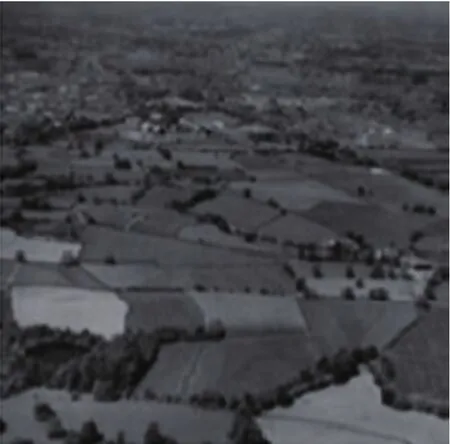
Fig.3. Image for test case 1.
The effect of the contrast enhancement performed by the algorithm on the edges has been analyzed.
B.Test Case 2
The image shown in Fig.4 is used for validation of the algorithm.This image represents the contrast resolution properties.The experiment has been performed on the low contrast mars images taken from the website of Jet Propulsion Laboratory of California Institute of Technology[40].Enhancement has been performed for different fractional order differentiators.The average grey scale value,of edges of image shown in fig.4,has been studied after performing the enhancement.
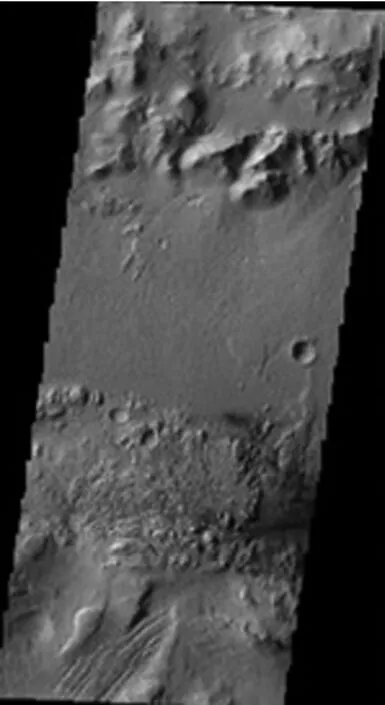
Fig.4. Image for test case 2.
C.Test Case 3
Fig.5 represents an image which is also used for validation.This image has geometric as well as contrast properties.Different values ofαhave been used for enhancement.This experiment has been performed on Lena image.The study of average grey scale values of edges has been performed for this image also.

Fig.5. Image for test case 3.
IV.RESULTS AND DISCUSSION
The algorithm has been tested on the images shown in Figs.3-5.Chenet al.[26]have proposed the optimal values ofαas 0.29,0.40 and 0.53,hence;we have chosen three different values ofα,i.e.,0.29,0.40 and 0.53 for our experiments.Coefficients of newly designed differentiator have bee n calculated forL=9 andn=2.Table I shows the values of all the coefficients of newly designed one-dimensional filterfor three different order of differentiation.The order of differentiation has been taken for performing these experiments areα=0.29,0.40 and 0.53.Coefficient for the high pass filter can be obtained by using(10).These filters coefficients have been used for the enhancement purpose.Figs.6-8 represent the enhanced images belonging to test case 1,test case 2 and test case 3,respectively.Fig.7 clearly shows that the enhanced images are much better in visual quality.The experimental results also show the effect of order of differentiation on enhancement quality of input image for both type contrast resolution as well as geometrical resolution types.

TABLE IVALUE OF DIFFERENTIATOR FOR DIFFERENTα
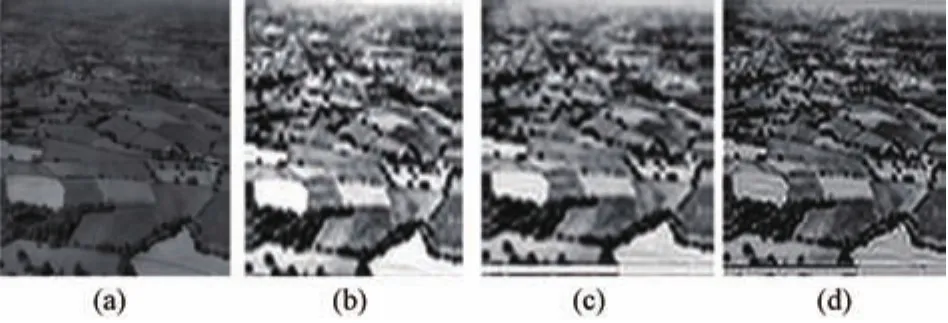
Fig.6. (a)Original low-contrast image.(b)Enhanced image with α=0.29.(c)Enhanced image with α =0.4.(d)Enhanced image with α =0.53.
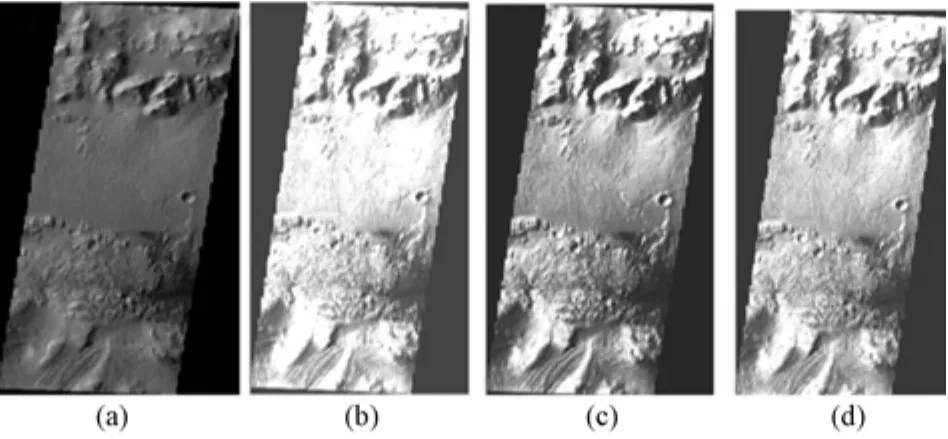
Fig.7. (a)Original low-contrast image.(b)Enhanced image with α=0.29.(c)Enhanced image with α =0.4.(d)Enhanced image with α =0.53.
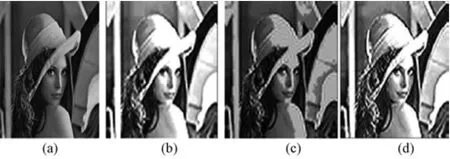
Fig.8.(a)Original low-contrast image.(b)Enhanced image with α=0.29.(c)Enhanced image with α =0.4.(d)Enhanced image with α =0.53.
We have found that visual contrast enhancement has been achieved by our algorithm.We have applied our algorithm only on L-L band of original image.It is expected that the effect of enhancement should be minimum on the edges.Average grey scale value study has been performed on the edges on the images shown in the Figs.3-5.It has been observed that the order of derivative also affect the quality of enhancement.The enhancement quality by proposed algorithm also depend on the type of image,i.e.,image belonging to contrast resolution property or geometrical resolution property or image contain both types of properties.
Enhancement has been performed with different values ofα.Canny edge detection algorithm is an effective and popular algorithm for edge detection of any image.It has been performed on the enhanced images obtained by our algorithm.Average grey scale values of the edges have been calculated from result obtained from canny edge detection algorithm.Table II shows different average grey scale values obtained for differentα.The grey scale value of edges has been calculated for ten different orders of differentiation ranging from 0.1 to 1.The average grey scale value of edges of original test images is 0.0984,0.1631 and 0.0962 for test case 1,test case 2 and test case 3,respectively.It has been found that the average scale value of edges of enhanced image is closed to the original grey scale value of edges atα=0.1.Table II describes the average grey scale values of edges of enhanced images.Average grey scale value of edges for case 1,2 and 3 at different order of differentiation has been shown in column 2,3 and 4 of Table II,respectively.It has been found in case 1 that average grey scale value of edges increases with the increase in order of differentiation.This increase is continuous until the order of differentiation is 0.9.The average grey scale value of edges decreases sharply for the order of differentiation from 0.9 to 1.0.Case 1 represents the images having geometrical resolution properties.The column 3 in Table II describes the average grey scale values for test case 2 image which contain the contrast resolution properties.Numerical values of average grey scale of edges of enhanced images have been constantly increases from the 0.1th order of differentiation to 0.6th order of differentiation.Sharp change has been noticed in average grey scale value of edges of enhanced images when order of differentiation lies between 0.6 and 0.8.A decrement in the numerical values of average grey scale has been found for higher order of differentiator.The column 4 of Table II shows the average grey scale values of edges of enhanced images for test case 3 image which contains the geometrical properties as well as the contrast properties of an image.A similar behaviour has been found in numerical values of grey scale.The sharp decline starts at 0.8th order of differentiation.The value of grey scale atα=0.7 is 0.1886,0.2037 and 0.1473 for test case 1,test case 2 and test case 3,respectively.We have found that the average grey scale value of edges is increasing for different higher fractional order differentiator.It starts decreasing whenαis greater than 0.7 in all these cases.The average grey scale value of edges of enhanced images is increases from 0.7th to 0.8th order and starts deceasing when order of differentiation lies from 0.8 to 0.9.Figs.9-11 show the pictorial behaviour of average grey scale value of edges verses fractional order.
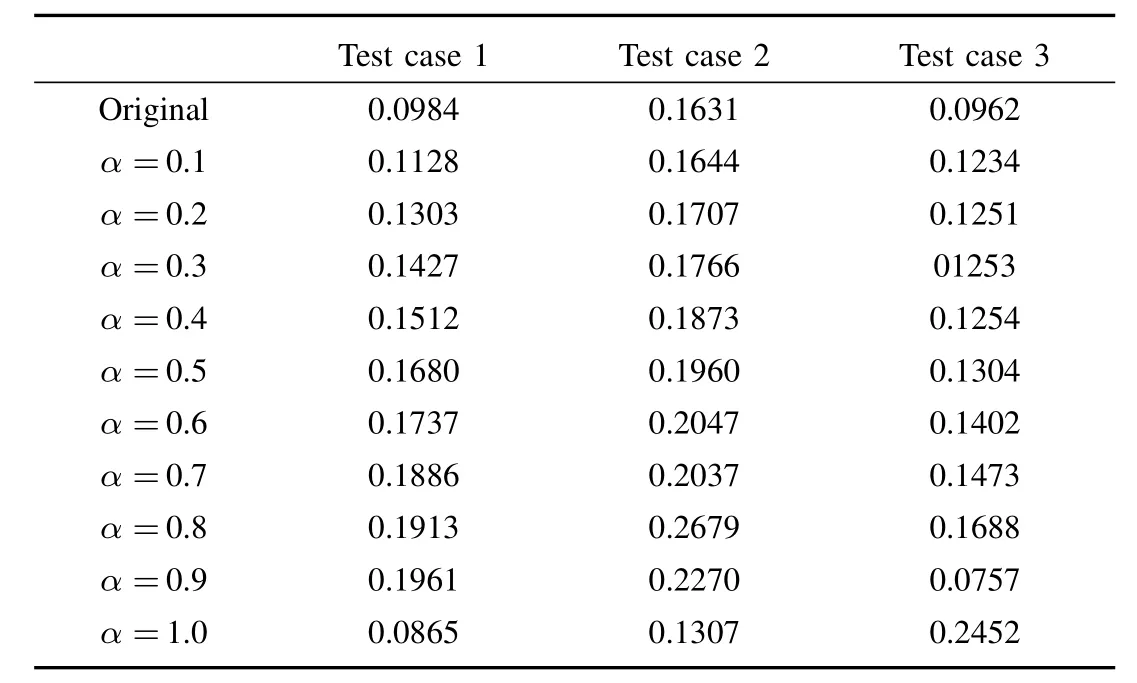
TABLE IIVARIATION OF AVERAGE GRAY SCALE VALUE OF EDGES
Performance of proposed algorithm has been compared with traditional enhancement algorithms like histogram equalization(HE),contrast limited adaptive histogram equalization(CLAHE).Fig.9 shows pictorial form of variation of the average grey value of edges for test case 1 with order of differentiation.The length of filter and order of Chebyshev polynomial is 9 and 2,respectively.It has been observed that average grey scale value of edges first increases with increase in the order of differentiator upto 0.9 and then decreases sharply.The rate of change of average grey scale value is less for order of differentiation between 0.7 to 0.9 as compared to rate of change for order of differentiation between 0.1 and 0.7.The average grey scale value is again close to the original grey scale value when we choose the order of differentiator close to 1.Fig.9 indicates that if we choose order of differentiator in between 0.9 to 1.0,then we will have the average grey scale value close to original one.Table III describes the values of mean absolute error(MAE),absolute mean brightness error(AMBE)and peak signal to noise error(PSNR).These parameters are de fined as follows
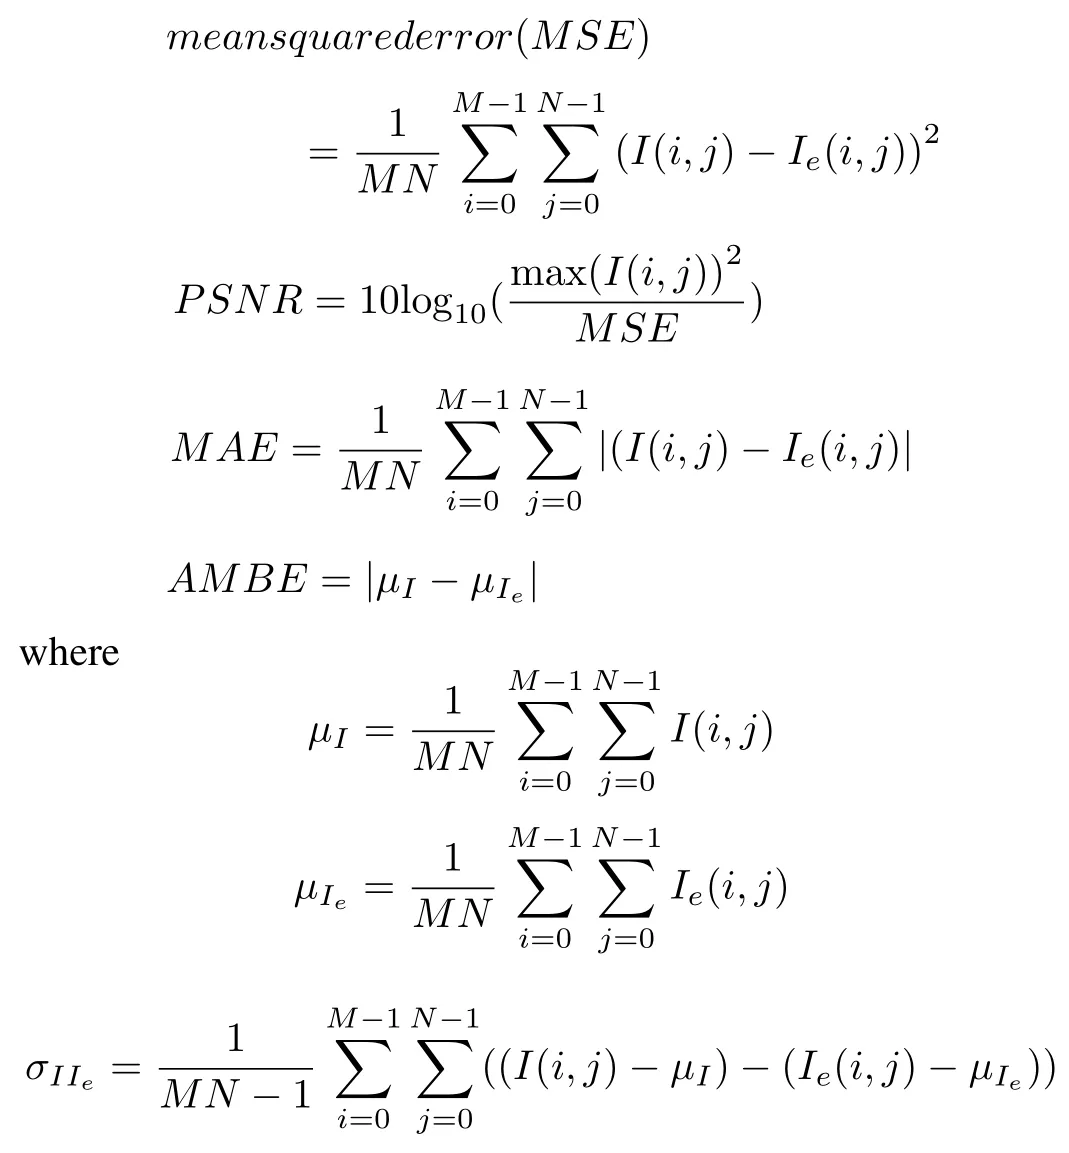
whereI(i,j)andIe(i,j)represents the original image and enhanced image,respectively.
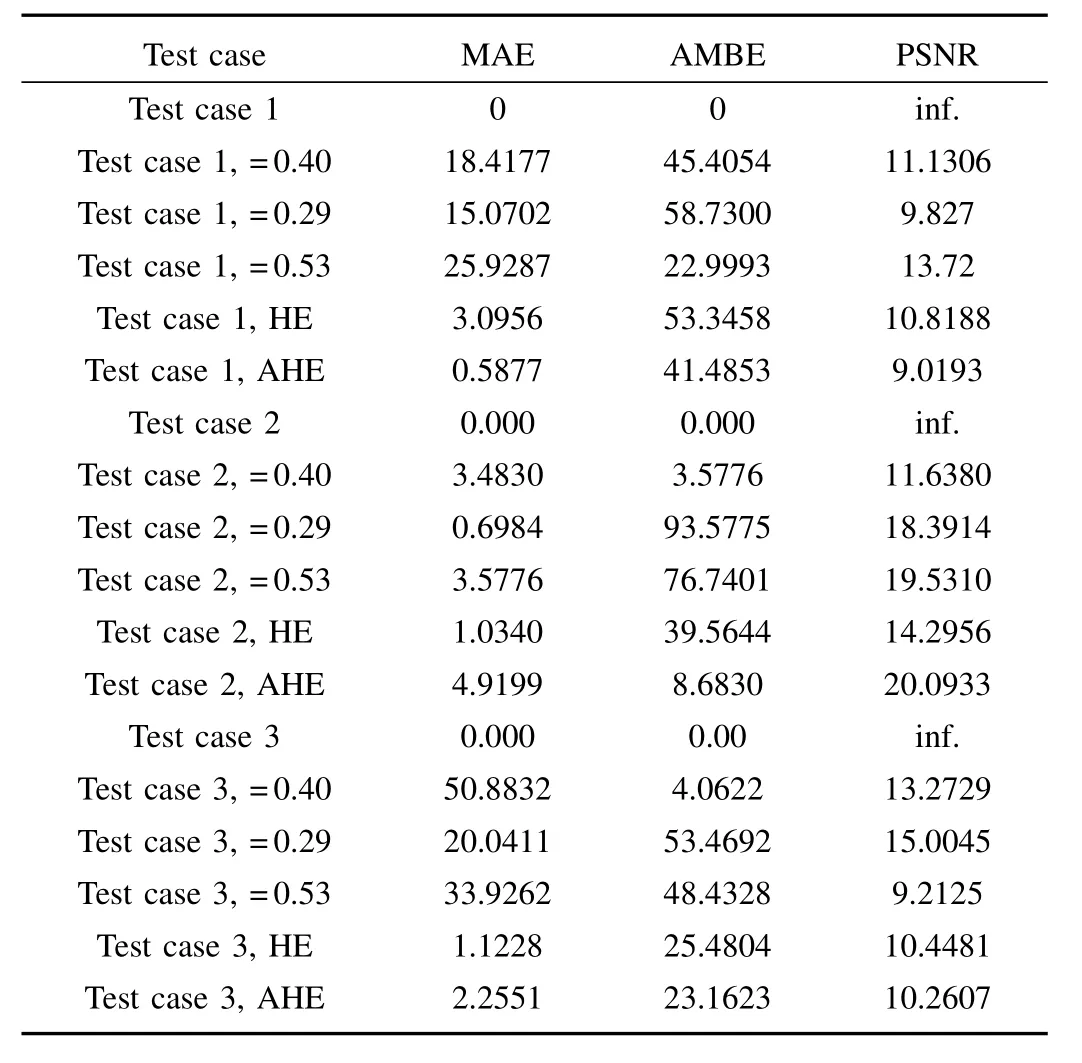
TABLE IIIVALUE OF MAE,AMBE AND PSNR FOR ALL TEST CASES
The change of average grey scale values with respect to order of differentiation for images chosen in test case 2 has been shown in Fig.10.Order of Chebyshev polynomial and length of filter has been taken as 2 and 9,respectively for performing this experiment.Fig.10 clearly shows that the value of average grey scale of edges of enhanced images increases from 0.1th order of differentiation to 0.7th order of differentiation.It has been observed that when order of differentiation lie between 0.7 to 0.9 the average grey scale value,of edges of enhanced images,is showing different behaviour.We have performed 0.8th order of differentiation.The average grey scale of edges is decreasing and then increasing up to 0.9th order.Fig.11 shows the plot between the order of the grey scale value of edges sharply decrease from 0.9th order of differentiation to 1.0th order of differentiation.The average grey scale values of edges of enhanced image will be approximately equal to original grey scale value of edges of original image when order of differentiation lies between 0.9th to 1.0th.Table III clearly shows that the value of PSNR is lower with respect to traditional values for all three test cases.We know that the value of PSNR increases when image quality increases.The value of MAE is also decreases.The value of AMBE has been tabulated in Table III for all three test cases.It has been observed that its value is lowest when order of derivative becomes 0.4 for test case 2 and test case 3.Differentiation and the average grey scale value of edges of enhanced images for test case 3 image.
Parameters,order of Chebyshev polynomial and length of filter,for performing this experiment has been taken as 2 and 9,respectively.Fig.11 clearly show that when order of differentiation varies from 0.1 to 0.7 then the nature of graph is almost same.
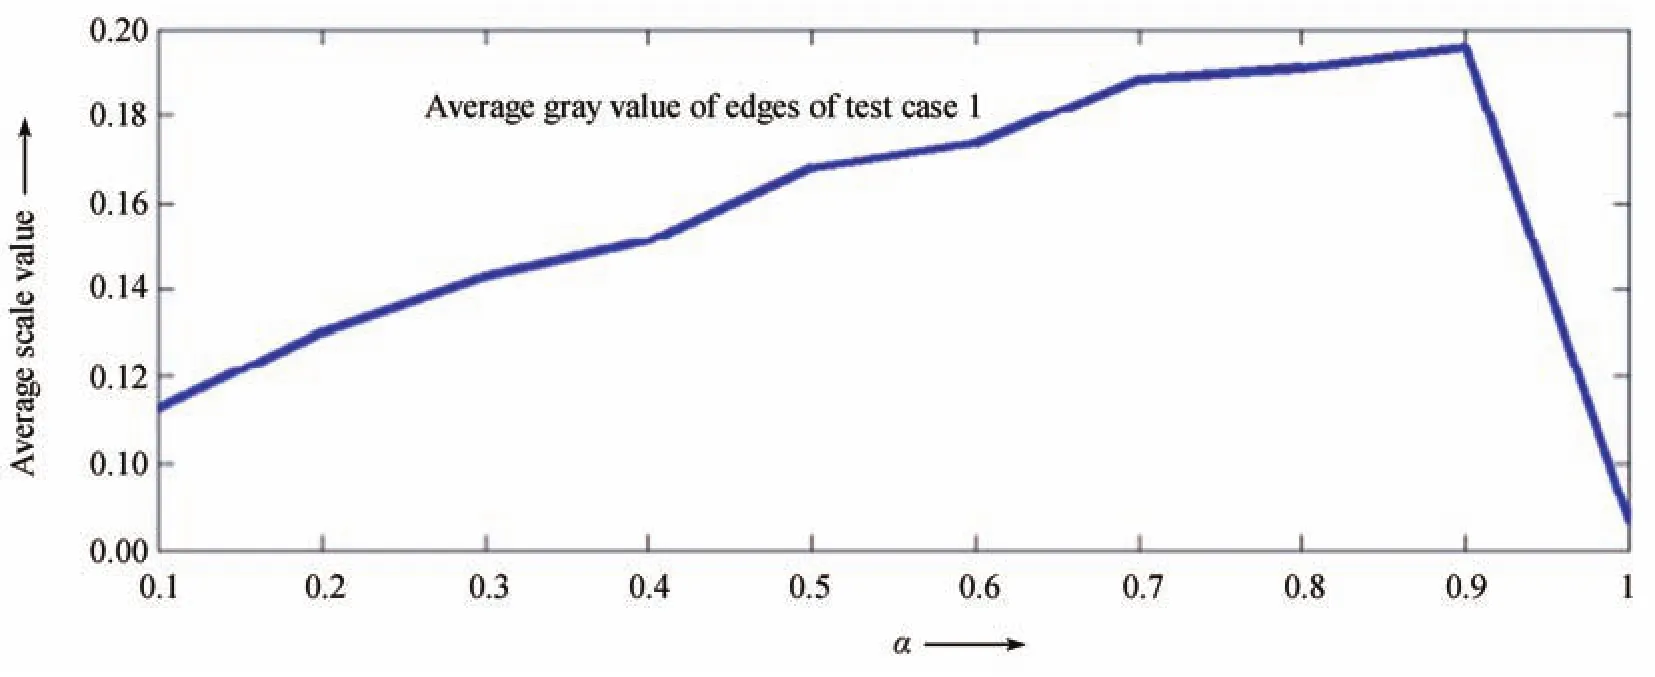
Fig.9. Average gray value of edges of test case 1.
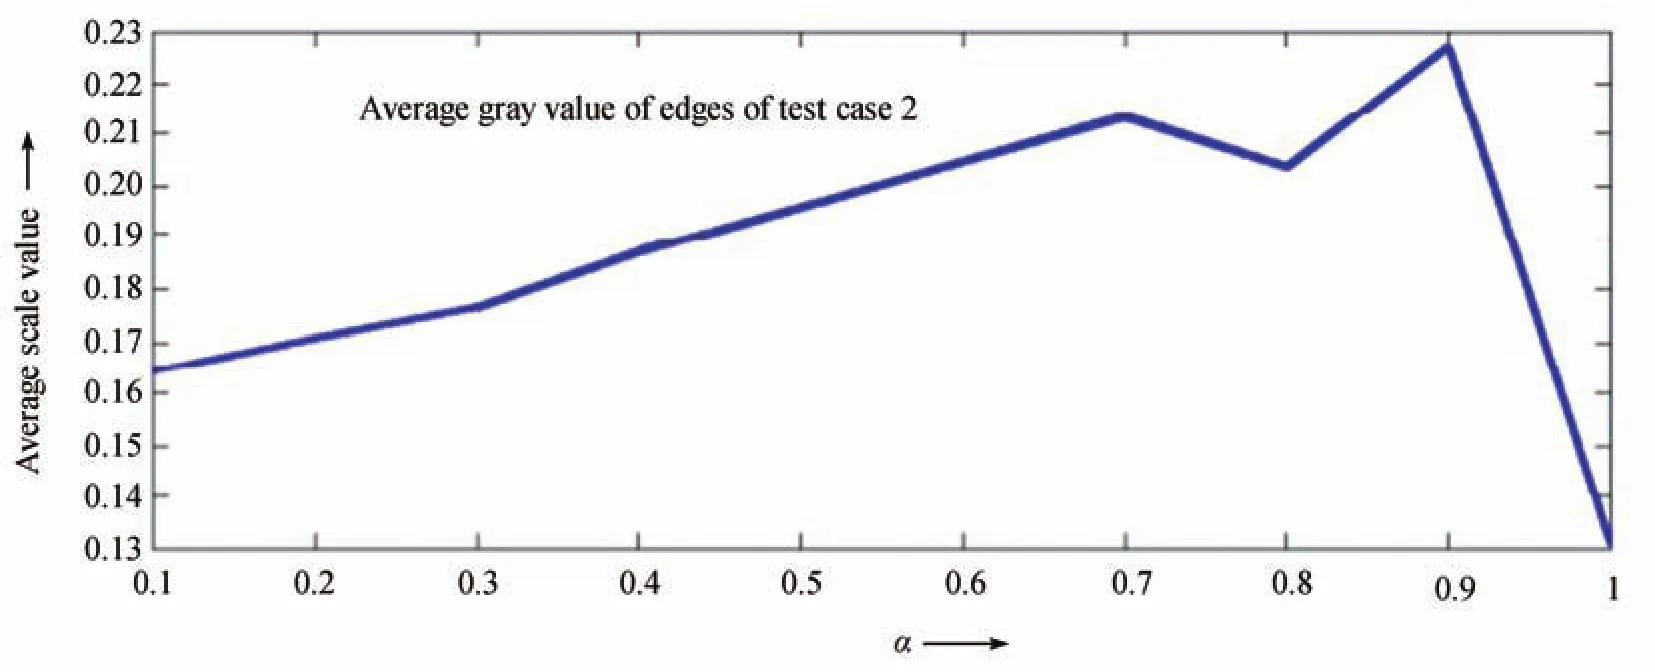
Fig.10. Average gray value of edges of test case 2.
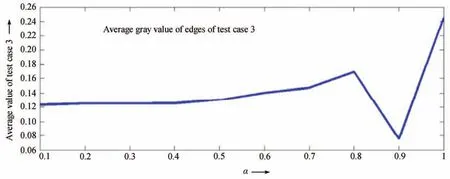
Fig.11. Average gray value of edges of test case 3.
The value of average grey scale of edges of enhanced image slightly increases from 0.7th order of differentiation to 0.8th order of differentiation.The value of average grey scale of edges of enhanced images has sharply decreased at 0.8th order of differentiation.
It has been noticed that when order of differentiation varies from 0.8th to 0.9th the value of average grey scale of edges of enhanced image is showing decreasing behaviour.There are sharp changes in average grey scale value of edges of enhanced images at 0.9th order of differentiation and value is of increasing nature.The test case 3 contains the geometrical resolution properties as well as the contrast resolution properties.We have found similar trend here also and have found that average grey scale value of edges of enhanced image,which is close to original one,lies between the orders of differentiator of 0.9th to 1.0th.Fig.12 shows the results for test case 1 with different existing approaches.Figs.12(a)-(h)show results with adaptive Gamma correction with weighting distribution(AGCWD)[41],bi-histogram equalization with a plateau limit(BHEPL)[42],BHEPL[43],recursive subimage histogram equalization(RSIHE)[44],with CLAHE,with HE and proposed method at order of differentiation 0.7,respectively.
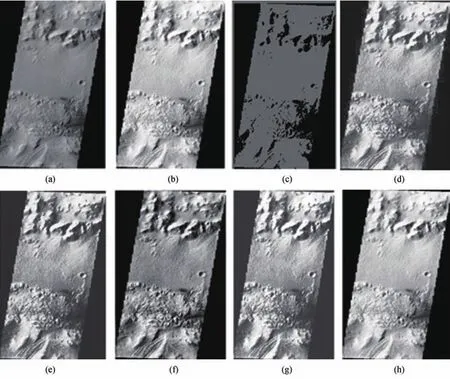
Fig.13.(a)Original image of test case 3.(b)AGCWD[41].(c)BHEPL[42].(d)BHEPL[43].(e)RSIHE[44].(f)With CLAHE.(g)With HE.(h)Proposed method with order 0.7.
Fig.13 shows the comparison of proposed technique with some well known techniques for test case 2.Figs.13(a)-(h)show results with AGCWD[41],BHEPL[42],BHEPL[43],RSIHE[44],with CLAHE,with HE and proposed method at order of differentiation 0.7,respectively.It is noticed that AGCWD produces better quality images however it becomes over enhanced in case of test case 2[41].It has been observed that BHEPED failed to enhance the images[42].Fig.14 shows the comparison of proposed technique with some well known techniques for test case 3.Figs.14(a)-(h)show results with AGCWD[41],BHEPL[42],BHEPL[43],RSIHE[44],with CLAHE,with HE and proposed method at order of differentiation order 0.7,respectively.Test image 2 and test image 3 becomes dark as compared to original images.BHEPL gives signi ficant enhancement but the boundaries of the images become blur[43].The enhancement is not better than the proposed technique.Enhancement produced by RSIHE approach preserves the quality but no significant change in contrast has been noticed[44].
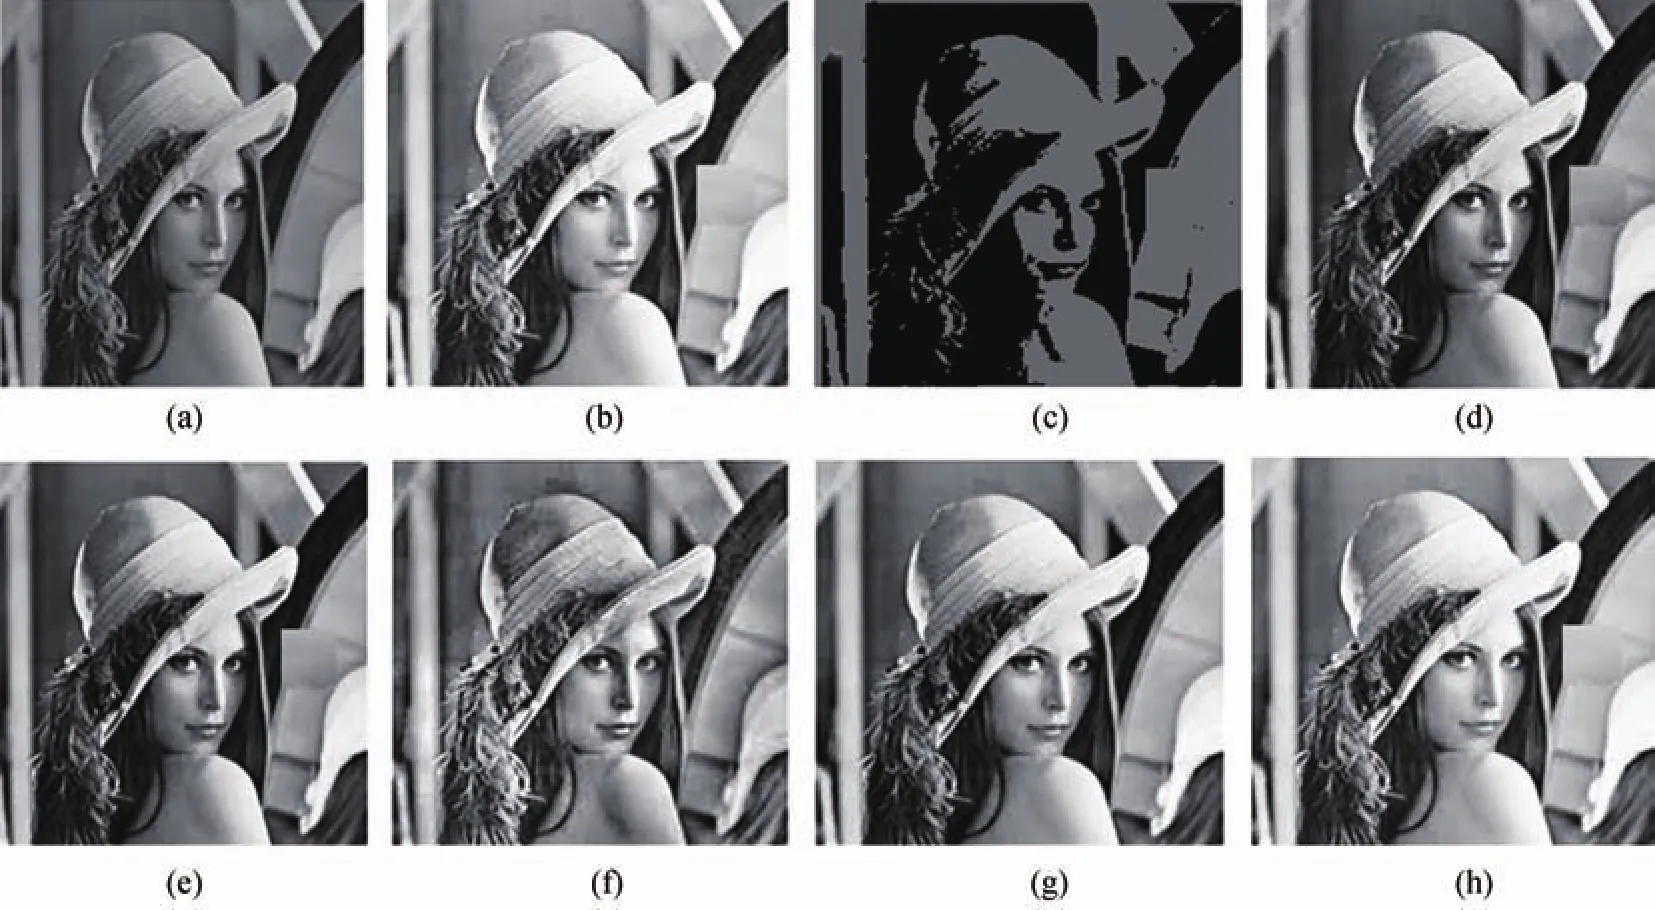
Fig.14.(a)Original image of test case 3.(b)AGCWD[41].(c)BHEPL[42].(d)BHEPL[43].(e)RSIHE[44].(f)With CLAHE.(g)With HE.(h)Proposed method with order 0.7.
V.CONCLUSION
The major part of algorithm is calculation ofTwhich isO(n×L),application of GHE,decomposition of input image by one-dimensional filter and SVD.It has been reported in literature that the time complexity of GHE isO(M2)whereMis the number of pixels in one side of image.The time complexity of decomposition of images by one-dimensional filter and SVD areO(M2)andO(M3),respectively,for an image ofM×Msize.
The time complexity of the proposed algorithm isO(M3)for an image ofM×Msize.The proposed algorithm has been tested for three different cases.It has been observed that when test image contains only geometrical resolution properties the average grey scale value of edges of enhanced image is showing same behaviour up to 0.9th order of differentiation.A test image which has contrast resolution properties,the average grey scale value of edges of enhanced image is increasing up to 0.7th order of differentiation.Average grey scale value of edges of enhanced image is constant up to 0.7th order of differentiation,slightly increases from 0.7th to 0.8th and sharp decrease from 0.8th to 0.9th and from 0.9th to 1.0th order of differentiation sharp increase in images which has both contrast resolution properties as well as geometrical resolution properties.
Following conclusions are derived from the proposed work:
1)Algorithm is applicable for images having geometric as well as contrast resolution properties.
2)Effect of enhancement on edges is minimum at 0.7 fractional order of differentiator as compared to integer order differentiator.
3)Algorithm is performing better than integer order algorithms.
VI.ACKNOWLEDGMENTS
The present work has been carried out after getting inspired by one of the work of Prof.YangQuan Chen.The authors sincerely thank to Prof.Chen for his valuable suggestions.
[1]A.K.Jain,Fundamentals of Digital Image Processing.Englewood Cliffs,NJ:Prentice Hall,1989.
[2]R.C.Gonzalez and R.E.Woods,Digital Image Processing.3rd ed.New Delhi,India:Pearson Prentice Hall,2009.
[3]A.A.Michelson,Studies in Optics.Chicago,IL,USA:University of Chicago Press,1927.
[4]E.Peli,“Contrast in complex images,”J.Opt.Soc.Am.A,vol.7,no.10,pp.2032-2040,Oct.1990.
[5]J.S.Tang,E.Peli,and S.Acton,“Image enhancement using a contrast measure in the compressed domain,”IEEE Signal Process.Lett.,vol.10,no.10,pp.289-292,Oct.2003.
[6]A.M.Grigoryan and S.S.Agaian,“Transform-based image enhancement algorithms with performance measure,”inAdvances in Imaging and Electron Physics,New York,USA:Academic,2004,pp.165-243.
[7]S.S.Agaian,B.Silver,and K.A.Panetta,“Transform coefficient histogram-based image enhancement algorithms using contrast entropy,”IEEE Trans.Image Process.,vol.16,no.3,pp.741-758,Mar.2007.
[8]S.S.Agaian,K.Panetta,and A.M.Grigoryan,“Transform-based image enhancement algorithms with performance measure,”IEEE Trans.Image Process.,vol.10,no.3,pp.367-382,Mar.2001.
[9]S.Aghagolzadeh and O.K.Ersoy, “Transform image enhancement,”Opt.Eng.,vol.31,no.3,pp.614-626,Mar.1992.
[10]V.Caselles,J.L.Lisani,J.M.Morel,and G.Sapiro,“Shape preserving local histogram modification,”IEEE Trans.Image Process.,vol.8,no.2,pp.220-230,Feb.1999.
[11]J.A.Stark,“Adaptive image contrast enhancement using generalizations of histogram equalization,”IEEE Trans.Image Process.,vol.9,no.5,pp.889-896,May2000.
[12]Y.T.Kim,“Contrast enhancement using brightness preserving Bihistogram equalization,”IEEE Trans.Consum.Electron.,vol.43,no.1,pp.1-8,Feb.1997.
[13]L.Dash and B.N.Chatterji,“Adaptive contrast enhancement and deenhancement,”Pattern Recognit.,vol.24,no.4,pp.289-302,Jan.1991.
[14]S.D.Chen and A.R.Ramli,“Minimum mean brightness error Bihistogram equalization in contrast enhancement,”IEEE Trans.Consum.Electron.,vol.49,no.4,pp.1310-1319,Nov.2003.
[15]Y.Wang,Q.Chen,and B.Zhang,“Image enhancement based on equal area dualistic sub-image histogram equalization method,”IEEE Trans.Consum.Electron.,vol.45,no.1,pp.68-75,Feb.1999.
[16]T.Arici,S.Dikbas,and Y.Altunbasak,“A histogram modification framework and its application for image contrast enhancement,”IEEE Trans.Image Process.,vol.18,no.9,pp.1921-1935,Sep.2009.
[17]C.C.Sun,S.J.Ruan,M.C.Shie,and T.W.Pai,“Dnamic contrast enhancement based on histogram specification,”IEEE Trans.Consum.Electron.,vol.51,no.4,pp.1300-1305,Nov.2005.
[18]H.Ibrahim and N.S.P.Kong,“Brightness preserving dynamic histogram equalization for image contrast enhancement,”IEEE Trans.Consum.Electron.,vol.53,no.4,pp.1752-1758,Nov.2007.
[19]A.Polesel,G.Ramponi,and V J Mathews,“Image enhancement via adaptive unsharp masking,”IEEE Trans.Image Process.,vol.9,no.3,pp.505-510,Mar.2000.
[20]F.P.De Vries,“Automatic,adaptive,brightness independent contrast enhancement,”Signal Process.,vol.21,no.2,pp.169-182,Oct.1990.
[21]S.K.Mitra,Digital Signal Processing:A Computer-Based Approach.3rd ed.New York,USA:McGraw Hill,2006.
[22]G.Ramponi,“A cubic unsharp masking technique for contrast enhancement,”Signal Process.,vol.67,no.2,pp.211-222,Jun.1998.
[23]G.Ramponi,N.Strobel,S.K.Mitra,and T.H.Yu,“Nonlinear unsharp masking methods for image contrast enhancement,”J.Electron.Imaging,vol.5,no.3,pp.353-366,Jul.1996.
[24]S.K.Mitra,H.Li,I.S.Lin,and T.H.Yu,“A new class of nonlinear filters for image enhancement,”inProc.IEEE Int.Conf.Acoustics,Speech,Signal Processing,Toronto,Ontario,Canada,1991,pp.2525-2528.
[25]D.L.Chen,Y.Q.Chen,and D.Y.Xue,“Digital fractional order savitzky-golay differentiator,”IEEE Trans.Circuits Syst.II:Express Briefs,vol.58,no.11,pp.758-762,Nov.2011.
[26]D.L.Chen,Y.Q.Chen,and D.Y.Xue,“1-D and 2-D digital fractionalorder Savitzky-Golay differentiator,”Signal Image Video Process.,vol.6,no.3,pp.503-511,Sep.2012.
[27]H.Demirel and G.Anbarjafari,“Satellite image resolution enhancement using complex wavelet transform,”IEEE Geosci.Remote Sens.Lett.,vol.7,no.1,pp.123-126,Jan.2010.
[28]H.Demirel,C.Ozcinar,and G.Anbarjafari,“Satellite image contrast enhancement using discrete wavelet transform and singular value decomposition,”IEEE Geosci.Remote Sens.Lett.,vol.7,no.2,pp.333-337,Apr.2010.
[29]K.B.Oldham and J.Spanier,The Fractional Calculus.New York,USA:Academic,1974.
[30]I.Podlubny,Fractional Differential Equations,Mathematics in Science and Engineering.Vol.198.California,USA:Academic Press,1999.
[31]S.Das,Functional Fractional Calculus for System Identification and Controls.Berlin,Heidelberg,Germany:Springer-Verlag,2008.
[32]J.A.T.Machado,“Calculation of fractional derivatives of noisy data with genetic algorithms,”Nonlinear Dyn.,vol.57,no.1-2,pp.253-260,Jul.2009.
[33]S.Suman and R.K.Jha,“A new technique for image enhancement using digital fractional-order Savitzky-Golay differentiator,”Multidimens.Syst.Signal Process.,vol.28,no.2,pp.709-733,Apr.2017.
[34]R.K.Pandey,S.Suman,K.K.Singh,and O.P.Singh,“An approximate method for Abel inversion using Chebyshev polynomials,”Appl.Math.Comput.,vol.237,pp.120-132,Jun.2014.
[35]A.Kumar,S.Suman,and G.K.Singh,“A new closed form method for design of variable bandwidth linear phase FIR filter using different polynomials,”AEU-Int.J.Electron.Commun.,vol.68,no.4,pp.351-360,Apr.2014.
[36]J.C.Mason,“Some properties and applications of Chebyshev polynomial and rational approximation,”inRational Approximation andInterpolation,Lecture Notes in Mathematics,P.R.Graves-Morris,E.B.Saff,and R.S.Varga,Eds.Berlin,Heidelberg,Germany:Springer,vol.1105,pp.27-48,1984.
[37]K.K.Singh,M.K.Bajpai,R.K.Pandey,and P.Munshi,“A novel non-invasive method for extraction of geometrical and texture featuresofwood,”Res.Nondestruct.Eval.,2016.doi:10.1080/09349847.2016.1148214.
[38]M.Bajpai,C.Schorr,M.Maisl,P.Gupta,and P.Munshi,“High resolution 3D image reconstruction using the algebraic method for cone-beam geometry over circular and helical trajectories,”NDT E Int.,vol.60,pp.62-69,Dec.2013.
[39]J.Canny, “A computational approach to edge detection,”IEEE Trans.Pattern Anal.Mach.Intell.,vol.8,no.6,pp.679-698,Nov.1986.
[40]K.K.Singh,M.K.Bajpai,and R.K.Pandey,“A novel approach for edge detection of low contrast satellite images,”ISPRS-International Archives of the Photogrammetry,Remote Sensing and Spatial Information Sciences,2015.DOI:10.5194/isprsarchives-XL-3-W2-211-2015.
[41]S.C.Huang,F.C.Cheng,and Y.S.Chiu,“Ef ficient contrast enhancement using adaptive gamma correction with weighting distribution,”IEEE Trans.Image Process.,vol.22,no.3,pp.1032-1041,Mar.2013.
[42]C.H.Ooi and N.A.M.Isa,“Adaptive contrast enhancement methods with brightness preserving,”IEEE Trans.Consum.Electron.,vol.56,no.4,pp.2543-2551,Nov.2010.
[43]C.H.Ooi,N.S.P.Kong,and H.Ibrahim,“Bi-histogram equalization with a plateau limit for digital image enhancement,”IEEE Trans.Consum.Electron.,vol.55,no.4,pp.2072-2080,Nov.2009.
[44]K.S.Sim,C.P.Tso,and Y.Y.Tan,“Recursive sub-image histogram equalization applied to gray scale images,”Pattern Recognit.Lett.,vol.28,no.10,pp.1209-1221,Jul.2007.
猜你喜欢
杂志排行
IEEE/CAA Journal of Automatica Sinica的其它文章
- Letter to the Editor Re“Fractional Modeling and SOC Estimation of Lithium-ion Battery”
- Relationship Between Integer Order Systems and Fractional Order Systems and Its Two Applications
- An Exploration on Adaptive Iterative Learning Control for a Class of Commensurate High-order Uncertain Nonlinear Fractional Order Systems
- Robust H∞Load Frequency Control of Multi-area Power System With Time Delay:A Sliding Mode Control Approach
- Cyber Attack Protection and Control of Microgrids
- Relief Materials Vehicles Planning in Natural Disasters
