Prediction of fatigue crack growth rate for smallsized CIET specimens based on low cycle fatigue properties
2018-04-21ChenBAOLixunCAIKaikaiSHI
Chen BAO,Lixun CAI,Kaikai SHI
Applied Mechanics and Structure Safety Key Laboratory of Sichuan Province,School of Mechanics and Engineering,Southwest Jiaotong University,Chengdu 610031,China
1.Introduction
The fatigue crack propagation rate per cycle,da/dN,governed by the stress intensity factor range,ΔK,is commonly applied to represent the fracture behavior of a cracked body subjected to cyclic loading.Taking into account local cyclic plastic deformation around the crack tip,the fatigue crack growth behavior can be predicted by the low cycle fatigue property of a material in conjunction with a description of the stress and strain field ahead of the crack tip and an appropriate failure criterion.
Different failure criteria such as critical stress,plastic strain ahead of the crack tip,1the magnitude of crack tip damage accumulation ahead of the crack tip,2–7and strain energy5–13have been used in past fatigue crack growth models.These energy-based criteria are mainly based on the critical level of energy dissipation within the material ahead of the crack tip,and it is found that they are more accurate than other failure criteria in predicting fatigue crack growth behaviors.An important fact generally observed in fatigue crack growth experiments is that the specimen geometry and load ratio can remarkably affect the fatigue crack growth law because of the crack closure effect.14–17Only Shi et al.7introduced an effective stress ratioUto quantify the crack closure effect in a fatigue crack growth model.Here,the used effective stress ratioUcan only eliminate the effect of the load ratio on the fatigue crack growth rate.For different specimen geometries,the transverseT-stress is another factor which may alter the cyclic plastic zone size and further affect the crack closure behavior.16,18Bao et al.19conducted a group of experiments on the fatigue crack growth rate of 5083-H112 aluminum alloy by using traditional Compact Tension(CT)and small-sized C-shaped Inside Edge-notched Tension(CIET)specimens,and the resulted fatigue crack growth curves showed an outstanding difference between two specimen geometries.
The present work aims to predict the fatigue crack growth data reported in Ref.19,according to two types of energy-based fatigue crack growth models based on low cycle fatigue properties by introducing the effective stress ratioUdetermined by different methods.
2.Fatigue crack growth models
2.1.Cyclic stress and strain fields ahead of crack tip
For a crack body subjected to a remote external load,the classical HRR20,21solution is commonly employed to describe the stress and strain fields in the vicinity of the crack tip under a plane stress condition.By introducing the plastic superposition principle,22the cyclic stress and strain fields ahead of the crack tip under small-scale yielding can be obtained from the HRR solution23as follows:
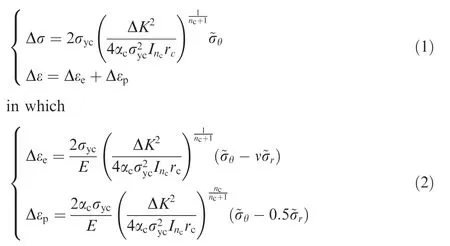
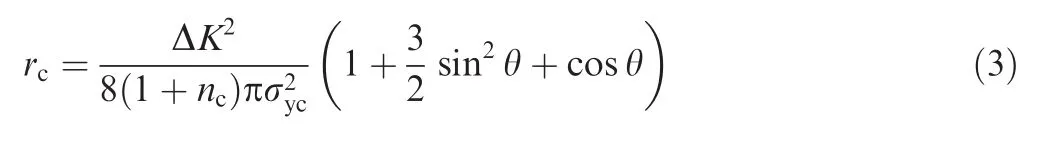
whereEis elastic modulus,Δσ and Δε are the stress and strain ranges,respectively.ΔKis the stress intensity factor range,and(r,θ)are the polar coordinates centered at the crack tip.σycis the reference cyclic yield stress,αcis the cyclic strain hardening coefficient in the Ramberg-Osgood relationship,24andncis the cyclic strain hardening exponent but is the reciprocal of the exponent in the Ramberg-Osgood model.~σθ,~σr,andIncare dimensionless distribution functions only related toncand tabulated by Shih.25rcis the cyclic plastic zone under mode I loading considering the stress redistribution and the strain hardening effect,and its expression under the plane stress condition can be described as13
2.2.Energy-based fatigue crack growth models
In the research of low cycle fatigue behavior,the well-known Manson-Coff i n model is commonly applied to describe the relationship between the strain amplitude,Δε/2,and the number of reversals to failure,2Nf,in the following form:

By taking into consideration the total ductility loss of a material within a cyclic plastic zone,Pandey and Chand12,13developed a fatigue crack growth model based on the low cycle fatigue property as follows:

where ΔKthis the threshold stress intensity factor range.Here,the crack closure effect is not considered in the Pandey&Chand model.Similarly,Shi and Cai5proposed another energy-based fatigue crack growth model according to the equivalence of plastic strain energy within the cyclic plastic zone,and it will be hereafter referred to as the Shi&Cai model.This model is described as follows:
where ρcis the cyclic plastic zone corresponding to ΔKth.To eliminate the effect of crack closure on the fatigue crack growth,Shi et al.7introduced an effective stress ratioUproposed by Antunes et al.26and Codrington et al.27into the Shi&Cai model,which is

Here,the effective stress ratioUis deduced from a rigid perfectly plastic strip-yield model,and is only related by the load ratioR.According to the correction of crack closure using the effective stress ratioU,the Shi&Cai model can be amended by replacing the cyclic plastic zonesrcand ρcwith the effective cyclic plastic zonesreffand ρeffas shown in the following equation:


Fig.1 configurations and dimensions of a straight round bar,a CIET specimen,and a CT specimen.
In fact,not only the load ratioRbut the specimen geometry characterized by the transverseT-stress may also affect the crack closure and further affect the fatigue crack growth behavior.In the work of Bao et al.,19the classical plastic induced crack closure model developed by Newman14,28has been applied to correct the fatigue crack growth curves of CT and CIET specimens with different specimen thicknesses and load ratiosR,and the effective stress ratio is expressed as
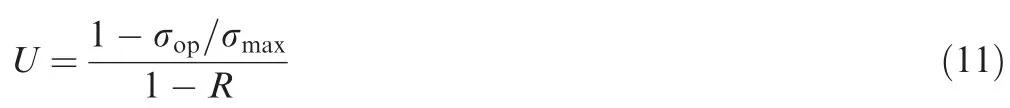
where σopis the crack opening stress,and σmaxis the maximum stress.In order to facilitate the convenience of application,the crack opening stress σophas been simplified as29
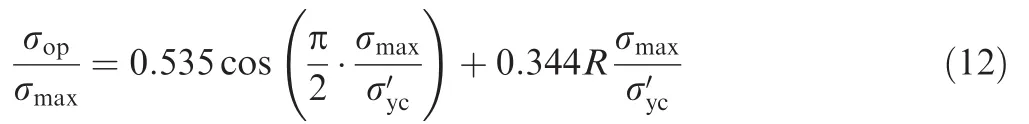
Here,the effective reference cyclic stressis corrected by using theT-stress to consider the effect of the specimen configuration on the fatigue crack growth as follows:

whereT-stress is defined as

in which σxxand σyyare the stress components in thexandydirections applied on the crack face,respectively.TheT-stress for both CT and CIET specimens can be expressed by Ref.19as follows:

Fig.2 Evolution of stress amplitude Δσ/2 with an increasing normalized number of reversals N/Nf.
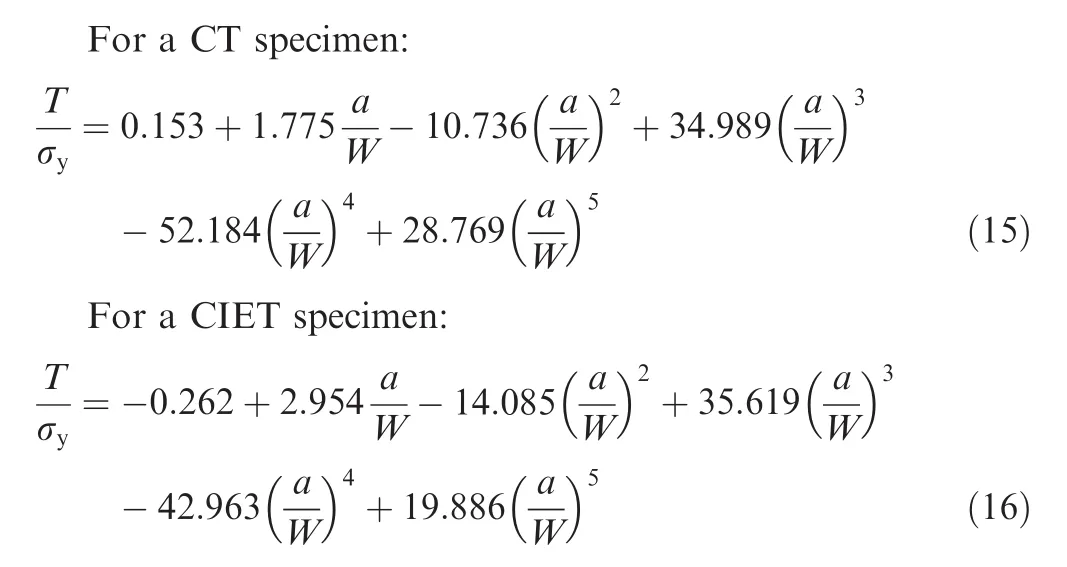
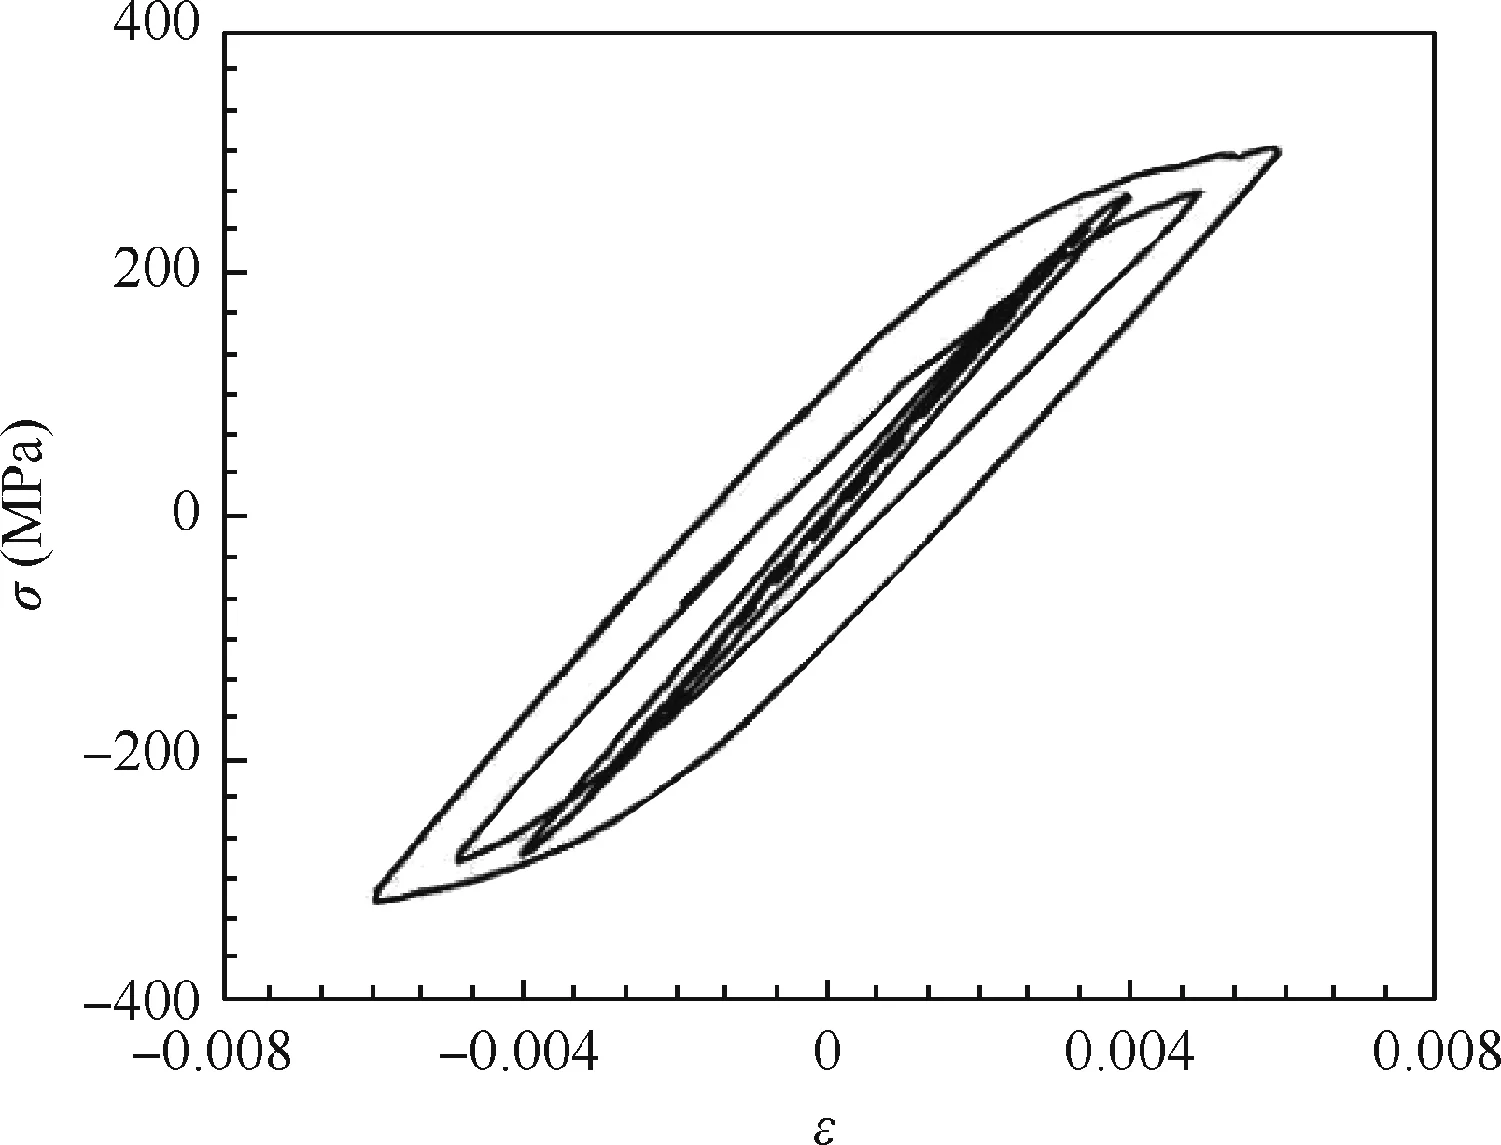
Fig.3 Hysteresis loops of stress σ vs strain ε at different strain amplitudes.
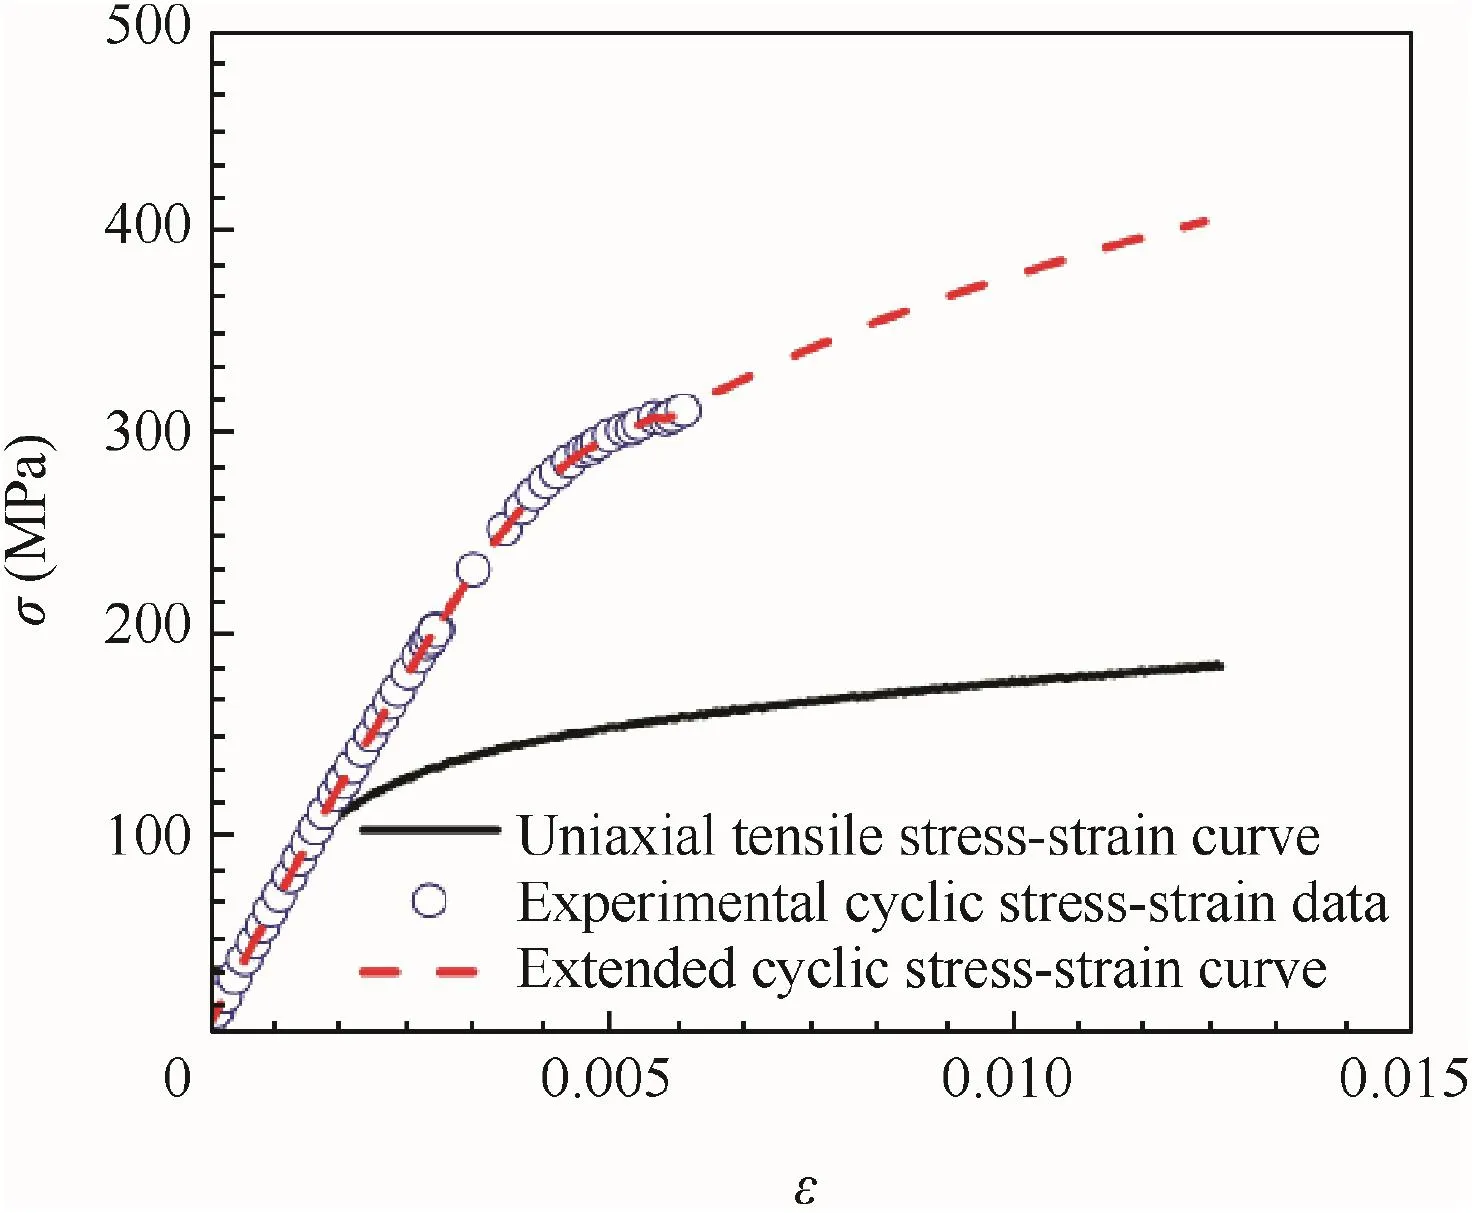
Fig.4 Comparison between stress–strain constitutive curves under uniaxial and cyclic loadings for 5083-H112 aluminum alloy.
where σyis the uniaxial reference yield stress,andWis the specimen width.
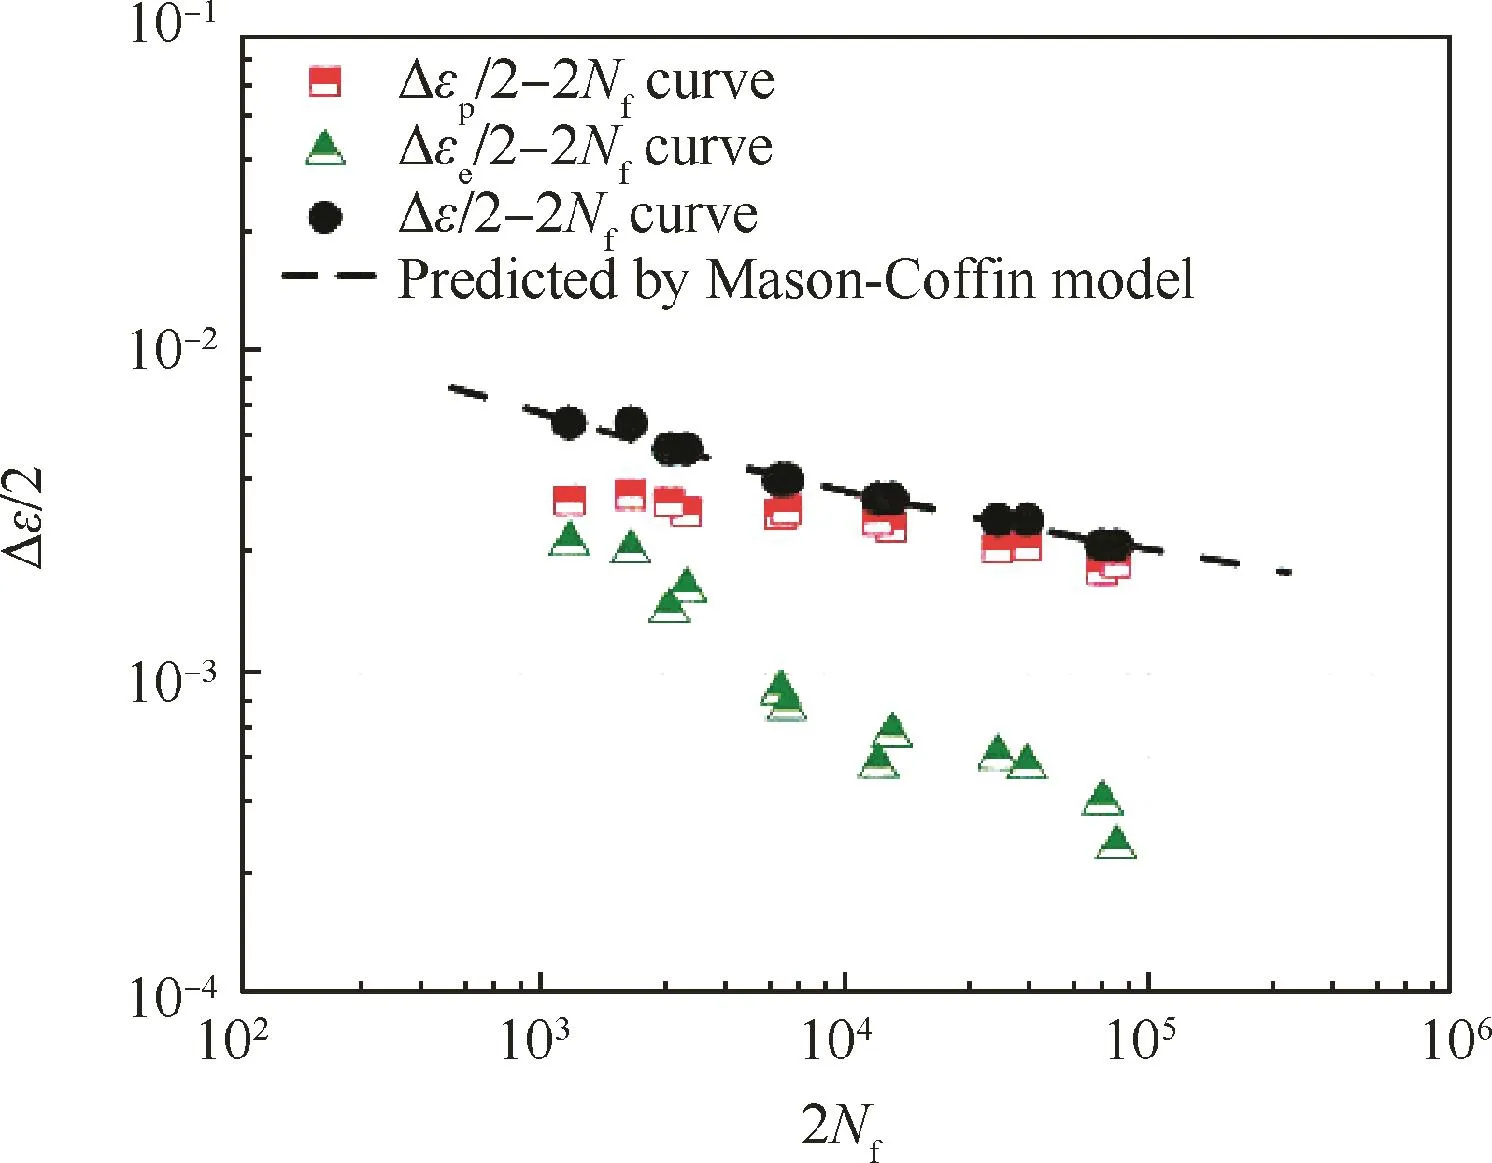
Fig.5 Curves of Δε/2 vs 2Nffor 5083-H112 aluminum alloy.

Fig.6 Experimental da/dN–ΔK curves of CIET and CT specimens for 5083-H112 aluminum alloy.
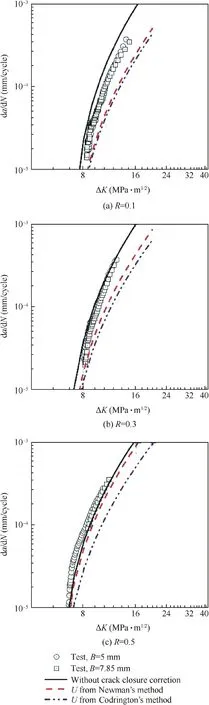
Fig.7 Prediction of da/dN–ΔK curves of CIET specimens according to Pandey&Chand model with different effective stress ratios.

Fig.8 Prediction of da/dN–ΔK curves of CT specimens according to Pandey&Chand model with different effective stress ratios.
The above-discussed energy-based fatigue crack growth models,the Pandey&Chand model and the Shi&Cai model,will be applied to predict the fatigue crack growth curves of CIET and CT specimens based on low cycle fatigue properties.Simultaneously,the correction of crack closure with different effective stress ratios given by Newman’s method(Eqs.(11)–(16))and Codrington’s method(Eq.(9))will be compared in the prediction of fatigue crack growth curves in detail.
3.Materials and experimental procedure

Fig.9 Prediction of da/dN–ΔK curves of CIET specimens according to Shi&Cai model with different effective stress ratios.
A typical aluminum alloy 5083-H112 was employed to carry out the tests of low cycle fatigue and fatigue crack growth rate in this study.Its chemical composition is:Si+Fe,0.45%;Cu,0.1%;Mn,0.1%;Mg,2.2%–2.8%;Cr,0.15%–0.35%;Zn,0.1%;in weight.The mechanical properties of this alloy are:elastic modulusE=86.6 GPa,yield stress σs=141 MPa,ultimate strength σb=297 MPa,and elongation after fracture δ=15%.As shown in Fig.1,a group of straight round bars with a diameter of 5 mm was used for low cycle fatigue tests at room temperature,and traditional CT and small-sized CIET specimens with different thicknesses were applied in the tests of fatigue crack growth rate under load ratiosR=0.1,0.3,0.5 at room temperature,respectively.The thicknesses of the used CT specimens areB=5,10 mm,and those of CIET specimens areB=5,7.85 mm.The other dimensions of these three types of specimens are given in Fig.1.
All the tests were conducted on an electromechanical test machine MTS 809 with a load frame of 25 kN capacity under tension.A standard Crack Opening Displacement(COD)extensometer MTS632.02F-20 with a gage length of 5 mm and a full range of 4 mm was used to measure the CODs of CT and CIET specimens. A strain extensometer MTS632.54F-14 with a gage length of 12 mm and a full range of±10%was applied to measure the strain of a straight round bar.The low cycle fatigue test was controlled by the strain of the work zone of a straight round bar at a strain rate of 0.006 s-1under different levels of strain amplitude,and the load ratio was-1.The compliance technique as indicated in Ref.19was applied to measure the real-time crack lengths of CIET and CT specimens in the fatigue crack growth rate tests.
4.Results and discussion
4.1.Experimental results of low cycle fatigue and fatigue crack growth rate
Fig.2 gives the change of the stress amplitude,Δσ/2,with an increasing number of reversals normalized by the number of reversals to failure,N/Nf,at different controlling strain amplitudes,Δε/2.At the beginning of the number of reversals,the stress amplitude increases sharply,and then almost keeps constant.It is indicated that the used 5083-H112 aluminum alloy is cyclically steady in the behavior of low cycle fatigue.By extracting the records of strain and stress at the steady phase of the stress amplitude evolution in Fig.2 for each specimen,the hysteresis loops of stress σ versus strain ε at different strain amplitudes are shown in Fig.3.
By extracting the upper vertex of the stable stress-strain hysteresis loop at different levels of controlling strain amplitude,a cyclic stress-strain curve can be obtained,as shown in Fig.4.Additionally,this cyclic stress-strain curve can be described by using a power function as
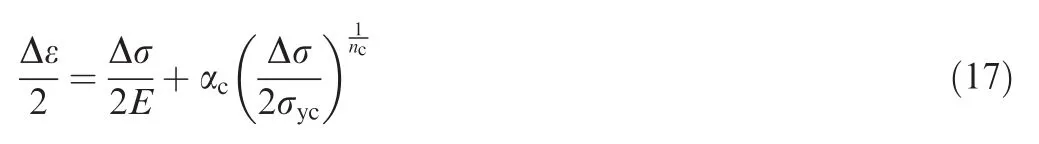
where αc=0.173,σyc=230 MPa,andnc=0.214.

Fig.10 Prediction of da/dN–ΔK curves of CT specimens according to Shi&Cai model with different effective stress ratios.
From Fig.4,5083-H112 aluminum alloy exhibits remarkable cyclic hardening compared with the uniaxial constitutive curve.Additionally,the maximum cyclic strain amplitude is only 0.006 which is extracted from test data,but it is now extended to 0.012 to meet the requirement of prediction of the fatigue crack growth rate via Eq.(16).Fig.5 presents the curves of the strain amplitude, Δε/2,versus the number of reversals to failure,2Nf.Here,the elastic part Δεe/2–2Nfcurve and the plastic part Δεp/2–2Nfcurve are also given in this figure.Definitely,the relationship between Δε/2 and 2Nfcan be described by the Manson-Coffin model given in Eq.(4),and the parameters of this model are:=770.6 MPa,=0.0752,b=-0.123,c=-0.488.

Fig.11 Predictions of Pandey&Chand and Shi&Cai models with Newman’s U value for CIET specimens.
As reported in Ref.19,the experimental curves of the fatigue crack growth rates of CT and CIET specimens with different load ratios and thicknesses are shown in Fig.6.It can be seen that the fatigue crack growth curves of both types of specimens are strongly influenced by the load ratio.This alloy presents better resistance to fatigue crack growth when specimens are subjected to a cyclic load with a smaller load ratio,and vice versa.The thickness of specimens has little effect on the fatigue crack growth curves of CIET specimens,but it quite affects the fatigue crack growth curves of CT specimens.Bao et al.19successfully eliminated the effects of the load ratio and thickness on the fatigue crack growth curves of both types of specimens by introducing crack closure correction based on Newman’s effective stress ratioU,and it will not be repeated here.
4.2.Prediction of fatigue crack growth curves based on energy based predictive models
According to the two above-mentioned energy-based fatigue crack growth models,the Pandey&Chand model and the Shi&Cai model,Figs.7–10 give the prediction of fatigue crack growth curves of all the CIET and CT specimens in consideration of crack closure correction with the effective stress ratioUresulted from Newman’s and Codrington’s methods,and without crack closure correction,respectively.
As seen from Fig.7,the predicted results of the Pandey&Chand model without crack closure correction for CIET specimens with different load ratios are much closer to test data than the results predicted from this model with the other two means of crack closure correction.However,as seen in Fig.8,for CT specimens with different load ratios and specimen thicknesses,the predicted results of the Pandey&Chand model with and without crack closure correction are quite different from test data,except when the load ratio is 0.3 and the thickness is 5 mm,while the Pandey&Chand model without crack closure correction can match the lower rate part of the experimental da/dN–ΔKcurve.
In Fig.9,the Shi&Cai model without crack closure correction loses the capacity of predicting fatigue crack growth rates of CIET specimens with different load ratios and thicknesses.As shown in Figs.9(a)and(b),the Shi&Cai model with two different means of determination of the effective stress ratioUgets consistent results,which match well with test data.When the load ratio is 0.5,the predicted curve from the model with the effective stress ratio developed by Newman agrees well with test data,but the predicted curve from the model by means of Codrington’s effective stress ratio is quite different from test results.
As plotted in Fig.10,the Shi&Cai model with crack closure correction by means of Newman’s effective stress ratio shows more capable of predicting fatigue crack growths of CT specimens with different load ratios and thicknesses than the model with the other way of crack closure correction and without crack closure correction.

Fig.12 Predictions of Pandey&Chand and Shi&Cai models with Newman’s U value for CT specimens.
Figs.11 and 12 present a comparison between the da/dN–ΔKcurves predicted by the Pandey&Chand and Shi&Cai models by means of Newman’s crack closure correction for CIET and CT specimens,respectively.The results indicate that the predictions of the Shi&Cai model match well with test curves,but the predicted results of the Pandey&Chand model deviate from thetestdata.In comparison with thepredicted da/dN–ΔKcurves of CT specimens,the Shi&Cai model shows more accurate prediction of the curves of CIET specimens.
5.Conclusions
(1)Using the low cycle fatigue properties of 5083-H112 aluminum alloy,the Shi&Cai model with crack closure correction by means of Newman’s effective stress ratioUexhibits the best capacity of predicting the fatigue crack growth rates of CT and CIET specimens with different load ratios and specimen thicknesses,but the Pandey&Chand models with and without crack closure correction get unsatisfactory predicted results of da/dN–ΔKcurves.
(2)In terms of effective stress ratio used in crack closure
correction,Newman’s method considered the effects of the specimen configuration and load ratio on the crack closure issue,while Codrington provided an empirical expression of the effective stress ratio in which only the influence of the load ratio was under consideration.
Acknowledgements
This work was financially supported by the National Natural Science Foundation of China(Nos.11202174 and 11472228).
1.Duggan TV.A theory for fatigue crack propagation.Eng Fract Mech1977;9(3):735–47.
2.Glinka G,Robin C,Pluvinage G,Chehimi C.A cumulative model of fatigue crack growth and the crack closure effect.Int J Fatigue1984;6(1):37–47.
3.Wu SX,Mai YW,Cotterell B.A model of fatigue crack growth based on dugdale model and damage accumulation.Int J Fract1992;57(3):253–67.
4.Chen L,Cai LX,Yao D.A new method to predict fatigue crack growth rate of materials based on average cyclic plasticity strain damage accumulation.Chin J Aeronaut2013;26(1):130–5.
5.Shi KK,Cai LX,Chen L,Wu SX,Bao C.Prediction of fatigue crack growth based on low cycle fatigue properties.Int J Fatigue2014;61:220–5.
6.Shi KK,Cai LX,Bao C,Wu SX,Chen L.Structural fatigue crack growth on a representative volume element under cyclic strain behavior.Int J Fatigue2015;74:1–6.
7.Shi KK,Cai LX,Qi S,Bao C.A prediction model for fatigue crack growth using effective cyclic plastic zone and low cycle fatigue properties.Eng Fract Mech2016;158:209–19.
8.Ellyin F,Kujawski D.Plastic strain energy in fatigue failure.J Press Vess–T1984;106(4):342–7.
9.Ellyin F.Crack growth rate under cyclic loading and effect of different singularity fields.Eng Fract Mech1986;25(4):463–73.
10.Kujawski D,Ellyin F.A fatigue crack growth model with load ratio effects.Eng Fract Mech1987;28(4):367–78.
11.Li D,Nam W,Lee C.An improvement on prediction of fatigue crack growth from low cycle fatigue properties.Eng Fract Mech1998;60(4):397–406.
12.Pandey K,Chand S.An energy based fatigue crack growth model.Int J Fatigue2003;25(8):771–8.
13.Pandey K,Chand S.Fatigue crack growth model for constant amplitude loading.Fatigue Fract Eng M2004;27(6):459–72.
14.Newman JJ.A crack-closure model for predicting fatigue crack growth under aircraft spectrum loading.West Conshohocken:ASTM;1981.Report No.:ASTM STP748.
15.McClung R.Finite element analysis of specimen geometry effects on fatigue crack closure.Fatigue Fract Eng M1994;17(8):861–72.
16.Kim J,Lee S.Fatigue crack opening stress based on the strip-yield model.Theor Appl Fract Mech2000;34(1):73–84.
17.Toribio J,Kharin V.Role of plasticity-induced crack closure in fatigue crack growth.Fract Struct Integrity2013;7(25):130–7.
18.Hutar P,Seitl S,Knesl Z.quantification of the effect of specimen geometry on the fatigue crack growth response by two-parameter fracture mechanics.Mater Sci Eng A2004;387:491–4.
19.Bao C,Cai LX,Dan C.Estimation of fatigue crack growth behavior for small-sized C-shaped inside edge-notched tension(CIET)specimen using compliance technique.Int J Fatigue2015;81:202–12.
20.Hutchinson J.Singular behavior at the end of a tensile crack in a hardening material.J Mech Phys Solids1968;16(1):13–31.
21.Rice J,Rosengren G.Plane strain deformation near a crack tip in a power-law hardening material.J Mech Phys Solids1968;16(1):1–12.
22.Rice J.The mechanics of crack tip deformation and extension by fatigue.West Conshohocken:ASTM;1966.Report No.:ASTM STP415.
23.Glinka G.A cumulative model of fatigue crack growth.Int J Fatigue1982;4(2):59–67.
24.Ramberg W,Osgood WR.Description of stress-strain curves by three parameters.Tech Notes Nat Adv Comm Aeronaut1943;1943(902):1–13.
25.Shih CF.Tables of Hutchinson-Rice-Rosengren singular field quantities[dissertation].Providence:Division ofEngineering,Brown University;1983.p.1–61.
26.Antunes F,Chegini A,Branco R,Camas D.A numerical study of plasticity induced crack closure under plane strain conditions.Int J Fatigue2015;71:75–86.
27.Codrington J,Kotousov A.A crack closure model of fatigue crack growth in plates of finite thickness under small-scale yielding conditions.Mech Mater2009;41(2):165–73.
28.Newman JJ.A crack opening stress equation for fatigue crack growth.Int J Fract1984;24(4):R131–5.
29.Vormwald M.Effect of cyclic plastic strain on fatigue crack growth.Int J Fatigue2016;82:80–8.
杂志排行

CHINESE JOURNAL OF AERONAUTICS的其它文章
- Extension of analytical indicial aerodynamics to generic trapezoidal wings in subsonic flow
- Time-varying linear control for tiltrotor aircraft
- Global aerodynamic design optimization based on data dimensionality reduction
- Mesh deformation on 3D complex configurations using multistep radial basis functions interpolation
- Stagnation temperature effect on the conical shock with application for air
- Transient simulation of a differential piston warm gas self-pressurization system for liquid attitude and divert propulsion system