Transient simulation of a differential piston warm gas self-pressurization system for liquid attitude and divert propulsion system
2018-04-21ZhongjianFANGGuozhuLIANG
Zhongjian FANG,Guozhu LIANG
School of Astronautics,Beihang University,Beijing 100083,China
1.Introduction
The function of the Differential Piston Warm Gas Self-Pressurization System(DPWGSPS)is to generate warm gas for tank pressurization via catalytic chemical reactions of the liquid monopropellant for the liquid attitude and divert propulsion system.In comparison to typical cold gas pressurization systems,the DPWGSPS can significantly reduce both the weight and volume,eliminate gas storage requirements,and enhance the safety and reliability.1The technology has attracted attention in recent years as a candidate for a number of applications including rockets,spacecraft,and missiles.
A monopropellant DPWGSPS applying M-75(hydrazine/MMH blend)was developed and tested in 1998 by the Primex Aerospace Company,which was designed to pressurize propellant tanks and provide a regulation band of 5.8 MPa+5%/-7%.1Around the same time,a conceptual study of the DPWGSPS utilizing high-test peroxide as the monopropellant medium was carried out by the Lawrence Livermore Nation Laboratory.2–4Further to this,a parameter design method on the DPWGSPS was developed by the authors.5The DPWGSPS has several advantages over typical propulsion systems such as improved pressurization efficiency,low system mass,and small envelope size.6
Numerous studies on the dynamic models and simulation methods of Liquid Propellant Engine(LPE)have been carried out.Ruth et al.7introduced a liquid rocket transient code,which modeled the engine as a modular scheme and used the method to characterize the flow through line segments connected by nodes.Binder8developed steady-state and transient computer models of the RL10A-3-3A rocket engine using a transient simulation code.Liu and Zhang9developed a pipevolume disassembly method for fluid line systems.In their method,fluid line systems were disassembled into pipe-type modules and volume-type modules.The finite-element statevariable model was applied to the former,and the lumped parameter method was applied to the latter.Karimi et al.10proposed a dynamic and nonlinear simulation method for LPEs,which composed the dynamic equations to the implicit nonlinear algebraic equations,nonlinear and time-varying differential equations.Yamanishi et al.11used a rocket engine dynamic simulator,based on the volume-junction method for the transient analyses of the LE-7A engine.A simulation algorithm adapted from the Newton–Raphson method was reported by Karimi and Nassirharand12and used for the dynamic and nonlinear analysis of a LPE.Moreover,a VINCI engine transient model was introduced by Durteste13and used to predict the global behavior of an engine.Zanj et al.14developed a nonlinear modeling and dynamic simulation of a hot pressurization system to estimate the pressure,temperature,and mass flow rates of pressurant and propellant during the expulsion from a tank.Three semi-empirical models were introduced by Di Matteo et al.15,16to improve the European Space Propulsion System Simulation(ESPSS)library as a system modeling tool for transient analysis,and an LPE transient model was developed to simulate the startup transient and the model was then validated using the RL-10.Tabrizi et al.17modeled major elements and developed a general simulator for an open cycle LPE.Liu et al.18investigated an LPE model library in the Model ica language containing component models.Lin and Baker19employed a characterization method to model one-dimensional liquid transients in liquid-full segments and the lumped-inertia technique to model the dynamics of partially filled segments in order to analyze the priming of a propellant feed system.Holt et al.20developed a transient model of a propulsion test article helium pressurization system using a generalized fluid system simulation program.
While numerous advances have been made in modeling typical propulsion systems,to the authors’knowledge there has been little research on the transient simulation of DPWGSPSs.In order to guide further system design and testing,it is necessary to conduct the system transient simulation.The methods in aforementioned references,such as the system’s modularization modeling method,the pipe-volume disassembly method,the finite-element state-variable method,and the lumped parameter method,are useful for current research.
The objective of this work is to develop an integrated mathematical model for the DPWGSPS to predict the variation in pressure and pressurization flow rate over time during the system startup,steady-state,and pulsing operations,and to further analyze the characteristics of starting time changing with different system parameters.
2.Physical model
A schematic of the DPWGSPS is presented in Fig.1.It consists of a Start Cartridge(SC),a Pressure amplified Tank(PAT),a Liquid Regulator(LR),a Gas Generator(GG),a Check Valve(CV),Burst Disks(BD),Gas Joint(GJ),Gas Pipes(GP)and Liquid Pipes(LP).In particular,when the liquid is filling the pipe during the system startup,this pipe is also defined as a Filling Pipe(FP).
The DPW GSPS is initiated by an electrical signal provided to the initiator of the SC,which ignites the solid propellant and produces warm gas.A hermetic seal is ruptured allowing warm gas from the SC to pressurize within the gas cavity of the PAT and the differential piston within the PAT pressurizes the monopropellant(hydrazine-70).Then,aburst disk at the PAT out let ruptures and the monopropellant is sent through the pipe and LR into the GG which decomposes the monopropellant into warm gas,thereby pressurizing the gas manifold and propellant tanks.The SC continues to provide warm gas to the gas cavity of the PAT until the solid propellant charge is burnt out.
During the process,the CV near the inlet of the PAT prevents the SC gases from entering the gas manifold,GG,and propellant tanks.The regulator will close at its locking pressure at the end of startup and the propellant tanks will lock up near this pressure.The system enters the self-locking state and the startup is completed.
Once the downstream rocket engines are ignited,the propellant tank pressure falls and the outlet pressure of the LR is reduced to below the nominal set point.This causes the LR open allowing monopropellant to enter the GG,which again decomposes the monopropellant to warm gas for pressurizing the propellant tanks.Simultaneously,as the gas cavity pressure of the PAT reduces,the CV will open,when the pressure is lower than the pressure of CV inlet(gas manifold),and the gas produced by the GG through the CV pressurizes the gas cavity of the PAT.The amplification ratio of the PAT provides the positive feedback needed for continuous system operation,and the LR regulates the pressure at its outlet to provide the overall pressure reference.When there is no further demand,the regulator closes and the system is returned to the lockup condition.

Fig.1 Schematic diagram of DPWGSPS.
The LR and CV maintain stability of the pressure within the system.The LR is a self-maintaining component,which uses springs to provide the set point control balanced against the pressure of the LR outlet cavity.In addition,to prevent the SC gases entering the gas manifold during startup,the CV ensures the gases in the manifold allowed to pressurize the gas cavity of the PAT only whilst its pressure is lower than the pressure of the gas manifold.
3.Mathematical model
Based on independent physical functions,the mathematical model,and uniform parameter exchange interfaces,the DPWGSPS can be disassembled into f i ve types of module based on practical physical units or components as shown in Table 1.The interfaces between the units are therefore the interfaces between the modules.
In this section,a mathematical model of each module of the system is presented.The compressibility of the liquid in the system is considered,and the acoustic velocity of the liquid is related to the liquid compressibility in the mathematical model of each liquid-related module.The value of the liquid density changes very little in the current problem,and it can be taken as constant approximately in the simulation.The one-dimensional finite-element state-variable model can be applied to the pipes,while the lumped parameter method is adopted for other modules.
3.1.Vessels
For the unitary medium single-volume vessels with several entries and exits,the dynamic equations can be given as follows:
Perfect gas vessel:
Table 1 Modules of DPWGSPS.

For the filling vessels,the state-variables equations are as follows:

where ρ,panduare the density,pressure and velocity,respectively,kis the specific heat ratio,Vis the volume of vessel,qm,inandqm,outare the mass flow rate of inlet and outlet,respectively,Ais the cross-sectional area,tis the time,subscripts‘in” and ‘out”represent the inlet and outlet,respectively,ρlandalare the density and acoustic velocity of the liquid,respectively,QinandQoutare inlet and outlet volume flow rate,respectively,Ml,fv,qm,l,fvandVl,fvare the mass,mass flow rate and volume of liquid in the filling vessel,respectively,and ρg,fv,Mg,fv,qm,g,fvandVg,fvare the density,mass,mass flow rate and volume of gas in the filling vessel,respectively.
For the CV,it is assumed that the valve port is directly attached to the PAT gas cavity so that it consists of a single gas vessel and single valve port.The gas vessel equations can be expressed as the gas vessel equations of a perfect gas,and the mass flux equation of the valve port is given by
The CV opening condition is

whereqm,cv,Acv,pcvandTcvare the mass flow rate,flow area,pressure,and temperature of the CV,respectively,Ris the gas constant,Γnis specific heat ratio function,Δpcvis the pressure drop of the CV,andpgis the pressure of the PAT gas cavity.
3.2.Start cartridge
The solid propellant charge of the SC,as shown in Fig.2,is composed of the end-burning grain and internal-burning tubular grain.This design can realize a fast response,lower pressure peak,and sustainable pressure.
For the SC,heat transfer to the wall is neglected and the zero dimensional equations can be obtained as follows:
Mass conservation equation:

In Eqs.(9)-(15),psc,Tsc,ρsc,Rsc,Vscandqm,scare the pressure,temperature,gas density,gas constant,free volume and outlet mass flow rate of the start cartridge,respectively,mpand ρpare the solid propellant mass and density,respectively,Abandrare the burning area and the burning rate,respectively,Tpis the burning temperature of the solid propellant,asis the burning rate coefficient,npis the pressure exponent.DscandLscare the external diameter and the length of the grain,respectively,ande1,e2andetare the thickness of the internal-burning tubular grain,the thickness of the end-burning grain and the burned thickness,respectively.
3.3.Pressure amplified tank
The PAT consists of a removable piston,variable volume gas vessel and liquid vessel,as shown in Fig.3.The heat transfer from the pressurization gas to the monopropellant can be neglected.
Fig.2 Schematic diagram of SC.
Fig.3 Schematic diagram of PAT.
The pressure and density equations of the gas cavity are given as follows:
In Eqs.(16)-(21),Vgand ρgare the volume and density of the PAT gas cavity,respectively,QTis the quantity of heat,hsis the convective heat transfer coefficient,Sis the convective area,andTwandTgare the wall temperature and gas temperature of the PAT gas cavity,respectively.plandVlare the pressure and volume of the PAT liquid cavity,respectively,mpst,upst,xpst,FpstandApstare the mass,velocity,displacement,friction and differential area of the piston,respectively,AgandAlare the gas cavity and liquid cavity cross-sectional areas of the PAT,respectively,andpais the ambient pressure.
Due to the piston moving,the volume in the gas and liquid cavities are continuously changing,and their equations can be expressed as follows:

3.4.Liquid regulator
Fig.4 Schematic diagram of LR.
As shown in Fig.4,the LR can be simplified as a diaphragm with a spring,inlet cavity,and outlet cavity.To simplify the mode,the changes in the outlet cavity volume caused by the deformation of the diaphragm are considered negligible.In the filling process,the inlet(or outlet)cavity equations are the same as the filling vessel equations,and the equation of a normal liquid flow process is represented by Eq.(3).
According to the force balance,the valve core displacement equation can be expressed as

wheremspis the mass of valve core,δ and δ0are the opening and initial opening of the LR,respectively,Cis the damping coefficient,Kis the spring stiffness,piandpoare inlet cavity pressure and outlet cavity pressure,respectively,Aiis the stressed area of the valve core in the inlet cavity,Aois the stressed area of the valve core in the outlet cavity,andAais the cross-sectional area of the outlet cavity.
The mass flow of the regulator valve port can be given by

whereqm,regis the mass flow rate of the regulator valve port,Cd,regis the flow coefficient,andcregis the circumference of the valve port.
3.5.Gas generator
The GG is composed of a catalyst bed and an injector with capillaries,as shown in Fig.5.Due to the small injector volume,the time taken to fill the injectors with monopropellant is negligible.Letting the length of the liquid path in the catalyst bed be short,the time required for the liquid to change into the gas in the catalyst bed is assumed to be in the range of 0.01–0.03 s.There is a pre-heating of the catalyst bed to achieve a warm start and to prevent catalyst damage during cold start.Heat losses to the walls of the catalyst bed is neglected in order to simplify the calculation model.
Considering the GG as a lumped parameter model,the mass conservation equation and energy conservation equation for the combustor of the GG are as follows:
Fig.5 Schematic diagram of GG.
wherepGG,ρGGandVGGare the pressure,gas density,and free volume of the GG catalyst bed,respectively,qm,in,GGandqm,out,GGare the inlet and outlet mass flow rate of the GG catalyst bed,respectively,andhin,GGandhout,GGare the inlet and outlet specific enthalpy,respectively.
For the GG catalyst bed,in order to get the specific heat ratio and the outlet specific enthalpy,the thermodynamic calculation needs to be carried out.According to the pressure of the catalyst bed and the dissociation degree of ammonia(0.55 for current study),the temperature,the gas constant,the specific heat ratio,and others of the decomposed gases in the catalyst bed can be obtained from the calculation.Under the nominal conditions,the temperature is 721 K,the specific heat ratio is 1.31,the gas constant is 573.42 J/(kg·K),and the gas density is 16.93 kg/m3.
The catalyst bed and capillary flow resistances are classified as local losses.The capillary flow resistance21can be given by
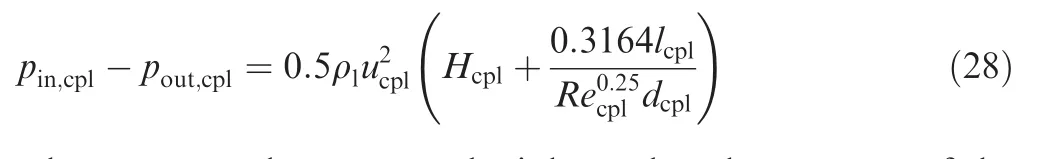
wherepin,cplandpout,cplare the inlet and outlet pressure of the capillary,respectively,ucplandRecplare the fluid flow rate and Reynolds number in the capillary,respectively,andlcplanddcplare the length and diameter of the capillary,respectively.Hcplis the flow resistance coefficient and is equal to 1.5.
The catalyst bed flow resistance22is expressed as follows:
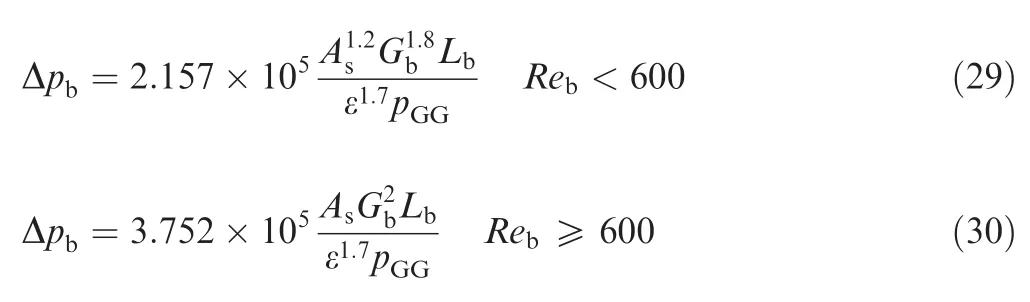
where Δpb=pout,cpl-pGG;Reb=Gb/(μAs)is the Reynolds number in the catalyst bed,and μ =3.13 × 10⁻⁵N ·s/m2is the average viscosity of the decomposition products;As,ε andLbare the specific surface area,porosity and length of the catalyst bed,respectively,andGbis the bed flux.
3.6.Pipes
The finite-element state-space model is employed to describe the transients of one-dimensional fluid flow in pipes.The pipe is divided into finite elements and two types of cross finite control volume elements are adopted:the state element and velocity element.By applying the mass and energy conservation equations to the state elements,and the momentum conservation equation to the velocity elements,the finite-element statevariable equations for one-dimensional fluid flow are developed,as shown in Fig.6.There are three types of pipes in current study,such as LPs,GPs and FPs.The friction is considered for all pipes.For the liquid pipes,neglect the temperature changes and the heat transfer,and the energy equation of the liquid is not considered;for the gas pipes,all of these are wrapped with adiabatic materials when it is assumed that the performance of the heat insulating measures is good enough.Therefore,only the heat transfer from the gas to the wall is considered and the heat dissipation from the wall to the environment can be neglected.The finite-element statespace governing equations for the liquid and gas pipes are described in detail in Ref.9,and these equations are adopted in this study.

Fig.6 Two types of finite control volume elements of one-dimensional flow in a FP.
For the filling pipe,the liquid elements are treated in the same way as liquid pipes,and the gas elements are the same as gas pipes.As shown in Fig.6,the filling element is thejth element,the heat transfer is neglected and its equations can be given as follows:
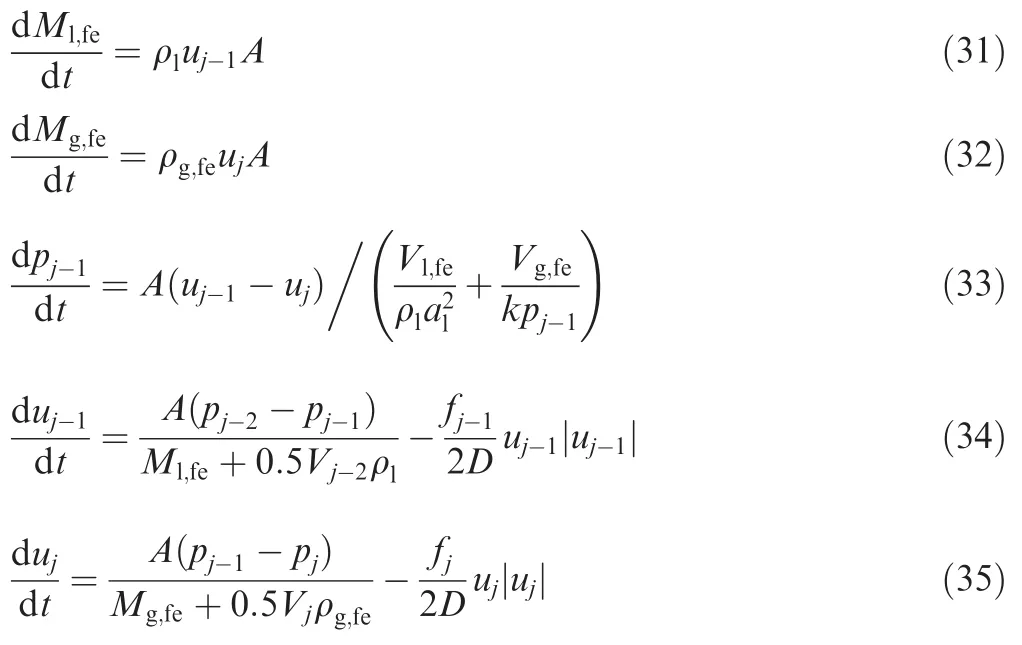
whereMl,fe,Mg,fe,Vl,fe,Vg,feand ρg,feare the liquid mass,gas mass,liquid volume,gas volume and gas density of the filling element,respectively;pj,ρjandVjare the pressure,density,and volume of thejth state element,respectively(j=0,1,...,n-1);ujis the flow velocity of thejth velocity element;Dis hydraulic diameter;fjis the friction coefficient of the fluid(j=0,1,...,n)and it can be calculated as follows:23
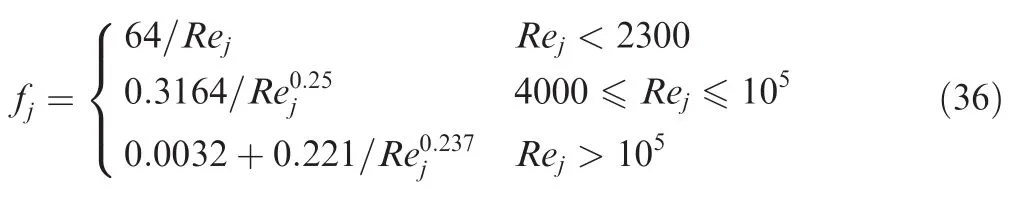
whereRej= ρjujD/μjis the Reynolds number in the element,μjis the viscosity of thejth velocity element.
In the DPWGSPS,under the nominal conditions,the liquid velocity in the liquid pipe is 2.37 m/s,the gas velocity in the gas pipe(III)is 62.67 m/s which is much larger than the liquid velocity,and the Reynolds number in the liquid pipe and gas pipe(III)are about 9466.9 and 3.5×10⁵,respectively.
4.Simulation method

Fig.7 Forms of simulation module connections.
The DPWGSPS transient process model can be established by connecting the modules based on the physical model.The relationship between the connections of the simulation modules based on the DPWGSPS is shown in Fig.7.In Fig.7,‘Y” represents the completion of the element filling,and ‘N” represents the opposite;the simulation modules in the virtual box are the links that exist during the system startup.The boundary conditions of each module are determined by its adjacent module calculation parameters and environmental boundary conditions,and the rise in the exit pressure of an element being filled with liquid is neglected until that element is completely filled.
A flowchart of the transient simulation of the system is shown in Fig.8.The simulator can successfully calculate the system startup process,steady-state process,and pulsing operation process.The system structural data,catalyst parameters,parameters of the solid propellant(ammonium nitratepolyester propellant)and liquid monopropellant(hydrazine 70),and the initial values of all variables(including state variables and boundary parameters)are given in Table 2.5After simulating the system startup process,the simulation of the steady state process or the pulsing operation process can be selected as the subsequent step.The simulations of the three processes,which are the main computational processes,share the same modules,as shown by the dashed box in Fig.8.Thermodynamic calculations in the GG and gas pipes are required for each step.The order of calculation for each module is shown in Fig.7 and the equations are solved by the Runge–Kutta method.The module variables,including pressure,density,temperature,flow rate,and flow velocity,are recorded and output at each step.
5.Results and discussion
5.1.Start transient phase
Prediction of the PAT gas cavity pressure,capillary inlet pressure,GG chamber pressure,PT pressure,and pressurization mass flow rate during the system startup process are presented in Fig.9.
Fig.8 Flowchart of transient simulation of DPWGSPS.
The system startup can be divided into two stages(Fig.9(a)):the filling and initial pressure build-up stage,and the pressure build-up and reaching self-locking stage.In the first stage,the SC ignition,system filling,and system initial pressure buildup occur sequentially and the end of the stage is the burning-off of the solid propellant in the SC(att=0.226 s).Each curve has a relatively f l at portion(with the exception of the PT pressure curve)and this sub-stage is the system’s initial pressure building stage.The capillary inlet pressure oscillates due to the movement of the LR valve core.In the second stage,the system pressure continues to build until the self-locking state is reached att=0.688 s,which can be considered as the system starting time.The self-locking pressure is 7.58 MPa,slightly higher than the design value,and is the maximum pressure during the operation of the PT.The deviation between this pressure and the rated design working pressure is 9.86%thus meeting the positive deviation requirement of+10%.The pressures shown in Fig.9(a)are equal and also reach the self-locking pressure att=0.688 s during the startup process,therefore representing a typical starting process for the DPWGSPS.
In some cases,such as mismatched masses of the solid propellant charge,initial volume of the PAT gas cavity and initial volume of the PT gas cushion,the PAT gas cavity pressure,capillary inlet pressure,GG chamber pressure and PT pressure do not tend to reach the self-locking pressure at the same time.In this case,the startup process can be divided into two types:under-started and over-started,as shown in Fig.9(b)and(c),where the mass of the solid propellant charge in the SC has changed.

Table 2 Given designed data of DPWGSPS.
In the under-started process,the PAT gas cavity pressure drops to below the PT pressure,the CV opens and the system enters the self-pressurized process.As the self-pressurization process continues,the PAT gas cavity pressure gradually increases until it reaches the self-locking pressure.However,in the over-started process,due to excessive solid propellant or other reasons,the capillary inlet pressure,GG chamber pressure,and PT pressure reach the self-locking pressure first,and at this point,the PAT gas cavity pressure is higher than the self-locking pressure.In both processes,the capillary inlet pressure,GG chamber pressure and PT pressure are equal to each other attst1,and all pressures reach the self-locking pressure attst2.It should be noted that attst2,the system is not in the theoretically complete self-locking state.The pressure is slightly less than the complete self-locking pressure and the system has a small flow rate.After this moment,the LR frequently closes and opens,and there is a relatively long working process before the complete self-locking state is reached.The deviation between the pressure attst2and the complete self locking pressure is very small and in order to facilitate system analysis and parameter design,it is assumed that the current state is the actual self-locking state and the pressure is the actual self-locking pressure attst2,defined as the system starting time.

Fig.9 Startup process.
The system starting time of the three different states at each respective solid propellant mass is listed in Table 3.When the solid propellant mass is 2.64 g,the system startup process is considered as the typical startup process and the starting timetst2=tst1=0.688 s.When the solid propellant mass is 2.05 g or 2.83 g,the corresponding startup process is under-started or over-started,and the starting timetst2is greater thantst1and higher than 0.688 s.The typical startup process is optimal.
The test results of the start response are shown in Fig.10.1The trends of the pressure curves are similar to Fig.9(c);however,the values differ due to the different system parameters.From Fig.10,it can be seen that the GG feed pressure,gas manifold pressure and propellant pressure reach the selflocking pressure first.Untiltst2,the PAT gas side pressure is reduced to the self-locking pressure and the starting time is 0.85 s.Based on the above analysis,the system can be said to have an over-started process.
5.2.Steady state process
The steady state results obtained from the simulation are compared to the nominal design values.The relative deviations in steady state values are given in Table 4,with a maximum deviation of-4.53%(pressurization gas mass flow rate of PT)and all others less than 3%.Deviations are caused by two main factors:simplification of the system design process which resulted in some deviations from the system’s actual working state compared to its designed state;the dynamic calculations which caused deviations between simulation results and design values.Despite this,the deviations are all lower than 5%and acceptable for the initial design.TheQPTis the PT volume flow rates,which represents the volume flow rate for the downstream thrusters during the operation of the propulsion system.
The influences of different PT volume flow rates on three steady-state operations is shown in Fig.11.The rated PTvolume flow rate and its variation of±50%are presented.At the rated PT volume flow rate(1.5 L/s),the PT pressure is 6.93 MPa and the pressurization mass flow rate is 28.2 g/s.For the smaller PT volume flow rate of 0.75 L/s,the pressurization gas mass flow rate is 16 g/s,and the PT pressure is 7.28 MPa,deviating from the design value by 5.51%.At the greatest PT volume flow rate of 2.25 L/s,the pressurization gas mass flow rate is 38.3 g/s and the PT pressure is 6.36 MPa,deviating from the design value by-7.83%.

Table 3 System starting time.

Fig.10 Test results of start response from Ref.1.
The trends of the typical steady-state operation parameters versus PT volume flow rate are shown in Fig.12.When the PTvolume flow rate increases from 0.25 L/s to 2.74 L/s,the steady-state pressurization mass flow rate varies from 5.7 g/s to 42.6 g/s,and the steady-state PT pressure ranges from 7.41 MPa to 5.90 MPa.Compared to the design value,the deviation of the PT pressure falls within the range[-14.49%,7.39%].To meet the negative pressure deviation requirement of-10%(according to Section 5.1,the positive deviation is satisfied by the design self-locking pressure),the PT volume flow rate should be lower than 2.41 L/s(1.6 times its design value).Therefore,as a consequence of the mismatch between pressure requirement and actual PT pressure,the operational range of the thruster will be constrained.
Table 4 Comparison of simulation versus design values under nominal conditions.
Fig.11 Steady-state operation processes at different PT volume flow rates.

Fig.12 Typical steady-state operation parameters versus PT volume flow rate.
5.3.Pulsing operation
Fig.13 displays the typical transient system parameters’variation over time for three pulse operation modes,(20 ms/20 ms)×50 times(Case 1),(50 ms/50 ms)×20 times(Case 2)and(100 ms/100 ms)×10 times(Case 3),at the PT volume flow rate of 1.5 L/s.
The DPWGSPS provides a PT pressure band of 7.28 MPa±0.38%(Case 1),7.28 MPa±0.89%(Case 2)and 7.25 MPa±2.3%(Case 3),and a pressurization mass flow rate band of 15.20 g/s±5.90%,15.25 g/s±20.0%and 15.35 g/s±47.9%.It can be seen that the average PT pressure during the pulsing process is equal to the average of the PT rated pressure(6.90 MPa)and the PT self-locking pressure(7.58 MPa),and the pressurization mass flow rate is approximately half its rated value when the opening time is equal to the closing time in a single pulse.When the opening time is longer in each pulse,the fluctuations of PT pressure and pressurization mass flow rate are greater.

Fig.13 Pulsing operation at rated PT volume flow rate(QPT=1.5 L/s).
5.4.Starting time analysis
The curves of the starting time versus a number of important factors are obtained,and are shown in Fig.14.The major system parameters for each case are shown in Table 2.

Fig.14 Several important parameter variations influencing starting time around their design points respectively.
From Fig.14(a)–(c),it can be seen thattst1andtst2increase with the increase of the stressed areaAiof the valve core in the LR inlet cavity,and decrease with the increase of the stressed areasAoof the valve core in the LR outlet cavity.The effect of the spring stiffnessKontst1is relatively small;however whenKincreases,tst2increases.In combination with Fig.9,it can be concluded that the startup processes of the system for the parameter variation shown in Fig.14(a)–(c)are all of the overall over-started type,and the pressure of the PAT gas cavity is higher than the PT pressure attst1,which provides an operational pressure margin.
As shown in Fig.14(d),tst1decreases whiletst2first decreases and then increases corresponding to the increase of the massmpof the SC solid propellant charge.When the mass of the SC solid propellant charge is less than 2.64 g,the system startup process is under-started;otherwise,the system startup process is over-started.When the mass of the SC solid propellant charge is 2.64 g,tst2reaches the minimum value(0.688 s).
According to Fig.14(e),tst1is less affected by the variation of the initial volumeVg0of the PAT gas cavity.tst2decreases first and then increases as the initial volume of the PAT gas cavity increases,and reaches the minimum value of 0.694 s when the initial volume of PAT gas cavity is 41.37 mL.When the initial volume of the PAT gas cavity is less than 41.37 mL,the system startup process is over-started.Otherwise,when the initial volume of the PAT gas cavity is higher than 41.37 mL,the system startup process is under-started.
With the increase of the initial volumeVPTof the PT gas cushion,tst1increases whiletst2first decreases and then increases,andtst2reaches the minimum value of 0.716 s at 1.56 L.When the initial volume of the PT gas cushion is lower than 1.56 L,the system startup process is over-started.Otherwise,the system startup process is under-started,as shown in Fig.14(f).
From Fig.14(d)–(f),thetst2curves have a significant transition from the under-started process to the typical normal startup process due to the CV opening pressure drop and selfpressurization filling process for the PAT during the understarted process as a result of low pressure.This leads to additional time in the under-started process required to complete starting process,so thetst2curves have a turning mutation.All thetst2curves are relatively f l at on the side of the understarted process,since when the CV opens,the PAT gas cavity pressure is rapidly pressurized to the self-locking pressure,resulting in the starting timetst2approachingtst1,so that this part of thetst2curve changes gently,similar for thetst1curve.
The results shown in Fig.14 can be used for a system design which avoids both under-and over-started startup process.
6.Conclusions
(1)A transient model of the differential piston warm gas self-pressurization system is developed based on the modular modeling method.Variation of the system’s operation parameters with time during the startup,steady-state and pulsing operation process is observed by transient simulation.
(2)The simulation results are in good agreement with the design values.The system startup transient phase can be divided into typical startup process,under-started process and over-started process.The typical startup process is the optimal starting state.
(3)The starting time monotonically changes with the flow
regulator parameters,first decreasing and then increasing with the variation of the solid propellant charge mass of the start cartridge,initial gas cavity volume of the pressure amplified tank,and initial gas cushion of the propellant tank;it can be reduced to less than 1.0 s(0.68–0.75 s for the current system).
(4)To meet the deviation requirements of±10%of the steady-state propellant tank pressure,the positive deviation is assured by the self-locking pressure,and the negative deviation is assured by an allowable maximum propellant tank volume flow rate(1.6 times the design value for the proposed system)for downstream thrusters.
1.Maybee JC,Krismer DJ.A novel design warm gas pressurization system.Reston:AIAA;1998.Report No.:AIAA-1998-4010.
2.Whitehead JC.Hydrogen peroxide propulsion for smaller satellites.Reston:AIAA;1998.Report No.:AIAA-SSC98-VIII-1.
3.Whitehead JC,Dittman MD,Ledebuhr AG.Progress toward hydrogen peroxide micropropulsion.Reston:AIAA;1999.Report No.:AIAA-SSC99-XII-5.
4.Whitehead JC.Self pressurizing HTP feed systems.2th international hydrogen peroxide propulsion conference;1999 Nov 7–10;West Lafayette,US.Washington,DC.:US Department of Energy;1999.p.237–52.
5.Fang ZJ,Liu L,Liang GZ.Parameter design method on a differential piston warm gas self-pressurization system.J Beijing Univ Aeronaut Astronaut2017;43(1):61–70[Chinese].
6.Liu L,Liang GZ.Optimization selection of regulated pressurization system schemes for liquid attitude and divert propulsion systems.Procedia Eng2015;99:1247–51.
7.Ruth EK,Ahn H,Baker RL,Brosmer MA.Advanced liquid rocket engine transient model.Reston:AIAA;1990.Report No.:AIAA-1990-2299.
8.Binder B.An RL10A-3-3A rocket engine model using the rocket engine transient simulator(ROCETS)software.Reston:AIAA;1993.Report No.:AIAA-1993-2357.
9.Liu K,Zhang YL.A study on versatile simulation of liquid propellant rocket engine systems transients.Reston:AIAA;2000.Report No.:AIAA-2000-3771.
10.Karimi H,Nassirharand A,Beheshti M.Dynamic and nonlinear simulation of liquid-propellant engines.J Propuls Power2003;19(5):938–44.
11.Yamanishi N,Kimura T,Takahashi M,Okita K,Negishi H,Atsumi M.Transient analysis of the LE-7A rocket engine using the rocket engine dynamic simulator(REDS).Reston:AIAA;2004.Report No.:AIAA-2004-3850.
12.Karimi H,Nassirharand A.Application of a simulation algorithm for dynamic analysis of a liquid propellant engine.J Aerospace Sci Technol2006;3(1):23–30.
13.Durteste S.A transient model of the VINCI cryogenic upper stage rocket engine.Reston:AIAA;2007.Report No.:AIAA-2007-5531.
14.Zanj A,Kalabkhani A,Abdous MA,Karimi H.Modelling,simulation,and optimization of a hot pressurization system for a liquid propellant space engine and comparison with experimental results.Aerospace Eng2010;224(10):1141–50.
15.Di Matteo F,De Rosa M,Onofri M.Semi-empirical heat transfer correlations in combustion chambers for transient system modeling.Space propulsion conference 2010;2010 May;San Sebastian,Spain.2010.
16.Di Matteo F,De Rosa M,Onofri M.Start-up transient simulation of a liquid rocket engine.Reston:AIAA;2011.Report No.:AIAA-2011-6032.
17.Tabrizi MN,Chime SARJ,Karimi H.Modeling and simulation of open cycle liquid propellant engines.J Sci Eng2013;1(1):17–34.
18.Liu W,Chen LP,Xie G,Ding J,Zhang HM,Yang H.Modeling and simulation of liquid propellant rocket engine transient performance using modelica.Proceedings of the 11th international modelicaconference; 2015 Sep 21–23; Versailles, France.Linköping:Linköping University Electronic Press;2015.p.485–90.
19.Lin TY,Baker D.Analysis and testing of propellant feed system priming process.J Propuls Power1995;11(3):505–12.
20.Holt K,Majumdar A,Steadman T,Hedayat A.Numerical modeling and test data comparison of propulsion test article helium pressurization system.Reston:AIAA;2000.Report No.:AIAA-2000-3719.
21.Zhou HS.Experiment on capillary flow coefficient.J Propuls Technol1993;14(1):34–9[Chinese].
22.Zhu NC,Liu GQ.Design of liquid propellant rocket engine(part 2).Beijing:China Astronautic Publishing House;2005.p.405[Chinese].
23.Zhang GZ.Transient analysis of a divert thruster for micropropulsion systems.J Beijing Univ Aeronaut Astronaut1999;25(6):688–91[Chinese].
杂志排行

CHINESE JOURNAL OF AERONAUTICS的其它文章
- Extension of analytical indicial aerodynamics to generic trapezoidal wings in subsonic flow
- Time-varying linear control for tiltrotor aircraft
- Global aerodynamic design optimization based on data dimensionality reduction
- Mesh deformation on 3D complex configurations using multistep radial basis functions interpolation
- Stagnation temperature effect on the conical shock with application for air
- Effects of tube system and data correction for fluctuating pressure test in wind tunnel