Evaluation of Optical Localization in the Visible Bandfor Ultrasound Guidance in Radiotherapy Using A Robotic Arm
2017-11-17SaskiaCampsMatildeCostaEsterStevensPedroGomesSanches2GabrielPaivaFonsecaMurilloBellezzoFrankVerhaegenDavideFontanarosa
Saskia Camps, Matilde Costa, Ester Stevens, Pedro Gomes Sanches2,,Gabriel Paiva Fonseca, Murillo Bellezzo, Frank Verhaegen, Davide Fontanarosa,4
(1.Faculty of Electrical Engineering, University of Technology Eindhoven, Den Dolech 2, Eindhoven 5612 AZ, the Netherlands 2.Oncology Solutions Department, Philips Research, High Tech Campus 34, Eindhoven 5656 AE, the Netherlands 3.Department of Radiation Oncology (MAASTRO), GROW-School for Oncology and Developmental Biology, Maastricht University Medical Center, Maastricht 6201 BN, the Netherlands 4.School of Clinical Sciences, Queensland University of Technology, Gardens Point campus, 2 George St, Brisbane, QLD 4000, Australia)
•国际交流•
导读:
放射治疗的精度对于治疗结果至关重要,其中患者定位精度的提高是放射治疗得到精确实施的一个重要保障。放疗光学定位技术与其他临床定位技术相比,具有干扰少,设施安装灵活的优点。目前临床上已有不同种类的光学定位系统在使用,是一种新颖的、有前景的定位方式。
该研究自主研发了一套光学定位系统,通过光学探测头、光学标记物与超声探头的结合实现了运用患者的超声影像引导放疗定位的功能。文中具体探讨了光强度的选择,评估了超声图像的灵敏区域,对于引导系统所得出的摆位矫正结果的准确性及精度做出了分析,最后对于系统的延迟度也做了评估。
从本文最后的结果可以看出此套自主开发的摆位引导系统虽然在精度上需要进一步提升,但是初步达到了预想的结果,并且作者认为放疗光学定位系统在未来会有更加广泛的使用。
四川省肿瘤医院放疗中心
郎锦义
EvaluationofOpticalLocalizationintheVisibleBandforUltrasoundGuidanceinRadiotherapyUsingARoboticArm
Saskia Camps1,2, Matilde Costa3, Ester Stevens3, Pedro Gomes Sanches2,3,Gabriel Paiva Fonseca3, Murillo Bellezzo3, Frank Verhaegen3, Davide Fontanarosa3,4
(1.Faculty of Electrical Engineering, University of Technology Eindhoven, Den Dolech 2, Eindhoven 5612 AZ, the Netherlands2.Oncology Solutions Department, Philips Research, High Tech Campus 34, Eindhoven 5656 AE, the Netherlands3.Department of Radiation Oncology (MAASTRO), GROW-School for Oncology and Developmental Biology, Maastricht University Medical Center, Maastricht 6201 BN, the Netherlands4.School of Clinical Sciences, Queensland University of Technology, Gardens Point campus, 2 George St, Brisbane, QLD 4000, Australia)
In many medical fields, spatial localization of devices is of paramount importance to e.g. deliver treatments correctly or to perform accurate diagnostic evaluations. Among the different technologies available, optical localization in the visible band of the spectrum offers many advantages: minimum interference with other instruments, flexibility in position of the devices used and extra features such as patient/operator surface tracking or vital signs monitoring. Its application in the domain of radiotherapy is novel, and potentially very beneficial. In this work we introduced a workflow to test the reliability of one of these systems, developed in house, to localize an ultrasound transducer for ultrasound guided radiation therapy (USgRT). Accuracy, precision, latency, sensitive volume and sensitivity to light intensity were evaluated. The workflow we proposed allowed us to establish that, while all the clinically relevant parameters of the system are acceptable, accuracy in locating the transducer could be as poor as 7-8 mm, therefore not acceptable for the intended purpose of the system.
〗 Optical localization system; IGRT; US-CT co-registration; US transducer localization; Radiotherapy
I. INTRODUCTION
Radiotherapy (RT) is one of the possible treatment modalities for cancer. The goal of RT is to destroy tumor tissue, while at the same time sparing normal tissue as much as possible. Treatments are usually planned using a reference computed tomography (CT) image acquired prior to treatment commencement (simulation stage). The radiation dose is then typically delivered in multiple fractions. Patient setup prior to each fraction is a crucial aspect of the RT workflow: the position of the tumor, in fact, must correspond to the position at simulation as the treatment plan was prepared for this position. The accuracy required for this is about 1 millimeter. To achieve this, imaging the patient during the course of the RT treatment, usually referred to as image guided RT (IGRT), can help reduce possible geometrical errors significantly1.
Among IGRT techniques, ultrasound (US) based guidance (USgRT) is an option for hospitals which are interested in a robust and affordable inter-and intra-fraction treatment monitoring system2,3. US imaging is a relatively cheap and fast imaging technique that allows high contrast imaging of soft tissue. In addition, it is harmless for the patient and it is presently the only volumetric imaging technique clinically available that allows for real-time organ tracking. Moreover, this scanning technique has potential for important further developments and advanced applications are expected to become increasingly more available3, especially in the field of adaptive RT (ART4,5).
In the USgRT workflow, typically co-registered US and CT volumes are available as initial reference images (at the simulation stage). To provide a common reference frame to the two imaging modalities, a spatially calibrated localization technology must be used to track the US transducer position, and hence also the US scanned volume. In this way, it becomes possible to visualize the US and CT datasets in the same coordinate system. Several localization systems are available commercially, using different technologies, in different medical fields. The most common are: vision and image processing based techniques6, electromagnetic (EM) tracking (for example, Aurora, NDI, Waterloo, Ontario, Canada), mechanical localization using (robotic) arms7, infra-red (IR) cameras tracking (Polaris, NDI) and visual surface tracking (AlignRT, Vision RT Ltd., London, United Kingdom).
The EM tracking devices, have significant problems when ported into the RT domain. Accuracy in localization for these devices (based on static magnetic fields) is seriously hampered when metal parts are present as they produce magnetic field distortions.
In USgRT, the two main commercial products available clinically, the BATCAMTMsystem (Best NOMOS, Pittsburgh, PA, USA) and the Clarity®system (Elekta, Stockholm, Sweden) (with the real-time extension for prostate, Autoscan) both currently use IR stereo cameras from NDI (Polaris). These solutions suffer from blind angles due to line of sight requirements between the cameras and the markers, in particular for special applications as liver, and interference from heat sources in the room. Previous versions of the BATCAM system adopted a robotic arm as a localization device, but with this type of solutions high accuracy can only be achieved if very precise device manufacturing techniques and very rigid materials are used. The latter would make the cost of such a system prohibitive for most clinical applications. Moreover, a robotic arm would pose serious problems in intra-fraction applications, as it would, in many cases, interfere with the radiation beams.
A possible solution to these issues is the use of multiple cameras, instead of a single compact stereo system with limited field of view (as the NDI Polaris system). In particular, if imaging occurs in the visible part of the EM spectrum, a whole new variety of applications could be integrated, such as vital signs monitoring, surface tracking, breathing compensation etc. For example, Schweikard et al.8placed external markers on the skin of the patient and used an optical tracking system (OTS) to perform respiration tracking during radiosurgery. At this moment respiration tracking in RT can be done using the Real-time Position Management system of Varian Medical Systems (Palo Alto, CA, USA) which allows respiratory gating during the treatment.
Solutions are also commercially available in other fields, but those were never ported to RT. For example, the OptiTrack system (Corvallis, OR, USA, http://www.optitrack.com/) or the Vantage system (Vicon Motion Systems Ltd., Centennial, CO 80112, USA).
In this study, a prototype of an optical localization system (OLS) developed in house was used to determine the position and orientation of the US transducer during US volume acquisition in the simulation CT scanner room. Accuracy, precision, latency, dependence on light intensity and sensitive volume for the system were evaluated, with the aid of a robotic arm. The purpose of the work was to determine the specific issues that might affect optical localization systems in the visible band of the spectrum in a RT clinical environment and issue recommendations for their optimal use.
II. MATERIALS AND METHODS
In section II.A the setup of the OLS in the simulation CT room as well as the marker pattern used for localization are described. Then five different aspects which could affect the usability of the system for the specified purpose were evaluated: the influence of light intensity on marker pattern tracking (section II.B), the definition of the sensitive volume (section II.C), precision and accuracy (section II.D), and latency (section II.E).
A. OPTICAL LOCALIZATION SYSTEM
The OLS was used to obtain real-time coordinates of the US transducer position in the same fixed reference frame as the simulation CT scanner. The setup of the system is detailed in Fig.1. The red lines in Fig.1 indicate the room lasers present in the CT room. The crossing of these lasers (marked B in Fig.1) is used as reference position of the CT scanner for proper patient setup, 50 cm outside the bore in the positive X direction at the same Z value as the isocenter of the scanner. Three optical cameras (marked D in Fig.1) were mounted on the ceiling in a position enabling them to visualize the position of the patient both during the setup and during the scan. Each of the cameras was directed towards the bore of the CT scanner resulting in partially overlapping fields of view.
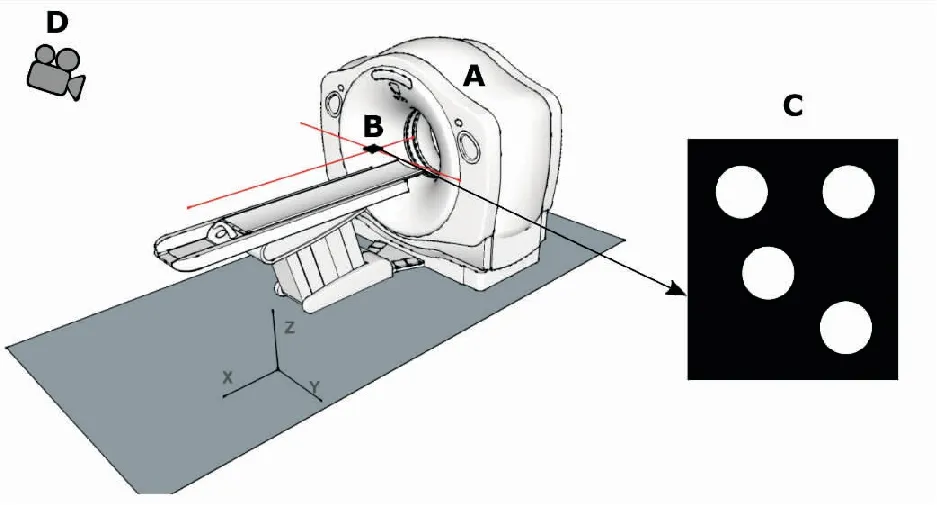
FigureS 1.SetupofOLSintheCTroom(A)CTscanner; (B)ThelaseroftheCTscannerwhichindicatesitreferenceposition; (C)Markerpatternpositionedinthelasercross.Thedistancesbetweenthefourdotsofthepatternareunique.Inaddition,thecenteroftheupperleftdotindicatesthereferencepointofthemarkerpattern; (D)ThethreeopticalcamerasusedinthelocalizationsystemweremountedtotheceilingapproximatelyatpositionD.Thecameraswerepositionedinsuchawaythatthefieldofviewspartiallyoverlappedandthemarkerpatterncouldbeviewedfromdifferentangles.
The OLS is able to recognize and localize a specific marker pattern that is rigidly attached to the US transducer. In this study, the pattern consisted of four white dots on a black background (Fig.1D). The center of the upper left dot was defined as the reference point. The distances between the centers of the dots are unique. Other dot patterns can also be used as long as the unique distance requirement is fulfilled, at least four nonaligned dots are present, and the system is aware of the exact configuration of the dots.
The OLS outputs a log file which consists of two components: translation and rotation coordinates. The translation coordinates capture the translation in mm in the X, Y and Z directions separately. The rotation coordinates capture the rotation angles around the same axes in radians. During the localization, the views of the three cameras are displayed in a user interface with the dots of the maker pattern superimposed on these views if they are detected.
B. LIGHT INTENSITY
The OLS identifies and localizes the marker based on the contrast between the pattern of the white dots and the black background. The light conditions in the room could potentially influence this contrast detection significantly. For this reason, it was important to determine the range of light intensities for which the contrast difference was sufficiently detectable and localization could be performed.
The cameras of the OLS were positioned in a CT room which has both controllable and uncontrollable light sources: the ceiling mounted lamps and the partially blinded windows to the exterior, respectively. To assess the influence of light intensity on marker pattern localization, the reference point in the pattern was aligned in the X and Y directions with the lasers cross point (marked B in Fig.1), which is the reference position of the CT scanner. In the Z direction, the marker was positioned about 3 cm above the lasers as this was deemed to be a realistic position for it during a patient scanning procedure.
Subsequently, the light conditions in the room were varied. For each light condition set, the light intensity was measured close to the marker using an illuminance meter (TL-1, Minolta, Tokyo, Japan). The weather conditions affected the light conditions inside the CT room, due to the windows to the exterior. So to assess a broad range of occurring light intensities the measurements were performed on multiple days with varying weather conditions. In total 88 different light intensities, ranging from 4 to 261 lux, were measured.
In addition, for each light condition the ability of the OLS to localize the marker pattern was assessed. These results were binary, so either the system was able to localize (1) or not able to localize (0) the pattern at a specific light intensity.
C. SENSITIVE VOLUME
The sensitive volume is defined as the set of the positions in the CT room where the OLS is able to localize the marker pattern. This ability to localize depends on, for example, the marker pattern being in the field of view of at least two cameras and its relative orientation.
The size and location of the sensitive volume were assessed using a robotic arm (R17 5-axis robot arm, ST robotics, Cambridge, United Kingdom). This arm has 5 axes and can reach up to 75 cm in any direction with a payload of 2 kg. It was mounted on a separate cart which was positioned next to the CT table (Fig.2).
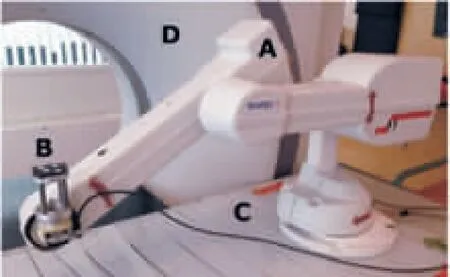
FigureS 2.RoboticarmsetupintheCTroomforsensitivevolumeandtranslationalprecisionandaccuracyevaluation. (A)Roboticarm; (B)Markerpatternmountedonthehandoftheroboticarm; (C)Cartonwhichtheroboticarmwaspositioned; (D)BoreoftheCTscanner.
The marker pattern was mounted on the hand of the robotic arm (marked B in Fig.2). Then the extension of the space in front of the CT bore where the marker pattern could potentially be during actual patient procedures was roughly and conservatively estimated. To sample this space in an approximately uniform way, a total of 825 positions were picked on five concentric cylindrical surfaces at varying radii from 0 mm to 200 mm (Fig.3).
The robot was programmed to bring the marker pattern to the first defined position, hold it there for three seconds and move on to the next point. For each position it was determined whether the OLS was able to localize (result=1), or not able to localize (result=0), the marker pattern.
D. PRECISION AND ACCURACY
The precision (in other words, the degree to which the repetition of measurements under equal conditions gives the same results) and accuracy (how close the detected coordinates are to the true value) of the system were also assessed using the previously described robotic arm, which has a nominal repeatability of 0.2 mm according to the manufacturer9. The accuracy of the arm in all directions was not reported, however the manufacturer claims that a droop up to 7 mm can occur. Translations along the three axes and rotation around the Y and Z axes were performed (see the first column of Table 1). Rotations around the X axis were not possible due to limitations of the robotic arm capabilities.
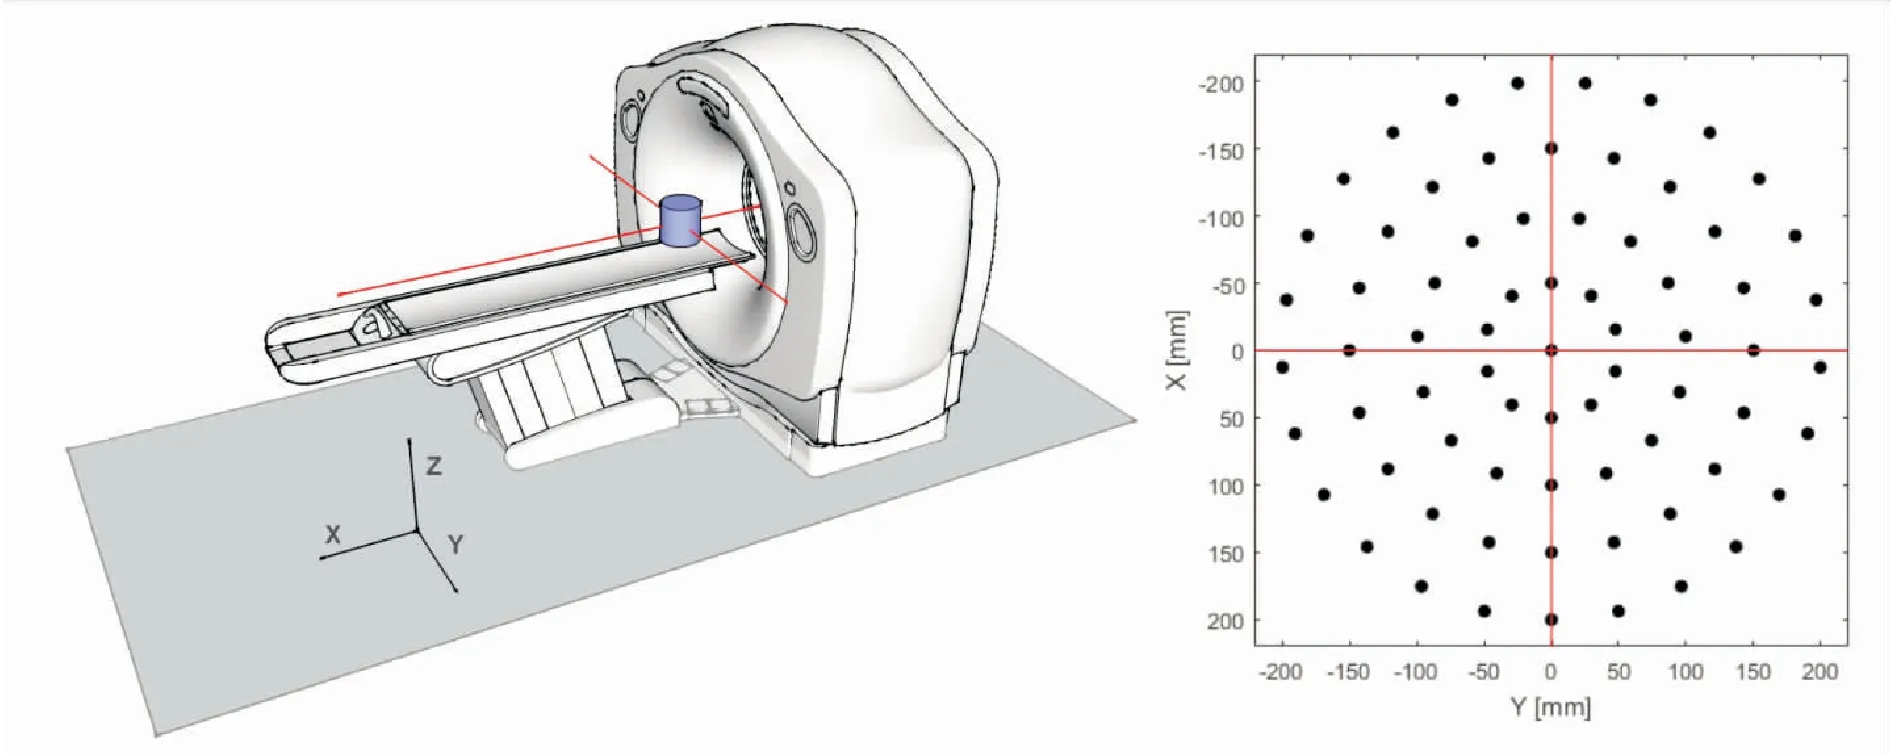
FigureS 3.Forthesensitivevolumeevaluationacylinder(inblue)wasdefinedinfrontofthebore,whichwassubsampledinanapproximatelyuniformway.TheplotshowsthesamplingofthelowestsliceintheZplaneofthiscylinder.TheredlinesindicatewherethelaserlinesoftheCTroomwerelocated.TheZspacewasdividedin11planes,eachbeing30mmapart.Foreachplanethesamesamplingpatternwasused.
For the translation in the X direction, the marker pattern was positioned at a starting position close to the reference point of the CT scanner (laser cross, Fig.1) using the robotic arm. Subsequently the pattern was moved 20 cm along the negative X axis. After holding the pattern in the shifted position for three seconds, it was moved back to the starting point and the procedure was repeated 25 times. The pattern was only moved in the negative X direction, as during the CT scan the table is also moved in this direction. The marker was not moved further than 20 cm because past this distance the CT bore would produce excessive shading on the pattern and proper localization would be difficult.
The translations in the Y and Z directions where performed in a similar way, using the settings as specified in Table 1. For the Z direction the pattern was only moved over a distance of 5 cm along the positive Z axis. This shorter distance was chosen because the available space between the CT table and the top of the CT bore in the Z direction is limited. In addition, moving the robotic arm in the Z direction increased the risk of blocking the field of view of the cameras with part of the robotic arm itself, making the marker pattern invisible.
For the rotational measurements, the marker pat-tern was again positioned in a starting position, then rotated 45 degrees clockwise around the Z axis, held there for three seconds, and moved back to the starting position. This rotation was also performed in the counterclockwise direction and both measurements were executed 25 times. The same procedure was performed for rotation around the Y axis, however only in the clockwise direction, as rotating the marker pattern 45 degrees counterclockwise would have made the pattern invisible for the cameras.
Table1.ForprecisionandaccuracyevaluationoftheOLS,severaloperations(detailedinthefirstcolumn)wereexecutedusingtheroboticarm.Thesecondcolumndisplaysthenumberofrepetitionsperoperation.Thethirdandfourthcolumnsshowthetraveleddistanceorangleandthedirectioninwhichthismovementoccurred,respectively.

OperationRepetitionsDistance/AngleDirectionTranslationX2520cmNegativeTranslationY25eachdirection10cmPositive/NegativeTranslationZ255cmPositiveRotationY2545degreesClockwiseRotationZ25eachdirection45degreesClockwise/Counterclockwise
After data acquisition, the measured translation and rotation coordinates were extracted from the log files provided by the OLS. In Fig.4A the Y component of the translation coordinate after translation in Y direction is displayed. As the OLS recorded these coordinates continuously, coordinates were saved also when the robotic arm was moving from one point to the next. These ‘traveling’ coordinates were removed from the coordinate file using a thresholding method (Fig.4B).
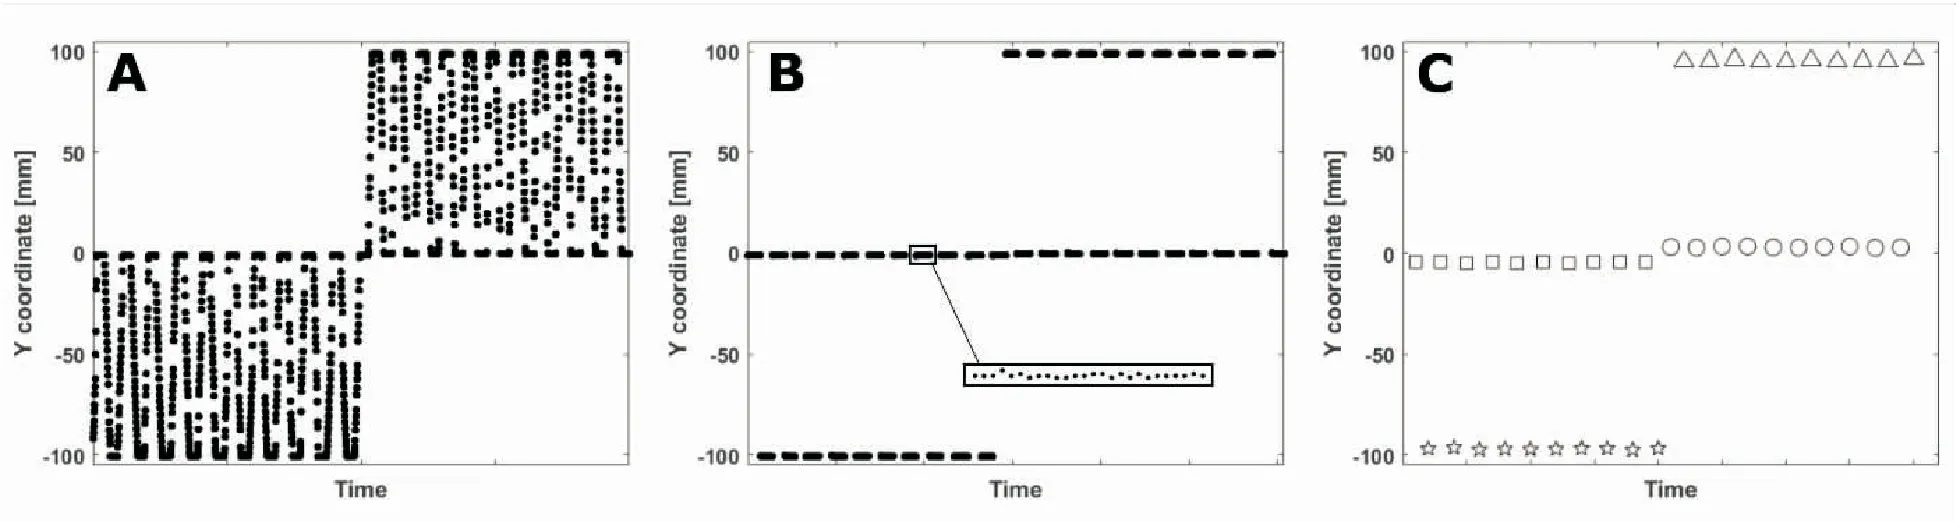
FigureS 4.Workflowfortheprocessingoftranslationandrotationcoordinates. (A)DataextractedfromtheOLSlogfiles; (B)Remainingdataafter‘traveling’coordinatesremoval; (C)Themeanofeachsmallpointcloudisdisplayedwithasymbol.ThesquarescorrespondtothestartingpointsofthemotioninnegativeYdirectionandthestarscorrespondtoendpoints.Thecirclesandtrianglesbelongtothestartingandendpointsinthepositivedirection,respectively.
Even if the marker position physically did not change, the translation and rotation coordinates showed a small variability, as shown in the inset in Fig.4B. The mean of each small point cloud, typically composed by 25 points, was used for further calculations. These mean values are displayed in Fig.4C with different symbols corresponding to starting points (square and circle) or end points (star and triangle). The standard deviation of each group of symbols per X, Y or Z component of the coordinates was used to calculate the precision of the OLS. The quadratic summation of these standard deviations resulted in a standard deviation per direction component.
To evaluate the accuracy of the system, the absolute distance between the starting points and their corresponding end points were calculated. After translation in the Y direction, this distance should be equal to 100 mm. The mean of the differences between the absolute distances measured with the OLS and 100 mm was used to assess the accuracy of the system. For rotations, the difference between the measured and the known rotation values were used. The described evaluation procedure was similarly used for all the other procedures described in Table 1.
E. LATENCY
The latency between the time an event occurs (new position of the marker pattern) and the effective time this event is detected by the OLS (and the marker pose updated) was measured. It is useful to estimate the reaction time of the OLS because the difference in time between the actual movement of the marker and the tracked movement may result in misinterpretation of the location of the transducer at the specific time of the US image recording. This delay is the combination of the time intervals required by the entire processing pipeline of the OLS to compute the marker pose. This pipeline includes the integration time of the cameras, the data transmission time via Ethernet connection from the cameras to the software, and the computation time of the marker pose (marker detection algorithm and triangulation).
To measure the latency the tracked model was positioned on the CT table at the center of the combined fields of view of the cameras. The table was then moved using the control panel on the CT scanner. The goal of this experiment was to measure the interval between the time when the motion of the table starts and the time when the OLS detects it.
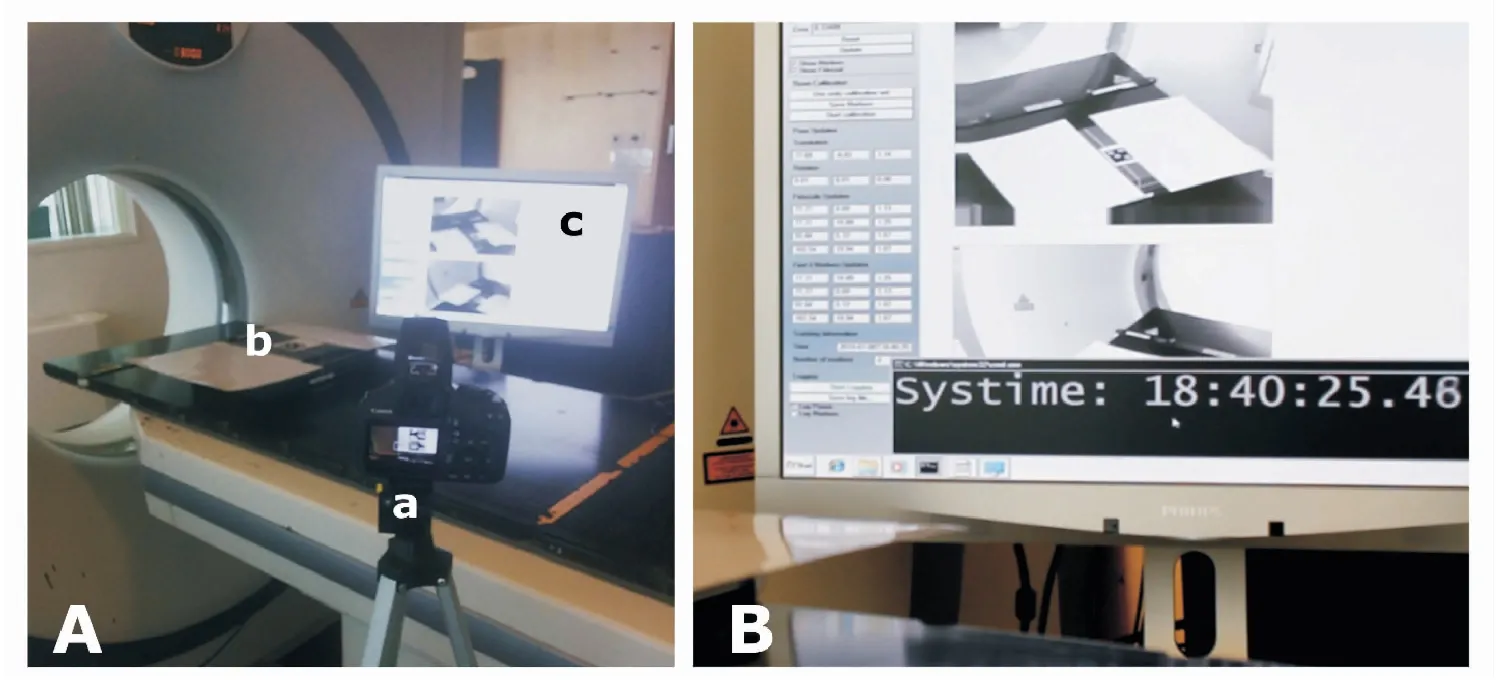
FigureS 5.Set-upofthelatencyexperiment. (A)Overviewofthesetupwith(a)CanonEOS1100Dcamera; (b)positionofthemarkerpatternand(c)themonitoroftheopticallocalizationPCwiththeOLSviewerinterface(B)Cameraviewrecordingofthemonitorwhichdisplaystheviewerinterfaceandreferenceclock.
In total, six displacements of the tracker were performed: for three times the CT table was moved 100 mm in the positive Y direction; and for three times 100 mm in the negative Y direction.
In this experiment three different latency values were evaluated: (1) pose update latency in the log file provided by the OLS; (2) pose update latency in the viewer, that measures how fast the marker pose is updated on the user interface; (3) video latency or delay of the live images on the viewer, that refers to the effective time the image corresponding to the marker motion is displayed on the viewer with the updated marker pose (marked with 4 blue dots corresponding to the detected position and orientation of the four white dots of the tracked model).
The captured scene recordings were analyzed and the latency was assessed by examining the timestamps between the frame corresponding to the start of the marker motion and the OLS responses. These three OLS latency measures mentioned above were thus determined with the following approaches:
(1) The OLS pose log file prints on a text file the date and timestamps, and the reference marker pose (the X, Y, Z-coordinate and the rotation around the X, Y, Z axes). The pose update latency in the log file can then be measured by the difference in time between the timestamp of the first frame of the marker start motion and the time in the log where the new pose related to the movement is printed out.
(2) The pose update latency in the viewer was evaluated comparing the timestamp of the first frame of the marker start motion with the first frame showing the change in the reference marker pose on the user interface.
(3) The video latency was evaluated using the time difference between the first frame showing the marker motion and the frame of the scene recording where the OLS viewer effectively displays this event (the captured image collected by the OLS cameras).
(5)精心设计板书,提高运用现代教育技术的能力。板书是教材内容的提炼和再现,通过板书让学生明确整节课的所学内容以及各知识点之间的内在联系,构建起知识体系。同时,在课堂教学中要充分发挥现代教育技术的优势。
The camera used for recording the setup is able to acquire 30 frames per second, i.e. a time-resolution of 0.03 s. However, since the system clock used as reference has an accuracy of 0.06 s, for the latency measurement a time-resolution of 0.06 s was considered.
III. RESULTS
A. LIGHT INTENSITY
The evaluation of the light intensity measurements resulted in a step function with the threshold located at 15 lux, which can be measured in a dimly lit room on a cloudy day. This means that if the light intensity was 15 lux or higher the system was able to track the marker pattern close to the reference position, while tracking was not possible at a lower light intensity.
B. SENSITIVE VOLUME
The sampling scheme proposed in Section II.C was input in the software of the robot to perform the sensitive volume evaluation. Six of the proposed positions in each slice of the Z plane could not be reached by the robot. This was either caused by the fact that the robotic arm was too short, or these positions were excluded to avoid collision of the robotic arm with the CT bore. The missing points are represented by solid black squares in the top left image of Fig.6, while the reached positions are represented by open circles. The red lines correspond to the laser lines and the laser cross.
The other images in Fig.6 detail the results for each slice of the Z plane with slice 0 being the lowest slice of the cylinders. As the dashed lines represent the perimeters of the cylinder with the largest radius no points were sampled outside these lines. The blue areas were constructed by creating a convex hull of all the points that were localized by the OLS. So the larger this area, the more positions were localized. The yellow area indicates the points which the robot could not reach and for which therefore we cannot draw any conclusions about the ability to localize the maker pattern. Finally, the white area within the dashed circle shows the positons where localization did not succeed.
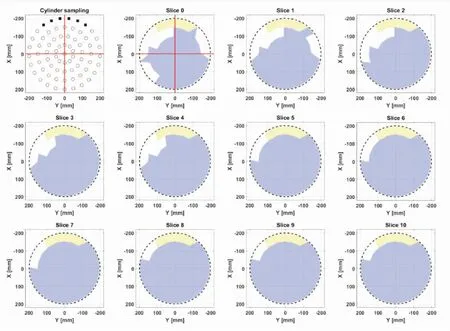
FigureS 6.Thefirstimage(top,left)representsthecylindersamplingforeachsliceintheZplane.Thesolidsquarescorrespondtothepositionsthatcouldnotbereachedbytheroboticarm.Theopencirclescorrespondtothepositionsthatcouldbereached.Theremainingimagesshowtheresultsforeachslice,withslice0beingthelowestsliceofthecylinders.TheredlinesshowwherethelaserlinesoftheCTscannerandalsothereferencepointofthescannerwerelocated(lasercross).
A cylinder with a radius of 100 mm with the center in the laser cross could always be detected. In addition, the positions that could not be detected were mostly located close to the CT bore. The results for slices 5 and higher show constant results, only excluding some points close to the CT bore. This slice corresponds to a height of about 15 cm above the room laser cross.
C. PRECISION
The bar graphs in Fig.7 show the precision evaluation results of the OLS for translation (Fig.7A) and rotation of the marker (Fig.7B). Each subgroup of bars correponds to one procedure as detailed in Table 1 and each individual bar corresponds to a direction (X, Y, or Z).
Translation of the marker along the different directions resulted in standard deviations varying from 0.01 mm up to 0.62 mm (Fig.7A). If the marker was translated in a certain direction, for example along the X axis, the corresponding standard deviation is significantly higher than for the directions that were kept constant. Evaluation of the corresponding rotation coordinates showed that the standard deviations in all directions were negligible and therefore these are not reported separately.

FigureS 7.PrecisionevaluationoftheOLS. (A)ThefirstgroupofbargraphscorrespondstothemarkerpatterntranslationintheXdirection.Eachindividualbargraphinthisgroupsshowstheprecisioninmmforeachdirectioncomponent(X,Y,andZ)ofthecoordinates.TheseconduntilfourthgroupsshowtheresultsofthetranslationinthepositiveandnegativeYdirectionsandintheZdirection.Andalsointhesecasestheindividualbarsshowtheobtainedprecisionresultsforeachdirection; (B)ThegroupsofbargraphscorrespondtorotationaroundtheYandZaxis.Eachindividualbargraphshowstheprecisioninradiansforeachdirectioncomponentoftherotationcoordinate.
Rotation of the marker around the Y and Z axes resulted in a standard deviation varying from 0.00 radians up to 0.14 radians (Fig.7B). In this case, the evaluation of the corresponding translation coordinates resulted in a standard deviation of 0.01 mm up to 1.05 mm. This can be explained by possible misalignment of the reference point of the marker pattern with the axis of rotation of the robotic arm. If this is the case, the robot will not only rotate the marker pattern, but also slightly translate.
D. ACCURACY
The bar graphs in Fig.8 show the accuracy results of the OLS after translation (Fig.8A) or rotation (Fig.8B) of the marker pattern. Also in this case, each subgroup of bars corresponds to one of the procedures and results per motion direction are reported.

FigureS 8.AccuracyevaluationoftheOLS. (A)ThefirstgroupofbargraphscorrespondstothemeasuredaccuracyaftertranslationofthemarkerpatternalongtheXaxis.Eachindividualbarcorrespondstoonedirection(X,YorZ).ThesecondandthirdgroupsofbargraphscorrespondtotranslationalongthepositiveandnegativeYaxis.ThefinalgroupshowstheaccuracyresultsaftertranslationalongtheZaxis; (B)ThesebargraphscorrespondtoclockwiserotationaroundtheYaxisandclockwiseandcounterclockwiserotationaroundtheZaxis.Alsointhiscasethedifferentdirectionsareshownseparately.
The accuracy of the OLS varies between 0.09 mm and 8.02 mm (Fig.8A). These accuracy results show the same pattern as the previously described precision results: moving the marker in a certain direction significantly decreases the accuracy for this direction in comparison with the directions that were kept constant.
The accuracy of the rotation is the mean of the difference between the measured angle difference between the starting and stop point and the actual angle. In Fig.8B these results are detailed and show a variation of 0.00 up to 0.06 radians. Also in this case, rotation along a certain axis shows a decrease in accuracy in that direction.
E. LATENCY
Table 2 shows the time differences between the start of the actual motion (first frame corresponding to motion) and the pose update in the OLS viewer and the video latency for the six position changes. The maximum latency value measured for the pose in the viewer was (0.77 ± 0.06) s and for the video was (0.56 ± 0.06) s.
For the pose update latency in the log file, the accuracy is limited by the information in the text file as the timestamps are printed out with an accuracy of a second. Since the number of pose updates per second ranged between five and ten, a proper estimation cannot be accomplished. However the reference marker pose was updated in the log file with a sub-second rate. It can be concluded that the total latency is guaranteed to be less than 1 second.
Table2Latencymeasurementsexpressedinsecondsbetweenthestartofthemarkermovementandtheupdateofthemarker’sposeinthethreesubsequentshiftsperformed.Forthemeasuresanaccuracyof0.06swasconsideredduetothetimeresolutionofthereferenceclock.

Markermotion-YdirectionPoseupdatelatencyintheviewer(s)0.380.470.77Markermotion+Ydirection0.720.510.69Videolatency(s)0.260.370.240.250.260.56
IV. DISCUSSION
When treatment, or intervention, or diagnosis guidance based on optical localization systems in the visible band of the EM spectrum are used, special precautions must be taken in order to ensure proper assessment of the system. For example, dependence on light intensity is a particular problem for these systems.
In this work, to assess the ability of the system to track the marker pattern under various lighting conditions, the light intensities in the CT room were varied by changing the intensity of the ceiling mounted lamps. As expected, we found a low threshold below which the system does not work properly any more. But, in principle, there could be a window of values within which the system is operational because, for example, higher light intensities could cause reflections on the marker pattern and disturb pattern localization. We could not detect a second threshold (after which tracker localization was not possible anymore), but we could not exclude that, testing higher light intensities than 261 lux, exceed such threshold. It appears indeed possible, but the maximum intensity values we tested were already almost not acceptable for a clinical environment.
The evaluated OLS made use of three optical cameras in the visible spectrum. To determine the distance of the marker pattern to the cameras in Z direction (depth), two cameras are required. However, in the clinical situation examined in this study, caregivers are working close to the patient. They could by accident cover (part of) the field of view of one of the cameras while positioning the patient or acquiring the US scan. This would immediately lead to improper depth determination. Therefore in the studied setup three cameras were used to have redundancy. So we recommend at least three cameras, but, in principle, also more cameras could be used.
The reported sensitive volume showed that positions that could not be localized by the OLS were often located close to the CT bore. This can potentially be explained by the fact that the presence of the CT bore can block the direct view on the marker pattern. On the other hand, as also points slightly further away from the CT bore could not be localized, there is also another explanation. The robotic arm consists of different components connected by joints. Moving the marker pattern from one position to another requires motion of these joints and in some position the joint was positioned between the marker pattern and the cameras. In this way, the view of the cameras was blocked by the robotic arm itself. In future steps, the robotic arm could be positioned at different positions around the CT table to exclude this possibility. On the other hand, also more than three cameras could be used to avoid this issue. Nevertheless, the reported sensitive volume with a 10 cm radius around the reference point of the CT scanner is sufficient for the described purpose.
Both the precision and accuracy results show that translating the marker pattern along a certain axis or rotating it around a certain axis can result in a significant decrease of precision and/or accuracy in this specific direction in comparison with the directions that were kept reasonably constant. The average measured accuracy ranged between 7 and 8 mm, which is unacceptable for the intended use. The manufacturer of the robotic arm reports a 0.2 mm nominal repeatability with zero payload. When some payload is added, it is possible that a droop occurs, as large as 1 mm when 1 kg is transported to a 500 mm reach9. In our case, though, the payload was always very limited (the marker weight is negligible for this purpose). Even if a droop was present, in any case, since the worst accuracy results are in the same direction as the shift, and the drooping in principle should not be dependent on it, we concluded that, if it is present, it should be an order of magnitude smaller than the reported error. So we considered the robotic arm as a ground truth. This work, which was intended as a guideline for users who need to test their visible light optical tracking system, showed that it is important to assess the quality of the system used to position the markers for the sensitive volume verification very carefully.
In this study also the latency measurements of the system were performed. It is important to notice that only very large delays, of the order of magnitude of seconds, could potentially produce (still probably minor) dosage errors in case significant changes happen in the patient and the operator is held off from stopping patient irradiation by the delay. However, the application of advanced treatment strategies, such as real-time adaptation of the treatment or dose based guidance, requires a good time synchronization between the radiation beams the IGRT systems. In this case, a systematic delay throughout the entire duration of the fraction could potentially hamper the effectiveness of the technique (in particular for hypo-fractionated treatments). The system we investigated was found to have an acceptable latency.
V. CONCLUSION
Optical localization in the visible band of the spectrum, for RT applications, is an interesting solution that will probably become more widespread. We proposed in this work a series of tests to perform when a hospital implements such a system, and we applied them on a system built in-house. We realized that these tests were effective as they showed the average accuracy in localization was unacceptable, ranging between 7 and 8 mm in the direction of the shifts. Moreover, we assessed what the working conditions of the system are, both in terms of light intensity and of spatial distribution of valid localization points.
Xing L, Thorndyke B, Schreibmann E, et al. Overview of image-guided radiation therapy. Med Dosim, 2006, 31:91-112.
Fontanarosa D, van der Meer S, Bamber J, et al . Review of ultrasound image guidance in external beam radiotherapy: I. Treatment planning and inter-fraction motion management. Phys Med Biol, 2015,60:R77-R114.
O’Shea T, Bamber J, Fontanarosa D, et al. Review of ultrasound image guidance in external beam radiotherapy part II: intra-fraction motion management and novel applications. Phys Med Biol, 2016,61: R90.
van der Meer S, Camps SM, van Elmpt WJC, et al. Simulation of pseudo-CT images based on deformable image registration of ultrasound images: a proof of concept for transabdominal ultrasound imaging of the prostate during radiotherapy. Med Phys, 2016,43: 1913.
Camps S, van der Meer S, Verhaegen F , et al. Various approaches for pseudo-CT scan creation based on ultrasound to ultrasound deformable image registration between different treatment time points for radiotherapy treatment plan adaptation in prostate cancer patients. Biomed Phys Eng Express, 2016,2:1-11.
Richa R, Bó APL, Poignet P. Robust 3D visual tracking for robotic-assisted cardiac interventions. Int Conf Med Image Comput Comput Interv, 2010,13(Pt 1):267-274.
Wei D, Wenlong Y, Dawei H, et al. Modeling of flexible arm with triangular notches for applications in single port access abdominal surgery. IEEE International Conference on Robotics and Biomimetics, ROBIO 2012 - Conference Digest, 2012,588-593.
Schweikard A, Shiomi H, Adler J. Respiration tracking in radiosurgery. Med Phys, 2004,31:2738-2741.
ST Robotics. at
2017- 06- 09Accepted2017- 08- 11
Davide Fontanarosa, PhD,Senior Scientist,Clinical Physics Research, Maastro Clinic,Dr Tanslaan 12,6229ET Maastricht, the Netherlands,E-mail:davide.fontanarosa@maastro.nl
10.3969/j.issn.1674- 0904.2017.05.001
CitethisarticleasCamps S , Costa M , Stevens E, et al. Evaluation of optical localization in the visible band for ultrasound guidance in radiotherapy using a robotic arm.J Cancer Control Treat, 2017,30(5):319-329.
