Study on Quantitative Relationship between Surface Wettability and Frictional Coefficient of Liquid Flowing in a Turbulent Horizontal Pipe
2017-11-01JingJiaqiangQiHongyuanJiangHuayiLiangAiguoShiJianyingWangYulongSunNanaZhangYixiang
Jing Jiaqiang; Qi Hongyuan; Jiang Huayi; Liang Aiguo; Shi Jianying;Wang Yulong,; Sun Nana; Zhang Yixiang
(1. State Key Laboratory of Oil and Gas Reservoir Geology and Exploitation, Southwest Petroleum University,Chengdu 610500; 2. Oil & Gas Fire Protection Key Laboratory of Sichuan Province, Chengdu 611731;3. College of Petroleum Engineering, Xi’an Shiyou University, Xi’an 710065;4. No. 1 Production Plant of Xinjiang Oil field Branch Company, Karamay 834000;5. Key Laboratory of Thermo-Fluid Science and Engineering of Ministry of Education, School of Energy and Power Engineering, Xi’an Jiaotong University, Xi’an 710049)
Study on Quantitative Relationship between Surface Wettability and Frictional Coefficient of Liquid Flowing in a Turbulent Horizontal Pipe
Jing Jiaqiang1,2; Qi Hongyuan1; Jiang Huayi3; Liang Aiguo4; Shi Jianying4;Wang Yulong3,5; Sun Nana3; Zhang Yixiang3
(1. State Key Laboratory of Oil and Gas Reservoir Geology and Exploitation, Southwest Petroleum University,Chengdu 610500; 2. Oil & Gas Fire Protection Key Laboratory of Sichuan Province, Chengdu 611731;3. College of Petroleum Engineering, Xi’an Shiyou University, Xi’an 710065;4. No. 1 Production Plant of Xinjiang Oil field Branch Company, Karamay 834000;5. Key Laboratory of Thermo-Fluid Science and Engineering of Ministry of Education, School of Energy and Power Engineering, Xi’an Jiaotong University, Xi’an 710049)
This paper had investigated the effects of surface wettability on the frictional resistance of turbulent horizontal flow for tap water in five pipes made of various materials and four kinds of liquids in a polytetrafluoroethylene (PTFE) pipe,with the same inner diameter of 14 mm. Pressure drops were measured under different flow rates through an experimental flow loop. The contact angles and adhesion work of liquids in contact with pipe surfaces were determined using a contact angle meter. Based on the dimension and regression analyses, two kinds of modified relationships between the frictional coefficient and the surface wettability were established according to the measured results corresponding to tap water in five pipes and four liquids in PTFE pipe. The experimental results show that the surface wettability has some influence on frictional coefficient of the studied liquids flowing in macroscale pipes, and the frictional coefficient decreases with the increase of the contact angle at the same Reynolds number. Meanwhile the effect of wettability on the hydrophobic surface is greater than that on the hydrophilic one. The frictional coefficients predicted by the modified formulas have verified to be in good agreement with the experimental values, the relative errors of which are within ±6% and ±3% for the tap water flowing in five different pipes and four kinds of liquids flowing in PTFE pipe, respectively.
wettability; contact angle; frictional coefficient; adhesion work; fluid mechanics; turbulent flow
1 Introduction
The design of an oil pipeline is vitally important to the safe operation of pipeline, and the hydraulic calculation is the basis of pipeline design. At present, traditional calculation methods and formulas of frictional resistance are relatively mature. The classic fluid dynamics assumes that the frictional coefficient is related to the roughness of the inner surface of a pipe and the Reynolds number.But in fact, the current research status shows that the frictional coefficient is still related to the pipe surface wettability[1-5].
The present researches on surface wettability mainly draw a qualitative conclusion that the hydrophobic surface could lead to larger drag reduction and friction resistance reduction in flow[6-8]. Thus, many scholars adopt various physical or chemical methods to fabricate the hydrophobic surface[9-12], aiming at reaching a better drag reduction effect[13-15]. With the large-scale promotion of non-metallic pipelines in oil field[16-17], the classic frictional coefficient formulas show greater deviations when they are applied in the oil field, since they are not completely suited to the practical conditions of the pipelines[18]. Liu established a indoor experimental apparatus to measure the on-way resistance of two non-metallic pipes[19]. The result showed that, compared with the Darcy formula, the Drew formula and the Panhandle formula were recommended to calculate the friction resistance of these two pipes.
In conclusion, no consensus has been reached at this stage as to the issue of whether hydrophobic surface has the effect of reducing friction resistance on a macroscopic scale. The quantitative relationship between the pipe surface wettability and the frictional coefficient has not been widely reported. Besides, from the view of practical application of the same liquid, different types of pipes can be chosen to transport this liquid. Similarly,for an existing pipe, different kinds of liquids can be transported in this pipe. The changes of these two parts can both affect the interface wettability. Therefore, this paper intends to study the effects of surface wettability on frictional coefficient from these two aspects. Attempts have been made to establish the relationship between the surface wettability and the frictional coefficient through the dimensional and regression analyses in turbulent flow. Through these studies, it is expected to provide a reference for pipe design and selection.
2 Experimental
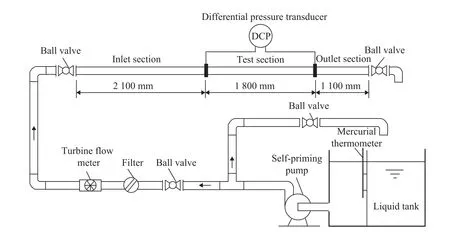
Figure 1 Schematic illustration of the experimental flow loop
Schematic illustration of the experimental flow loop is shown in Figure 1. Liquid from a tank was circulated in the pipe by a self-priming pump. The whole circulation loop was about 13 m in total length. Five replaceable test pipes covered a glass pipe, a stainless steel pipe, a plexiglass pipe, a polypropylene pipe (PP pipe) and a polytetrafluoroethylene pipe (PTFE pipe),respectively. They were all 5 m in length and 14 mm in inner diameter. Two pressure measurement points were located at 2.1 m and 3.9 m away from the inlet of test pipe, respectively. This con figuration shows that the test section of each pipe was 1.8 m in length, with the inlet stable section and the outlet stable section equating to 2.1 m and 1.1 m in length, respectively. The calculation of hydrodynamic entry length for laminar flow indicated that 2.1 m was enough to eliminate the entrance effect on the experimental results so that the flow was fully hydrodynamically developed at the test section. To reduce the experimental errors, the whole 5-meter-long test pipe was replaced by the pipes made of different materials with the same diameter according to experimental requirements. The pressure drop in test section was measured by a differential pressure transducer with a digital display screen, the measurement range of which was 0~10 000 Pa with an accuracy of 0.5%. The diameter of the pressure hole in each pipe was 2 mm. The liquid flow rate was controlled by a ball valve installed at the inlet and the outlet of pipes. To satisfy the measurement accuracy under different flow patterns, two turbine flow meters with different ranges (0.04—0.4 m3/h and 0.4—8 m3/h) with an accuracy of 0.5% were used to measure the flow rate of the liquid. In order to reduce errors in the experiments, each pipe was tested three to four times at a given flow rate and the average pressure drop was taken as the final data. The temperature of liquid, which was controlled by an indoor air conditioner,was set at 28 °C and was measured by a mercurial thermometer placed in the liquid tank.
2.1 Tap water flow in five pipes
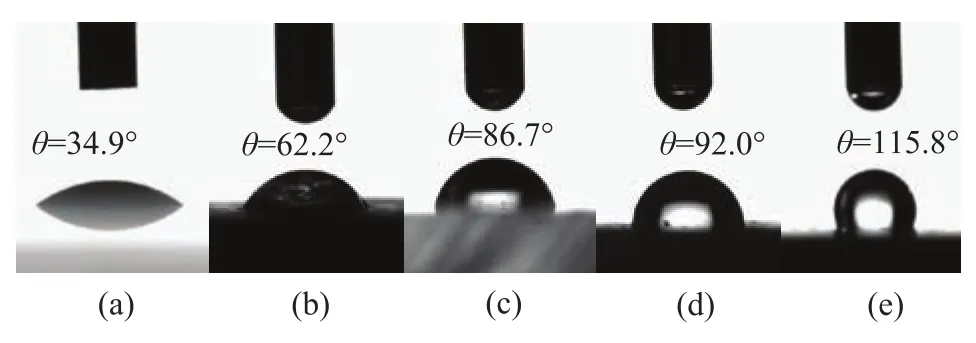
Figure 2 Photos of tap water on five pipe surfaces: (a)glass, (b) stainless steel, (c) plexiglass, (d) PP, and (e) PTF E
In general, the wettability of a solid surface is characterized by the static contact angle (contact angle for short).In order to compare the surface wettability of five test pipes, the contact angle of tap water on five surfaces was measured by the sessile drop technique using a contact angle meter (JC2000D2, Shanghai Zhongchen Digital Technique Apparatus Co., Ltd.) at room temperature (28± 0.5 °C). Before measuring, each pipe was cut into four test specimens (5 mm×5 mm×3 mm) at different locations.Then a 3-μL liquid droplet controlled by a micro-syringe was dropped on each test specimen of the pipe. The photos of contact angles are shown in Figure 2. The contact angle of each pipe was the average of 20 sets of experiment data.Surface energies of five pipes were obtained using the Owens-Wendt method[20]. Distilled water and diiodomethane were selected as the test liquids. The surface energy of each specimen was measured five times, and the average surface energy of each pipe was obtained. The pipe surface roughness Ra(arithmetical mean deviation) was directly measured using a surface roughness tester (TR 200, Beijing Times Peak Co., Ltd). The measurement was repeated at four different locations at the inlet and the outlet of each pipe, respectively. The 8 sets of data were averaged. The results of measurement are shown in Table 1. Tap water was the test liquid for measuring the contact angle, with its density, viscosity and surface tension at 28 °C equating to 0.995 g/cm3, 0.91 mPa·s, and 70.13 mN/m, respectively.Besides the contact angle, the adhesion work also reflects the binding ability of the solid-liquid interface and the interaction force between the molecules in two phases. At the interface, the adhesion work[21-22]can be represented as:
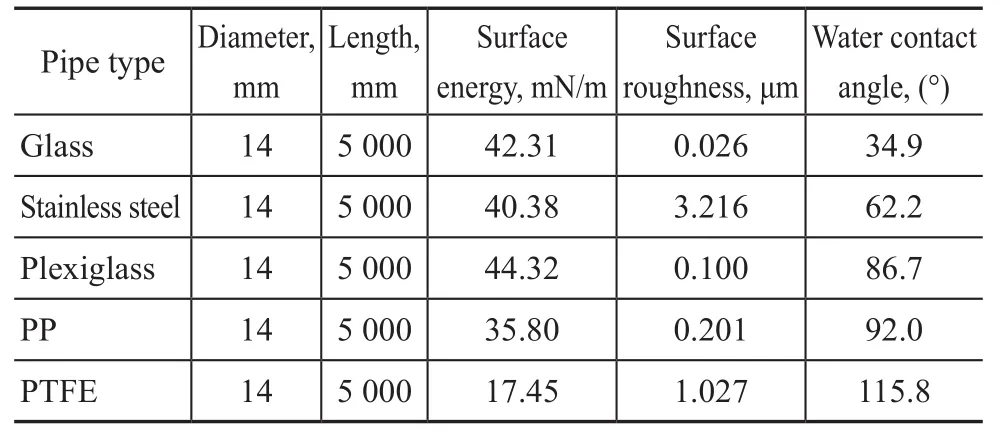
Table 1 Properties of five pipes

where γlgis the liquid-gas interfacial tension, Wais the adhesion work and θ is the apparent contact angle.The cohesion work Wcis defined as that capable of creating an interface within a liquid and separating them to two independent surfaces against vapor. It is expressed as:

By using Equations (1) and (2), the adhesion work between the tap water and five pipe surfaces, and the cohesion work of tap water can be calculated,respectively. The result is shown in Figure 3.
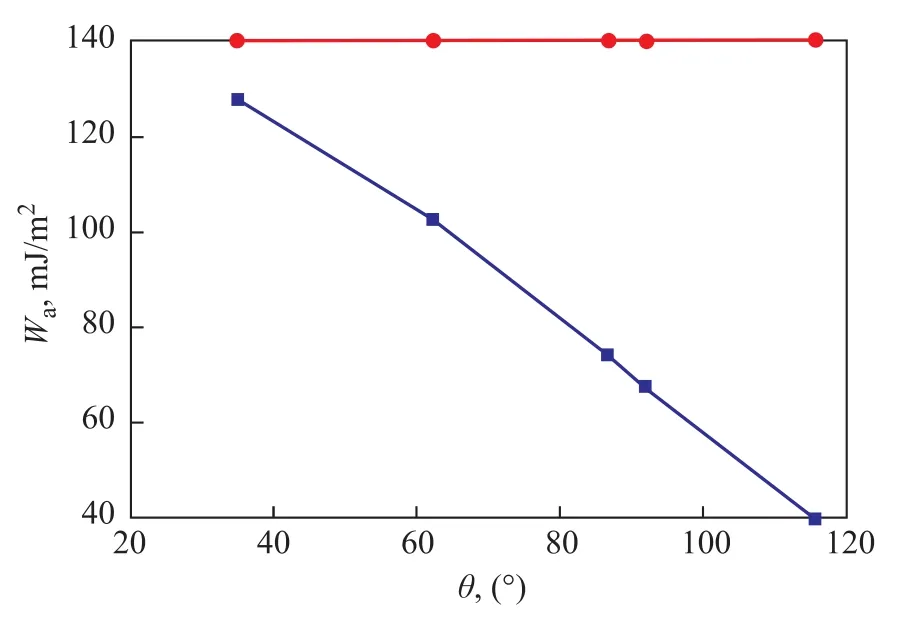
Figure 3 Cohesion work of tap water and adhesion work with five pipes
2.2 Four liquid flows in PTFE pipe
The four liquids are #0 diesel, a mixture of #26 white oil:#0 diesel (1:9), a mixture of glycerine:tap water(1:3) and a mixture of ethylene glycol:tap water (1:2),respectively. The #0 diesel was obtained from the Shell gas station in Yanchang. The #26 white oil was provided by the Shaanxi Huntair Co., Ltd. Glycerine and ethylene glycol were provided by the Chengdu Kelong Chemical Factory. The contact angle photo of each liquid on the PTFE surface is shown in Figure 4. The basic properties of four liquids are shown in Table 2.
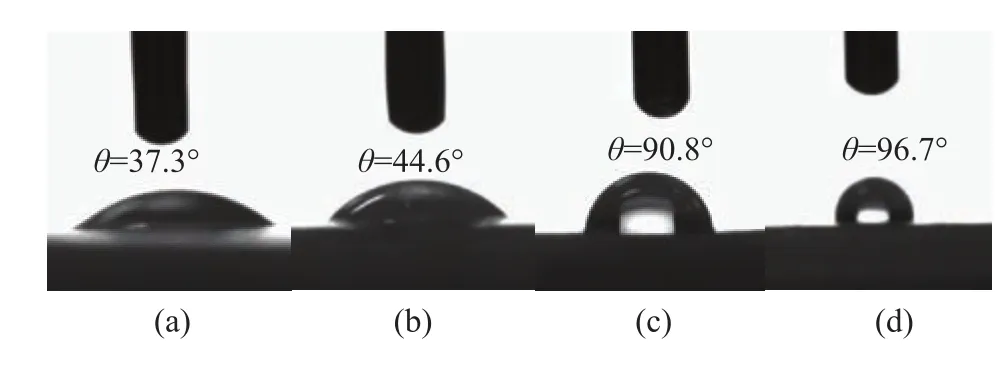
Figure 4 Photos of four liquids on PTFE pipe surface:(a) #0 diesel, (b) mixture of #26 white oil:#0 diesel (1:9), (c)mixture of glycerine:water (1:3), and (d) mixture of ethylene glycol:water (1:2)
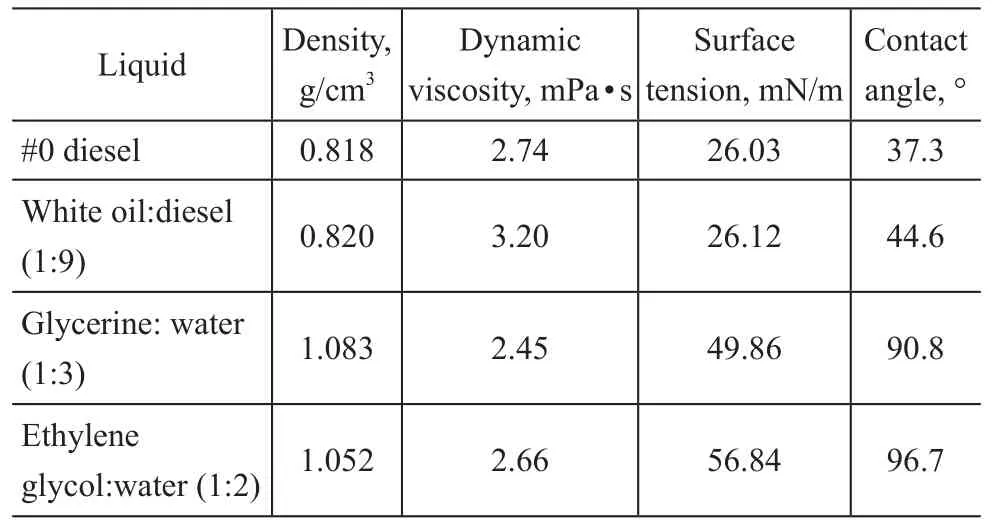
Table 2 Properties of four liquids (28 °C)
Similarly, the adhesion work of four liquids on PTFE pipe surface and the corresponding cohesion work are shown in Figure 5.

Figure 5 Cohesion work of four liquids and adhesion work with PTFE pipe
2.3 Uncertainty analysis
According to the Darcy formula, the frictional coefficient λ is:

where l, Q, d, ρ and ΔP are pipe length, volume flow rate, pipe diameter, fluid density and pressure drop,respectively. The Reynolds number Re is:

where v is the kinematic viscosity of experimental liquid,which is a function of temperature. According to Equation(3), the uncertainty in determining frictional coefficient λ consists of the uncertainties originating from d, l, Q, ρ,and ΔP. Similarly, the uncertainty of Reynolds number Re is determined by the uncertainties of d, v, and Q.
The diameters of five pipes are measured by a digital vernier caliper with a precision of 0.01 mm. The pipes used in this study are 14 mm in diameter, so the error is 0.07%. The pipe length in the experiment is 5 m with a measuring precision of 1 mm, so the error is around 0.2%.The resolution of differential pressure transducer is 1 Pa, which results in an uncertainty in the pressure drop measurement ranging from 2% for slower flows to 0.5%for higher flows. The flow rate is measured by a turbine flow meter with a precision of 0.5, so the uncertainty is 0.5%. The uncertainty of liquid density is 0.1%. During the experiments, the temperature variation is ±0.5 °C at a set temperature of 28 °C. The uncertainty of viscosity caused by temperature variation is about 1%. The uncertainty of contact angle measurement is ±2°. Based on the error analysis method[23], the uncertainty of λ and Re in flow are:
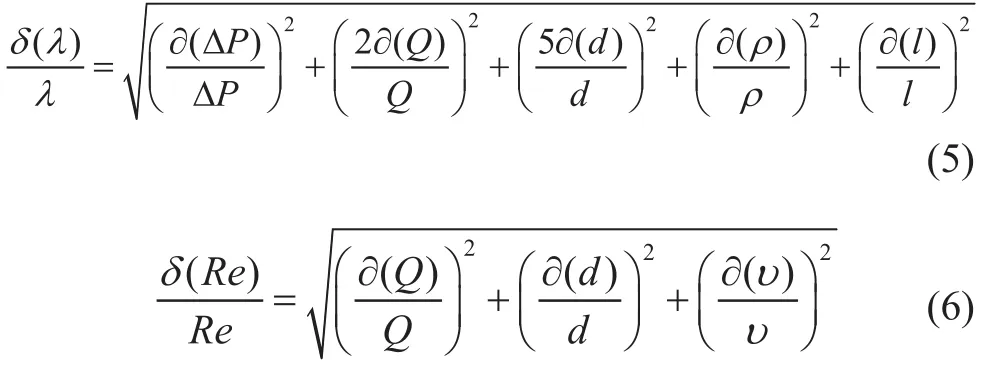
According to Equations (5) and (6), the maximum uncertainty of λ in experiments is estimated at about 2.27%and that of Re is 1.12% based on a 95% confidence level.
3 Results and Discussion
3.1 Comparison of experimental and theoretical frictional coefficients
This study presents the comparison of experimental and theoretical frictional coefficients and veri fies the effect of wettability on the frictional resistance from two parts. The experimental results are shown in Figure 6 and Figure 7,respectively.
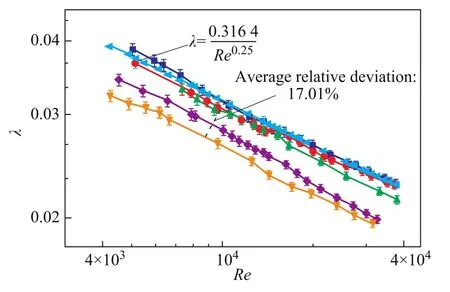
Figure 6 Plot of frictional coefficient of water against the Reynolds number in five pipes
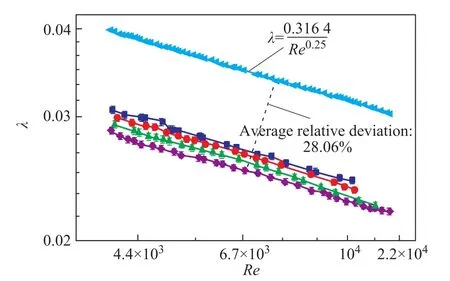
Figure 7 Plot of frictional coefficients of four liquids against the Reynolds number in PTFE pipe
It can be seen from Table 1 that the absolute pipe roughness of five pipes ranges from 0.026 μm to 3.216 μm. According to the definition of relative roughness ε, viz. the ratio of absolute roughness to the pipe inner diameter, the relative roughness of five pipes can be determined. And then the critical Reynolds number between the hydraulic smooth region and the mixed friction area of turbulent regime could be approximately figured out as 59.7/ε8/7[24]. Through calculation, the minimum critical Reynolds number (3.90×10⁵) is far greater than the maximum experimental Reynolds number of the tap water flowing in five pipes (37977). In the same way, the maximum experimental Reynolds number of four liquids flowing in the PTFE pipe (11747) is also considerably below the critical Reynolds number. So the flow regime of all experimental data is in a hydraulic smooth region of turbulent flow. Hence, the effect of surface roughness can be neglected based on the classic theory of fluid mechanics.
In Figure 6 and Figure 7, the effect of surface wettability is evaluated according to the agreement analysis between the measured and the theoretical values of frictional coefficient.The greater the contact angle of liquid on pipe surface, the smaller the frictional coefficient of liquid would be. As depicted in Figure 6, for glass pipe, stainless steel pipe and plexiglass pipe, the frictional coefficients of tap water in three pipes can better fit their theoretical values calculated by the Blasius formula (λ=0.316 4/Re0.25). The universally accepted theory of classic fluid dynamics relying on the assumption of non-slip boundary condition seems to be still applicable to the three pipes.
This phenomenon may be explained in this way: Many studies have confirmed that the occurrence of wall slip on the solid-liquid interface depends on whether the solid wall can be wetted by liquid[25]. From a microscopic perspective, it depends on the difference between the cohesion work of liquid and the adhesion work of solidliquid interface. And the greater the difference of two work values, the harder the solid wall would be wetted. It can be seen from Figure 3 that the cohesion work of tap water is 140.62 mJ/m2. The magnitude of adhesion work of five pipes with tap water decreases in the following order: glass pipe (127.65 mJ/m2) > stainless steel pipe(102.84 mJ/m2) > plexiglass pipe (74.17 mJ/m2) > PP pipe(67.68 mJ/m2) > PTFE pipe (39.61 mJ/m2). Hence these smaller differences between cohesion work and adhesion work for glass pipe, stainless steel pipe and plexiglass pipe make the tap water easier to adhere to these pipe surfaces, resulting in a greater friction loss. Besides,notwithstanding the appropriate surface roughness can promote the hydrophobicity of pipe surface, either the rougher surface of stainless steel or the smoother surface of glass and plexiglass could be hard for tap water to form an air cushion[26]. So the average relative deviation of frictional efficient between the experimental values and the theoretical values is only 0.93% in glass pipe,2.24% in stainless steel pipe, and 4.18% in plexiglass pipe, respectively. Therefore, upon considering inevitable experimental errors, the wettability of pipe surface has no influence on the frictional coefficient in a relatively wetted pipe.
However, in the PP pipe and the PTFE pipe, the experimental values of frictional coefficient of tap water thoroughly depart from the theoretical values. And the gap between them becomes greater with an increasing contact angle. The average relative deviation reaching up to 17.01% appears in the PTFE pipe. Additionally we can see from Figure 7 that the frictional coefficients of four liquids flowing in the PTFE pipe also have greater deviations as compared with the theoretical values.The maximum deviation reaches up to 29.06% for the mixture of ethylene glycol and tap water (1:2), the minimum deviation reaches 21.10% for #0 diesel. The liquid with a bigger contact angle has a smaller frictional coefficient at the same Reynolds number. Obviously, the classic frictional coefficient formula has not produced satisfactory experimental results, and in that case the impact of surface wettability can hardly be ignored.
One reason for this phenomenon can be attributed to the non-wetting PTFE pipe wall, and the adhesion work of tap water in the pipe is as low as 39.61 mJ/m2,which results in a greater discrepancy with cohesion work of water. Especially the surface modified with specific fluorine element displays excellent hydrophobic property. So a part of liquid on the wall apparently slips which actually leads to a smaller frictional resistance as compared with other pipes. For another reason, there are many approximately micro-nanoscale protruding spherical particles that are uniformly distributed on the PTFE surface, which increases the surface porosity and provides a sufficient roughness for hydrophobic surface.When a small liquid droplet is deposited on its surface,this is exactly the micro-nanostructure that can decrease the contact area of water and pipe surface, and hold back more air to prevent water from seeping into the gap[9,27].Therefore, the friction is shifted from the liquid-solid interface into the liquid-air interface, which greatly reduces the frictional resistance. Similarly, the frictional coefficient of PP pipe is greater than that of PTFE pipe.In Figure 5, the adhesion work and cohesion work of four liquids are all different due to different surface tension values of four liquids. The magnitude of the difference between the adhesion work and the cohesion work increases in the following order: #0 diesel (5.32 mJ/m2)< mixture of white oil and diesel (1:9) (7.52 mJ/m2)<mixture of glycerine and tap water (1:3) (50.56 mJ/m2) <mixture of ethylene glycol and tap water (1:2) (63.47 mJ/m2).Based on these data we can see that the binding force between diesel and PTFE is firmer and the wetting degree of PTFE surface by diesel is stronger. Therefore, the diesel is difficult to slip on the PTFE surface in flow and the frictional coefficient of diesel is greater. Conversely,the greater discrepancy between adhesion work and the cohesion work of the mixture of ethylene glycol and tap water (1:2) leads to a smaller frictional coefficient.
To further observe the impact of pipe surface wettability on frictional coefficient more intuitively, the dependence of the frictional coefficient of liquids on contact angle at the same Reynolds number is given in Figure 8 and Figure 9, respectively.
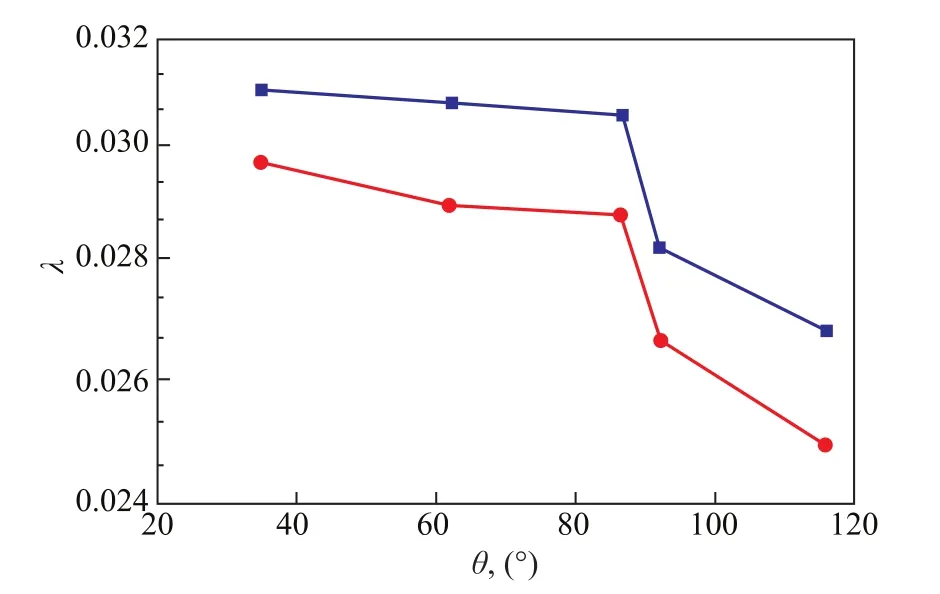
Figure 8 Dependence of the frictional coefficient of tap water on contact angle
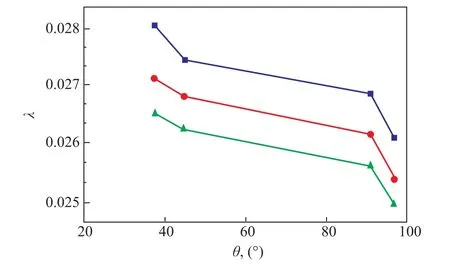
Figure 9 Dependence of the frictional coefficient of four liquids on contact angle
In Figure 8 and Figure 9, we found that the frictional coefficient of liquid decreases gradually with the increase of contact angle at the same Reynolds number. And the effect of surface wettability on frictional coefficient in the hydrophobic pipe is greater than that in the hydrophilic pipe. In Figure 8, when the contact angle increases from 34.9° to 86.7°, the corresponding frictional coefficient only reduces by 1.55% at Re=9 856 and by 3% at Re=12 465, which could be approximately ignored as compared with the experimental error. But when the contact angle exceeds 90°, the smaller increase of contact angle from 92° to 115.8° has led to a greater frictional coefficient reduction by 5% at Re=9 856 and by 6.16%at Re=12 465. In the same way, as shown in Figure 9,when the contact angle increases from 37.3° to 44.6°, the corresponding frictional coefficient only reduces by 2.22%at Re = 5 727, by 1.14% at Re = 6 492, and by 0.98% at Re = 7 047, respectively. While the contact angle is in the range of 90.8°~96.7°, the reduction of corresponding frictional coefficient is 2.83% at Re = 5 727, 2.90% at Re = 6 492, and 2.50% at Re = 7 047, respectively.From here it can be concluded that the effect of surface wettability on the frictional coefficient of four liquids is less than that on the frictional coefficients of tap water in five pipes. In other words, compared with that from liquid point for the same pipe, it has more practical significance to increase the contact angle of solid-liquid interface from the pipe point for the same liquid.
3.2 modified frictional coefficient formula
Through the above pipeline experiments, the results suggest that most experimental values of the frictional coefficient are over-predicted by the Blasius formula. The main reason may be that the theoretical formula neglects the drag reduction effect of pipe surface wettability. In general, the influencing factors of surface wettability are characterized by the cosine of contact angle. Therefore,the contact angle θ is introduced into the calculation of frictional resistance as an influencing factor.
Based on the above analysis, the main influencing factors on the differential pressure of fluid flow in a horizontal pipe cover the pipe length l, the pipe diameter d, the fluid density ρ, the fluid dynamic viscosity μ, the flow velocity u and the contact angle θ. The functional form can be written as:

By means of dimension analysis, the following dimensionless form of Equation (7) is obtained:

And hence,

where hfis the head loss of pipe, which is proportional to l/d. After the introduction of the Reynolds number,Equation (9) becomes:

Equation (10) can be expressed as:

where λ is the frictional coefficient. So

It can be seen from Equation (12) that the modified frictional coefficient is a function of the Reynolds number Re and the non-dimensional parameter cosθ.
Furthermore, a modified frictional coefficient formula containing the contact angle in turbulent flow is given by:

where a1and a2are the undetermined parameters, ε is the relative roughness of an inner pipe surface.
Through the experimental section research, the results show that these two parts both have different influence on the relationship between the frictional coefficient and the contact angle. Therefore, two kinds of modified frictional coefficient formulas are established and verified by the corresponding experimental data relating to these two aspects, respectively.
3.2.1 Verification by measured results of tap water flowing in five pipes
By using 86 sets of experimental data of tap water flowing in five pipes and the SPSS regression analysis, the value of a1and a2can be calculated. Thus, Equation (13) turns out to be:

Then the above model and the correlation coefficient are verified with the SPSS regression analysis. The results are shown in Table 3 and Table 4.

Table 3 Regression model

Table 4 Test results of correlation coefficient
It can be seen from Table 3 that the adjustment accuracy R2of the regression model is 0.999. Through the F test,the significance level is equal to 0.000. It can be seen from Table 4 that after t test, the significance level is also equal to 0.000. Thus, the coefficients of model are not all zero and the model has a relatively high fitting precision.Besides, the result of collinearity diagnosis suggests that the collinearity problem between variables does not exist.In conclusion, the regression model is more reasonable.The frictional coefficients predicted by the modified formula (14) are compared with the experimental values of tap water flowing in five pipes. The result is shown in Figure 10.
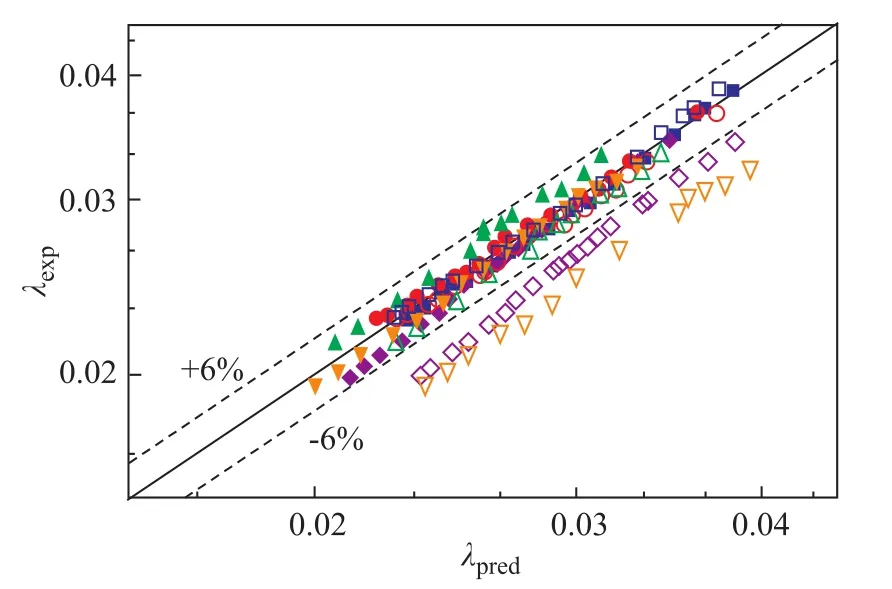
Figure 10 Comparison of experimental and predicted data before and after modification ( five pipes)
In Figure 10, as a whole, it is obvious that the predicted values of frictional coefficient after modification are in good agreement with the experimental values within a relative error of ±6%. As for water flowing in the glass pipe, the stainless steel pipe and the plexiglass pipe, whether it is necessary to consider the effect of the surface wettability seems impossible to affect the outcome. This is also consistent with the experimental results of tap water flowing in five pipes. The average relative error of frictional coefficient between the predicted values after modification and the experimental values is slightly higher than that between theoretical values and experimental values by 0.92% in the glass pipe, and by 0.62% in the plexiglass pipe, respectively.Also in the stainless steel pipe, the average relative error is lower by 1.16%. Upon considering the inevitable experimental errors and the calculated errors, the average relative error of ±1.16% is within an accepted error scope.As for the PP pipe and the PTFE pipe, we can see that the predicted values after modification are closer to the experimental values. The gap between the predicted and the experimental values declines from 12.47% to 2.75%in the PP pipe, and from 17.01% to 1.60% in the PTFE pipe, respectively, which means that it is a right choice to take the effect of wettability on frictional coefficient into consideration.
3.2.2 Veri fication by measured results of four liquids flowing in PTFE pipe
Similarly, 91 sets of experimental data of four liquids flowing in the PTFE pipe coupled with the SPSS regression analysis are used to calculate the value of a1and a2. Thus, Equation (13) can be written as:
Then the above model and the correlation coefficient are tested with the SPSS regression analysis. The results are shown in Table 5 and Table 6.It can be seen from Table 5 and Table 6 that the regression model is also more reasonable. Similarly, the experimental data of four liquids flowing in PTFE pipe are compared with the predicted data before and after modification, and the result is shown in Figure 11.

Table 6 Test results of correlation coefficient
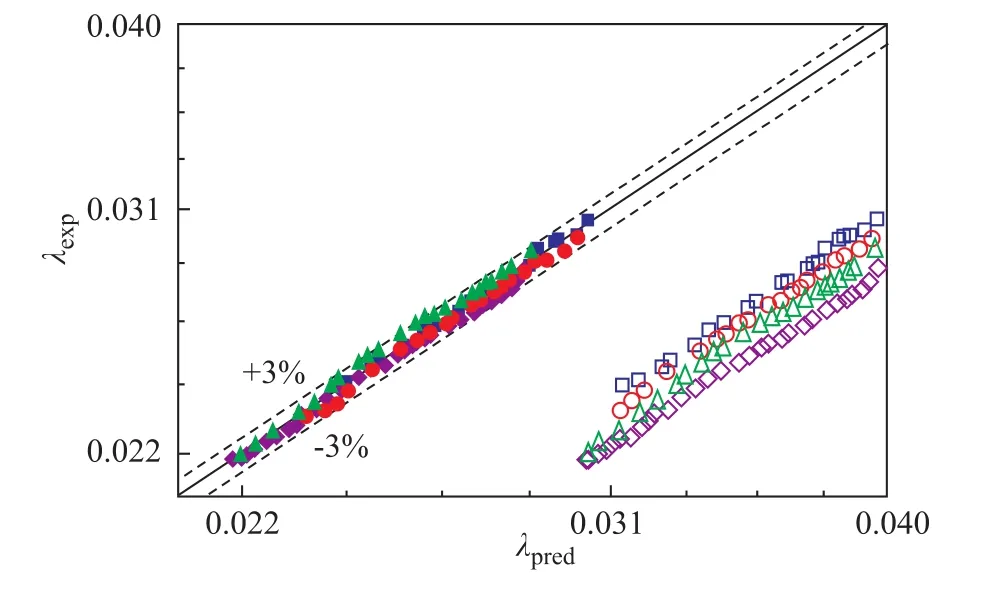
Figure 11 Comparison of experimental and predicted data before and after modification (four liquids)Before modification: □—#0 diesel;
In Figure 11, the effects of surface wettability for four liquids are more obvious. However, in the same pipe the effect of wettability exerted by different liquids on frictional coefficient still cannot be ignored. Before modification, the maximum average relative deviation of frictional coefficient between the experimental values and the theoretical values can reach up to 28.06% for the mixture of ethylene glycol:tap water (1:2). But after modification, this number drops to only 0.72%. As for the other three liquids, the average relative error is 0.55% for #0 diesel, 0.93% for the mixture of white oil:diesel (1:9), and 0.84% for the mixture of glycerine:tap water (1:3), respectively. In a word, the modified frictional coefficient formula has high prediction accuracy with a relative error of ±3%.
4 Conclusions
In this study, the effect of surface wettability on frictional resistance in the turbulent flow was experimentally investigated by tap water flowing in five pipes and four liquid flowing in PTFE pipe based on the results obtained in an experimental flow loop. After the evaluation of the consistence between the experimental values and the theoretical values of frictional coefficient at the same Reynolds number, the results showed that the surface wettability had a significant impact on the frictional coefficient in the macroscale pipe. And the frictional coefficient decreased gradually with an increasing contact angle at the same Reynolds number. Meanwhile the magnitude of effect of surface wettability in hydrophobic pipes was greater than that in hydrophilic pipes.
Based on the dimensional and regression analyses, two modified frictional coefficient formulas considering the contact angle were well established. After being verified by the experimental results, two formulas both had very high prediction accuracy, while the effect of wettability on frictional coefficient could not be ignored. The relative error was within ±6% for tap water flowing in five different pipes and within ±3% for four kinds of liquids flowing in the PTFE pipe.
Acknowledgements: This work was supported by the National Major Science & Technology Project of China(No. 2016ZX05025004-005) and the Science & Technology Project of Sichuan Province (Grant No. 2015JY0099).
[1] Lee T, Charrault E, Neto C. Interfacial slip on rough,patterned and soft surfaces: A review of experiments and simulations[J]. Advances in Colloid and Interface Science,2014, 210: 21-38
[2] Neto C, Evans D R, Bonaccurso E, et al. Boundary slip in Newtonian liquids: A review of experimental studies[J].Reports on Progress in Physics, 2005, 68(12): 2859-2897
[3] Rothstein J P. Slip on superhydrophobic surfaces[J].Annual Review of fluid Mechanics, 2010, 42(1): 89-109
[4] Zhang P, Lv F Y. A review of the recent advances in superhydrophobic surfaces and the emerging energyrelated applications[J]. Energy, 2015, 82: 1068-1087
[5] Sun H. Research on the characteristic of the flow obstruction of the fluid whith fluid flowing in the tube made of different materials[J]. Journal of Xinjiang Petroleum Institute, 2004, 16(3): 70-84 (in Chinese)
[6] Watanabe K, Udagawa Y, Udagawa H. Drag reduction of Newtonian fluid in a circular pipe with a highly waterrepellent wall[J]. Journal of fluid Mechanics, 1998, 381:225-238
[7] Watanabe K, Udagawa H. Drag reduction of non-Newtonian fluids in a circular pipe with a highly waterrepellent wall[J]. AICHE Journal, 2001, 47(2): 256-262
[8] Lv F Y, Zhang P. Drag reduction and heat transfer characteristics of water flow through the tubes with superhydrophobic surfaces[J]. Energy Conversion and Management, 2016, 113: 165-176
[9] Dong H, Cheng M, Zhang Y, et al. Extraordinary dragreducing effect of a superhydrophobic coating on a macroscopic model ship at high speed[J]. Journal of Materials Chemistry A, 2013, 1(9): 5886-5891
[10] Choi C H, Westin K J A, Breuer K S. Apparent slip flows in hydrophilic and hydrophobic microchannels[J]. Physics of fluids, 2003, 15(10): 2897-2902
[11] Ou J, Perot B, Rothstein J P. Laminar drag reduction in microchannels using ultrahydrophobic surfaces[J]. Physics of fluids, 2004, 16(12): 4635-4643
[12] Daniello R J, Waterhouse N E, Rothstein J P. Drag reduction in turbulent flows over superhydrophobic surfaces[J]. Physics of fluids, 2009, 21(8): 085103
[13] Han H S, Sun X B, Wang X B, et al. Study offlow law about oil in pipeline with nanometer layer[J]. Offshore Oil,2006, 26(3): 83-86 (in Chinese)
[14] Lyu S, Nguyen D C, Kim D, et al. Experimental drag reduction study of super-hydrophobic surface with dualscale structures[J]. Applied Surface Science, 2013, 286:206-211
[15] Aljallis E, Sarshar M A, Datla R, et al. Experimental study of skin friction drag reduction on superhydrophobic flat plates in high Reynolds number boundary layer flow[J].Physics of fluids, 2013, 25: 025103
[16] Qi D, Li H, Cai X, et al. Application of non-metallic composite pipes in oilfields in China[C]. International Conference on Pipelines and Trenchless Technology,American Society of Civil Engineers, 2012
[17] Zhou Y X, Chen B, Li J Y. Application and evaluation of non-metallic pipeline in Lamadian oilfield[J]. Advanced Materials Research, 2013, 694-697: 521-525
[18] Mustaffa Z B, Albarody T M B. Flexible thermosetting pipe[J]. Advanced Materials Research, 2014, 983: 444-449
[19] Liu B J, Guan C, Zong Z C. Hydraulic experimental study on two kinds of nonmetallic plastic pipes[J]. Advanced Materials Research, 2012, 594-597: 2014-2017
[20] Owens D K, Wendt R C. Estimation of the surface free energy of polymers[J]. Journal of Applied Polymer Science, 1696, 13(8): 1741-1747
[21] Girifalco L A, Good R J. A theory for the estimation of surface and interfacial energies. I. derivation and application to interfacial tension[J]. Journal of Physical Chemistry, 1957, 61(7): 904-909
[22] Nikolov A, Wasan D. Current opinion in superspreading mechanisms[J]. Advances in Colloid and Interface Science,2015, 222: 517-529
[23] Moffat R J. Describing the uncertainties in experimental results[J]. Experimental Thermal and Fluid Science, 1988,1(1): 3-17
[24] Blasius H. Grenzschichten in Flüssigkeiten mit kleiner Reibung[J]. Zeitschrift Fur Angewandte Mathematik und Physik, 1908, 56: 1-37
[25] Xie Z L, Rao Z S, Na T, et al. Theoretical and experimental research on the friction coefficient of water lubricated bearing with consideration of wall slip effects[J].Mechanics & Industry, 2016, 17(1): 106
[26] Tretheway D C, Meinhart C D. A generating mechanism for apparent fluid slip in hydrophobic microchannels[J].Physics of fluids, 2004, 16(5): 1509-1515
[27] Park K C, Choi H J, Chang C H, et al. Nanotextured silica surfaces with robust superhydrophobicity and omnidirectional broadband supertransmissivity[J]. ACS Nano, 2012, 6(5): 3789-3799
date: 2017-04-06; Accepted date: 2017-05-31.
Qi Hongyuan, E-mail: haidailovely_7@163.com.
杂志排行
中国炼油与石油化工的其它文章
- Thermal Decomposition Behavior of Terephthalate in Inert Gas
- Molecular Simulation of Competitive Adsorption on Fe(110) Between Gasoline Detergent and Deposit: I. Physical Adsorption
- Characterization and Apparent Kinetics of Polymerization of 1-Decene Catalyzed by Boron Trifluoride/Alcohol System
- Preparation of Cu-, Zn-, Co-Zeolites and Application for Adsorptive Desulfurization of Saudi Arabian Medium Crude
- Study on Con fined Impinging Jet Mixer and Mechanism offlash Nanoprecipitation
- Antimicrobial Degradation Performance of Novel Polyacrylamide Derivatives by Microbial Consortia for Enhanced Oil Recovery
