Study on the Hydrodynamic Characteristics of Venturi-Rod Deck Tray
2017-11-01LiuJianxinSunGuogangWangXinchengZhaoFei
Liu Jianxin; Sun Guogang; Wang Xincheng; Zhao Fei
(State Key Laboratory of Heavy Oil Processing, China University of Petroleum, Beijing 102249)
Study on the Hydrodynamic Characteristics of Venturi-Rod Deck Tray
Liu Jianxin; Sun Guogang; Wang Xincheng; Zhao Fei
(State Key Laboratory of Heavy Oil Processing, China University of Petroleum, Beijing 102249)
The Venturi-rod deck tray is a type of dual flow trays used in flue gas desulfurization (FGD) process. In this paper, the hydrodynamic characteristics of the Venturi-rod deck tray were studied in the experiments and compared with the conventional sieve tray. Results showed the turndown ratio of this tray was in the range of 2.71—3.77, which was by 9%higher than the sieve tray. Besides, the pressure drop of this tray was by more than 50% lower than the sieve tray. Based on the experimental data, the correlation functions for the pressure drop and the froth height, respectively, were obtained. The industrial scale up practice of this tray in FGD process was described with the efficiency of this tray demonstrated.
dual flow tray; scrubber; Venturi; hydrodynamic characteristics
1 Introduction
Trays are commonly used structures in columns for distillation or separation of liquid-gas mixtures[1-3].Based on the liquid-gas flow path, trays can be classified in cross-flow trays or dual flow trays.For the cross-flow tray, the liquid flows downward through the downcomer, while the gas rises upward through the slots on the tray deck. The dual flow tray, also known as the turbogrid tray or ripple tray,enables the fluid and gas to flow through the same slots on the tray deck in a counter-current path as there is no downcomer attached[4-5]. Compared with the cross-flow tray, the cross section area of the dual flow tray is by 15%—30% larger allowing more gas to pass through, resulting in higher gas treating capacity[4]. The pressure drop of the dual flow tray is also lower than the cross-flow tray in its operation range, which can save the operating cost for the industrial application[6]. This tray is usually applied in circumstances prone to fouling thanks to its advantages of self-cleaning, and ease of fabrication.Typically in the FGD (flue gas desulfurization) unit,the dual flow tray can provide a substantial increase of the flue gas/slurry contact time in the spray scrubber due to the improvements of the flow regime[7].However the conventional dual flow tray still suffers
from low tray efficiency and operating flexibility because of the short residence time of liquid on the tray deck[4,8]. At the same time, in columns with large diameter, an unbalanced arrangement of this tray could also result in flow instability[4,9].
Tray structure, especially the opening slot type, is a significant factor that can affect the liquid-gas flow regime as well as the mass transfer efficiency in the column[10-12]. Previous hydrodynamic investigations on the dual flow tray mostly focus on the sieve type or the turbogrid type trays[13-16], where the CFD method is commonly used to analyze the flow field[17-18].It is reported that these two types of trays have comparable performance with the equivalent hydraulic diameters[19]. This might be resulted from the similar straight opening slots used for both two trays. Due to the sudden change of cross section, the stagnation flow zones are formed near the inlet and the outlet of the straight slot. On the one hand, the stagnation flow zones can increase the energy dissipation leading to higher pressure drop. On the other hand, the mixture between the air and the liquid in this region diminishes.
The related studies have shown that the open channel with a continuous configuration could effectively utilize the air energy. Typical application is the Venturi scrubber, which consists of a converging section, a throat section and a diverging section adopted in the gas cleaning processes[20-23]. By using the gradually changing structure in the converging and the diverging sections, a stagnation flow zone can be avoided in the flow field. The high velocity in the small throat section can function to shear the liquid and contribute to better mixing the two phases. It is reported that the Venturi scrubber is capable of achieving highest efficiency among any wet scrubber system. Therefore,it is also expected that the efficiency can be improved by applying the Venturi con figuration in the dual flow tray design. The Venturi-rod deck tray, which has the Venturi con figuration slots, was initially developed by DUCON Company (USA) and has been widely used in the FGD processes. However, the influence of tray structure on the hydrodynamic characteristics, which is important for process design, is still unclear.
In this paper, experiments were carried out to test the hydrodynamic performance of Venturi-rod deck trays with water and air as the flow mediums in a laboratory spray scrubber. The flow regimes were observed and associated with the dependence on variations of pressure drop. The relevant results were also compared with those of the sieve tray.
2 Experimental
2.1 Experiment installations
The spray scrubber unit is shown in Figure 1. The scrubber was made of Plexiglas with an inner diameter of 286 mm and a height of 2 300 mm. Air serving as the gas phase was blown into the scrubber from the bottom side. The air flow velocity was measured with a hot wire anemometer. Water was used as the liquid phase (serving as slurry in the practical scrubber) and its flow rate was measured with a rotameter. A spiral nozzle (BSPTI/4P40-60S-316L) was mounted above the tray to form a conical spray with a jet angle of 60°. After contacting with the air, water moved downward across the tray prior to being discharged to the reservoir.
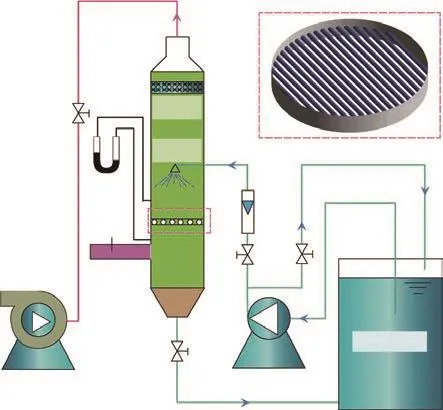
Figure 1 Schematic diagram of the spray scrubber unit
The Venturi-rod deck tray in this paper was a layer of hollow rods with the ends jointed to scrubber wall as shown in Figure 2. The tray was installed 400 mm above the air inlet and 5 Venturi-rod deck trays with different rod gaps and diameters were considered in this paper.Besides, a sieve tray with a comparable voidage was also used in the experiment. The specific structure parameters of the trays are listed in Table 1.
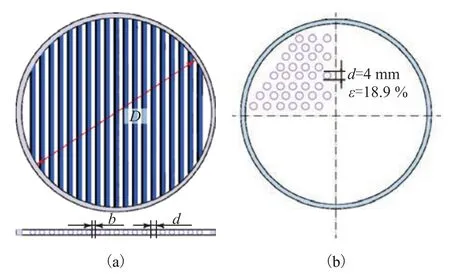
Figure 2 Schematic diagrams of Venturi-rod deck tray (a)and sieve tray (b)

Table 1 The structure parameters of Venturi-rod deck trays
2.2 Experimental parameters
The pressure drop across the Venturi-rod deck tray (ΔPv)was measured with U-tubes, with two test points 450 mm above and 200 mm below the tray, respectively.The turndown ratio is used to characterize the width of operational range of tray and is de fined as:

where VGFis the froth air velocity, and VGSis the spray air velocity.
The voidage of the tray (ε) is de fined as the ratio of the gap area between the rods to the overall area of the tray and is calculated with the following equation:

where AVis the voidage area while considering the plane across all the axes of the rod, and ATis the overall longitudinal section area of the tray.
For the calculation of the hydrodynamic parameters of tray, the equivalent diameter was used, which was derived from the equal area method used in this paper.
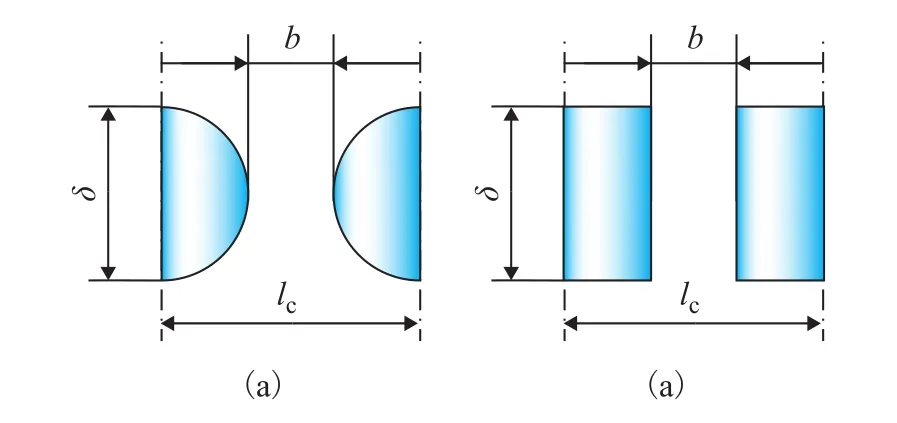
Figure 3 Cross section views of Venturi-rod deck tray (a)and sieve tray (b)
By assuming that the cross section area of Venturi-rod deck is equal to that of one sieve tray as illustrated in Figure 3, the following equation can be obtained.

where δ is the deck thickness, and lcis the distance between two adjacent rods which is written as:

From Equation (4) and Equation (3), the equivalent diameter dεis obtained as shown below.

Since the cylinder rod is used in the Venturi-rod deck tray,δ = d. Then Equation (5) is changed to:

3 Results and Discussion
3.1 The flow regimes on the Venturi-rod deck tray
The dependence of pressure drop across the tray ΔPvon the superficial air velocity VGis shown in Figure 4. It can be seen from Figure 4 that ΔPvincreases with VGfor all the curves. Besides, at the same VG, a greater ΔPvis obtained at a higher spray density Lp.
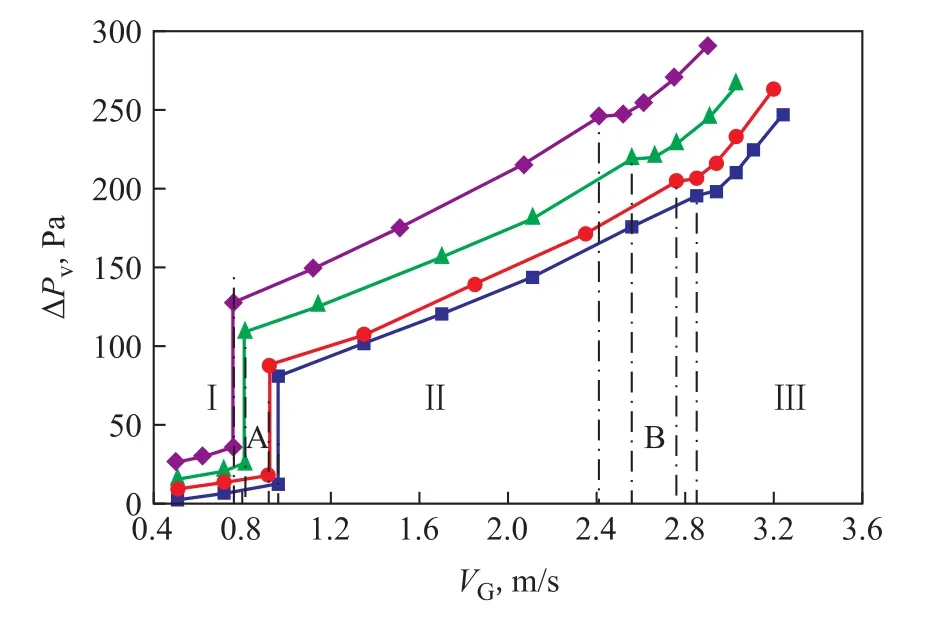
Figure 4 The dependence of pressure drop on air velocity(on #2 tray)
Under the same Lp, the variation of ΔPvcan be divided into three stages. By taking the curve for LP= 3.11 m3/(m2·h)as an example, ΔPvincreases gradually with a curve slope of 21.2 in the range of VG= 0.51—0.96 m/s (Stage I),while a sudden growth of ΔPvoccurs after VG= 0.96 m/s.Then ΔPvrefreshes the continuous variation tendency with a curve slope of 63.9 until VG= 2.85 m/s (Stage II),where a curve inflection point is identified, after which ΔPvincreases with a polynomial variation tendency (Stage III).
The variation of ΔPvis related to the flow regime on the tray as illustrated in Figure 5, in which the green color denotes the liquid phase and the pink color denotes the gas phase.
1) At stage I, the air velocity is low, water fails to be held on the tray, but flows downward through the gaps of the rod deck. The liquid is in the wetting flow regime and the mass transfer between the gas-liquid phases only happens in the liquid film. The efficiency at this stage is low as the residence time of liquid on the deck is too short.

Figure 5 Flow regimes on the Venturi-rod deck tray at different stages:(a) wetting flow regime; (b) froth flow regime; and (c) spray flow regime
2) At stage II, the liquid layer is formed, which is accompanied by the air going through this layer,resulting in a violent turbulent flow on the deck.Owing to the viscous flow resistance, the air velocity decreases to form dispersed froth in the liquid layer.The froth flow regime at this stage is characterized by the break and regeneration of the froth in the liquid layer, which accounts for the high mass transfer efficiency. Therefore, this stage is considered as the favorable operating range for the tray. Being consistent with the variation of ΔPv, the appearance of the liquid layer is detected in a sudden manner. This fact implies that there exists one critical air velocity for the flow regime transformation, which can be referred to as the‘froth air velocity’.3) As the air velocity increases, the gas holdup in the liquid layer increases and the height of the froth increases. When the air velocity arrives at point B in the curve offigure 4, the gas holdup outweighs the liquid holdup and the continuous liquid layer vanishes.At stage III, the mixture flow is observed to fluctuate seriously on the deck. Due to the Venturi effect, the liquid flowing downward exerts a high shear stress on gas at the throat of the rod deck and is converted to tiny droplets, which are then entrained upward by the air to form the spray flow regime. Similarly,the air velocity for the transformation of spray flow regime is referred to as the ‘spray air velocity’. For the multilayer tray scenario, the spray entrainment could result in the accumulation of liquid on the upper tray,which can contribute to an extra air flow load. Even though the mass transfer efficiency at this stage is comparable with that at stage II, it is undesirable as the pressure drop across the tray is high.
At a spray density Lpof 3.11 m3/(m2·h), the froth air velocity (point A) and the spray air velocity (point B)are 0.96 m/s and 2.85 m/s, respectively, indicating to a turndown ratio f = 2.97. As the spray density increases from 3.11 m3/(m2·h) to 7.79 m3/(m2·h), the froth air velocity and the spray air velocity decrease from 0.96 m/s and 2.85 m/s to 0.76 m/s and 2.41 m/s, respectively, while the turndown ratio increases from 2.97 to 3.17. This can happen because at higher spray density, the fluid is more easily to contact with the air to form froth on the deck.For a practical scrubber, the liquid or slurry flow rate usually changes due to various factors. Higher turndown ratio can make the tray work in a wider and stable operating range.
3.2 The influence of structure parameters on hydrodynamic characteristics
For the Venturi-rod deck tray, the structure parameters of rod diameter, rod gap width and voidage are interrelated.Given the two arbitrary parameters, the other one can be determined. Therefore, in this paper, the rod gap and voidage are used to evaluate the influence of the structure parameters on hydrodynamic characteristics.

Figure 6 The influence of voidage on hydrodynamic characteristics
The variation of ΔPvvalue with VGfor three trays with different voidage is shown in Figure 6. At the same air velocity, higher pressure drop is observed for lower voidage of the tray. With the voidage increasing from 15.2% to 22.6%, the froth air velocity and spray air velocity increase from 0.66 m/s and 2.33 m/s to 0.92 m/s and 2.76 m/s, respectively. The corresponding turndown ratio drops from 3.53 to 3.00. Under the condition of lower voidage, the net area for the air flow is smaller. The air velocity through the rod gap is higher at the same superficial velocity, which contributes to greater hydrodynamic load. Therefore,the falling liquid can be more easily held on the deck to form froth. As a higher air velocity also causes larger friction force with the rod walls, the pressure drop of the tray is higher.
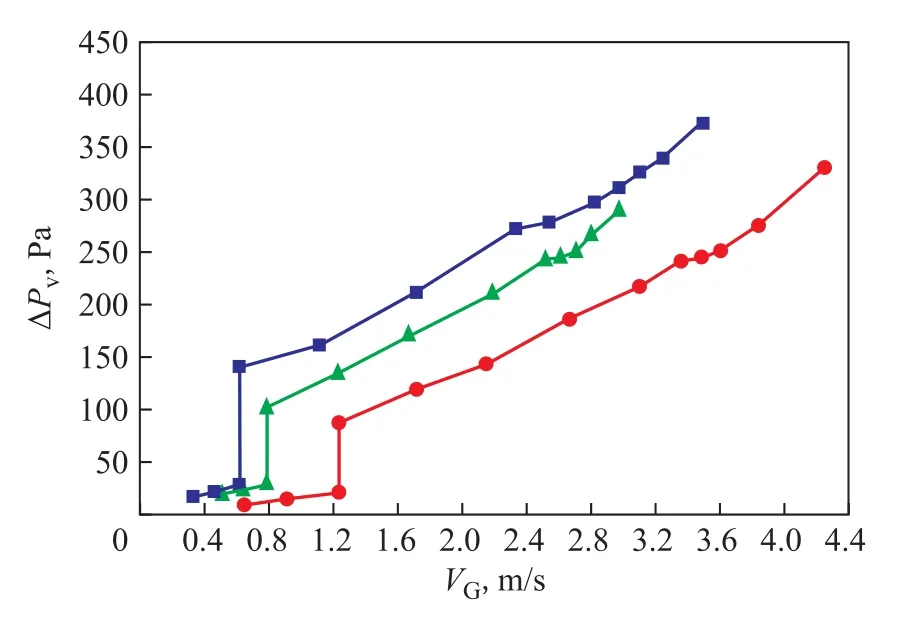
Figure 7 The influence of rod gap on hydrodynamic characteristics
Figure 7 shows the VG-ΔPvrelation curves for three trays with a same voidage of 19.4 % and different rod gap of 2 mm (#1 tray), 3 mm (#3 tray) and 4 mm (#5 tray),respectively. It can be seen from the graphs that the froth air velocity and the spray air velocity both increase with the rod gap. At the same air velocity, the pressure drop is higher for the tray with narrower gap. When the tray gap increases from 2 mm to 4 mm, the turndown ratio decreases from 3.77 to 2.71.
3.3 Forth layer pressure drop calculation
As the froth flow regime is an operating region with high efficiency, the correlation formula for the pressure drop of the tray in this region is helpful for practical application.Previous studies have revealed that the pressure drop across the tray can be written as[24]:

ΔPdis the pressure drop of dry tray (without spray),which is proportional to the kinetic energy of gas.

where ρgis the gas density, vsis the air velocity through the rod gap, and ξ is the pressure drop coefficient. In this paper, ΔPdis tested and the dimensionless analysis method is adopted to obtain a correlation function for ξ.


ΔPσis the pressure drop arising from liquid surface tension σland can be calculated as:

ΔPfis the froth layer pressure drop and can be written as:

where A is the correlation coefficient associated with the hydrodynamic parameters of the liquid and the air. The correlation coefficient A can be expressed as a function of several hydrodynamic dimensionless quantities as shown below:

in which σBand µBare the liquid surface tension and viscocity at 20 °C, respectively.
The value of ΔPvcan be obtained from experiments (as shown in Figure 4, Figure 6 and Figure 7). By subtracting ΔPσand ΔPdfrom ΔPvin Equation (7), the value of ΔPfcan be obtained. By substituting the corresponding values into Equation (11), the value of C1, C2, C3 and C4 can be con firmed as 0.37, 0.2, 1.0 and 0.22, respectively. It is worth mentioning that these coefficients are based on the air-water system. For other systems, the values of C1 to C4 are different.
3.4 The height offroth layer
The froth layer height is a significant factor that can affect the tray performance. For a multilayer tray scrubber, the height of the froth layer should also be considered for designing the tray spacing.

Figure 8 The dependence of froth layer height on superficial air velocity (#4 tray)
Figure 8 shows the variation of froth layer height h with VGunder different spray density values. It is indicated that h increases with an increasing VG, which is attributed to the higher hydrodynamic load at greater air velocity. Enhancing the spray density can also lead to the increase of h. This can occur because more liquid contacts with the air to enhance the froth formation under this situation.
Upon considering the hydrodynamics and tray structure parameters, the correlation formula for h can be written as follows.

where Δρgis the gas phase density, D1 and D2 are two formula coefficients and can be determined to be 0.75 and 5.52, respectively, from the experimental data.
3.5 Comparison between Venturi-rod deck tray and sieve tray
The pressure drop values ΔPdand ΔPvof Venturi-rod deck tray are compared with sieve tray having a similar voidage, with the results shown in Figure 9.
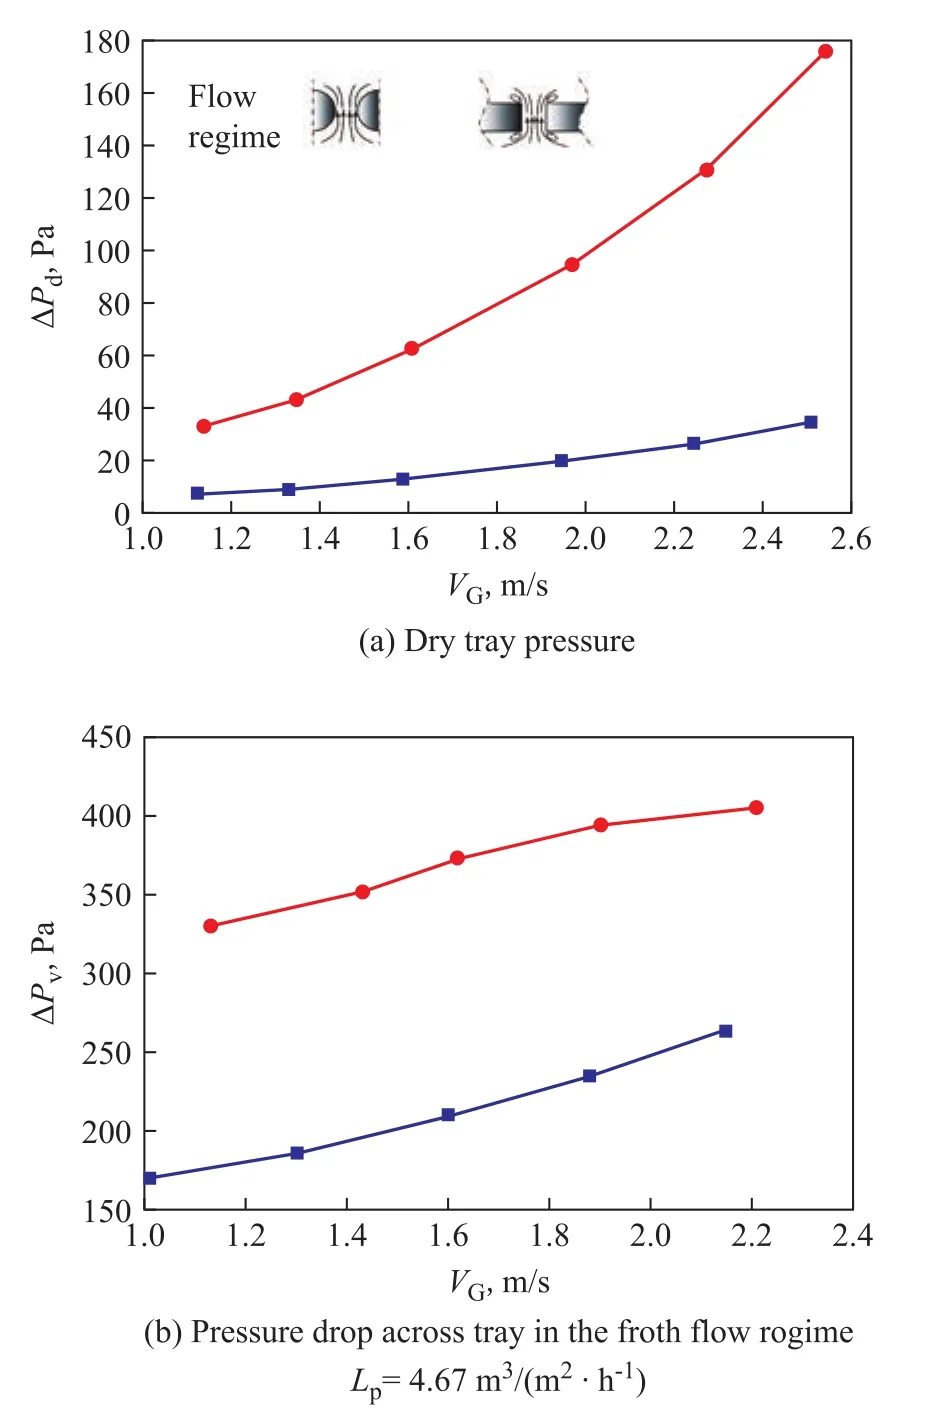
Figure 9 Comparison of pressure drop between Venturirod deck tray and sieve tray:
The ΔPdof the Venturi-rod deck is by 26~132 Pa lower than that of sieve tray and the pressure difference increases with the air velocity. This could be attributed to the slot configuration. In the sieve tray because of the sudden contraction and expansion of the cross section the flow separation occurs near the slot inlet and exit, respectively. The airflow velocity sharply increases and then decreases in the slot,with stagnation flow zones being generated at both sides. According to the Bernoulli’ equation, the local pressure in the stagnation flow zone is higher than the main flow and thereby can result in a severely reverse flow, which can add to the hydrodynamic resistance to the air flow. However, for the Venturi-rod deck tray,the flow velocity transition is smooth owing to the continuously curved structure of the slot. Therefore,the pressure drop through the Venturi-rod deck tray is lower than the sieve tray. It can be seen from Figure 9(b) that the ΔPvdifference between two trays becomes more obvious. ΔPvin the Venturi-rod deck tray only constitutes 50%—67% of that in the sieve tray.Therefore, the air load can be more effectively used to overcome the liquid resistance. Since the kinetic energy of the air flow is supplied by external fluid machine, the low pressure drop of the Venturi-rod deck tray demonstrates its advantage in the energy saving potential. The turndown ratio of #1 tray and sieve tray is 2.137 and 1.956, respectively, with the former being by 9.2% higher than the latter. This indicates that the Venturi-rod deck tray has higher flexibility, which is more adaptable to the change of operating parameters.
4 Industrial Scale up Practice
The scale up practice is based on the FGD (flue gas desulfurization) process tested in a 35 t/a coal burning boiler at the Zhongjie Petrochemical Group Co., Ltd. The composition of flue gas vented from the boiler outlet is listed in Table 3.
According to local air effluent standard, the SO2concentration should be restricted to less than 100 mg/m3. The FGD process adopts the wet ammonia desulphurization method. The Venturi-rod deck trays are applied in the FGD scrubber, which has a diameter of 3.1 m and a height of 15.2 m. The flue gas flows into scrubber and contacts with the slurry spray at a liquid/gas ratio of 1:2 L/m3. During the FGD process,the effluent gas from the FGD scrubber is sampled and tested. A part of the results are listed in Table 4. It is shown that the overall desulfurization efficiency ηsis above 93% coupled with a simultaneous denitration efficiency ηnof above 55% and a small pressure drop (below 1 200 Pa). It should be noted that these operational results were obtained under a relatively low liquid/gas ratio. The desulfurization efficiency could still be improved with the increase of liquid/gas ratio and the optimization of other operating parameters.

Table 3 The composition of flue gas
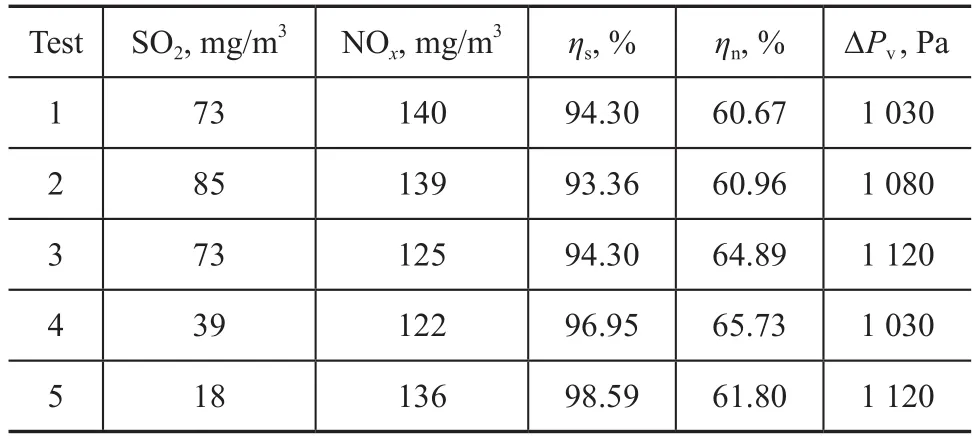
Table 4 The composition of effluent gas
5 Conclusions
The pressure drop across the Venturi-rod deck tray and the limit air velocity (referred as ‘froth air velocity’and ‘spray air velocity’ in this paper) for the flow regime transformations were experimentally studied.The turndown ratio of the tray was determined with the limit air velocity. The influence of structure parameter on the hydrodynamic characteristics of the Venturi-rod deck tray was analyzed. To facilitate the practical application, correlation formulas for the pressure drop of the tray and the height of the forth layer were fitted. Results shows that three distinct flow regimes, i.e., the wetting flow regime, the forth flow regime, and the spray flow regime were observed on the tray with the increase of the airflow velocity. The turndown ratio of the Venturi-rod deck tray was in the range of 2.71—3.77 and decreased with an increasing tray gap. As the wall of the gas flow passage is a continuously curved structure,the pressure drop of the Venturi-rod deck tray is by more than 50% lower than that of sieve tray, with the turndown ratio of the former being 9.2% higher than that of the latter. This fact demonstrates the better energy saving performance and wider operating range of the Venturi-rod deck tray than the sieve tray.
Acknowledgment: The financial support from the Science Fundation of China University of Petroleum, Beijing(No.2462106 YJRC026), and the SINOPEC project fund(No.109119) is gratefully acknowledged.
[1] Domingues T L, Secchi A R, MendesT F. Overall efficiency evaluation of commercial distillation columns with valve and dualflow trays[J]. AIChE Journal, 2010,56(9): 2323-2330
[2] Lei Z, Li C, Chen B. Extractive distillation: A review[J].Separation & purification Reviews, 2003, 32(2): 121-213
[3] And JAG, Fair J R. A fundamental model for the prediction of distillation sieve tray efficiency. 2. Model development and validation[J]. Ind Eng Chem Res, 2000, 39(6): 1809-1817
[4] Mayer F D, Feris L A, Marcilio N R, et al. Review of hydraulics correlations for sieve trays without downcomers[J]. Ind Eng Chem Res, 2014, 53(20): 8323-8331
[5] Billet R. Separation tray without downcomers[J]. Chemical Engineering & Technology, 2001, 24(11): 1103-1112
[6] Kolmetz K, Ng W K, Lee S H, et al. Optimize distillation column design for improved reliability in operation and maintenance[J]. Asia-Pacific Journal of Chemical Engineering, 2007, 2(4): 294-307
[7] Maller G, Hollinden J. Status of flue gas desulfurization(FGD) technology[C]. Proceedings of the APEC Seventh Technical Seminar on Clean Fossil Energy, 2000
[8] Xu Z P, Afacan A, Chuang K T. Efficiency of dualflow trays in distillation[J]. The Canadian Journal of Chemical Engineering, 1994, 72(4): 607-613
[9] Kister H. Distillation Design[M]. New York: McGraw-Hill, 1992: 710
[10] Li Q, Lun L, Zhang M, et al. Modeling flow-guided sieve tray hydraulics using computational fluid dynamics[J]. Ind Eng Chem Res, 2014, 53(11): 4480-4488
[11] Li Y, Wang L H, Yao K. New technique for measuring fluid flow patterns on a multiple downcomer tray[J]. Ind Eng Chem Res, 2007, 46(9): 2892-2897
[12] Rahimi R, Sotoodeh M M, Bahramifar E. The effect of tray geometry on the sieve tray efficiency[J]. Chemical Engineering Science, 2012, 76: 90-98
[13] Zhang L H, Li Z J, Yang N, et al. Hydrodynamics and mass transfer performance of vapor-liquid flow of orthogonal wave tray column[J]. Journal of the Taiwan Institute of Chemical Engineers, 2016, 63: 6-16
[14] Zarei A, Hosseini S H, Rahimi R. CFD and experimental studies of liquid weeping in the circular sieve tray columns[J]. Chem Eng Res Des, 2013, 91(12): 2333-2345
[15] Malvin A, Chan A, Lau P L. CFD study of distillation sieve tray flow regimes using the droplet size distribution technique[J]. Journal of the Taiwan Institute of Chemical Engineers, 2014, 45(4): 1354-1368
[16] Rylek M, Kaštánek F. Pressure drop of foam bed on grid trays[J]. Collection of Czechoslovak Chemical Communications, 1972, 37(1): 254-262
[17] Jiang B, Liu P, Zhang L, et al. Hydrodynamics and mass-transfer analysis of a distillation ripple tray by computational fluid dynamics simulation[J]. Ind Eng Chem Res, 2013, 52(49): 17618-17626
[18] Baten J M V, Krishna R. Modelling sieve tray hydraulics using computational fluid dynamics[J]. Chemical Engineering Journal, 2000, 77(3): 143-151
[19] Garcia J A, Fair J R. Distillation sieve trays without downcomers: Prediction of performance characteristics[J].Ind Eng Chem Res, 2002, 41(6): 1632-1640
[20] Ali M, Yan C Q, Sun Z N, et al. CFD simulation of dust particle removal efficiency of a Venturi scrubber in CFX[J].Nuclear Engineering and Design, 2013, 256: 169-177
[21] Guerra V G, Béttega R, Gonçalves J a S, et al. Pressure drop and liquid distribution in a Venturi scrubber:Experimental data and CFD simulation[J]. Ind Eng Chem Res, 2012, 51(23): 8049-8060
[22] Carletti C, Blasio C D, Mäkilä E, et al. Optimization of a wet flue gas desulfurization scrubber through mathematical modeling of limestone dissolution experiments[J]. Ind Eng Chem Res, 2015, 54(40): 9783-9797
[23] Pourmohammadbagher A, Jamshidi E, Aleebrahim H, et al. Study on simultaneous removal of NOx and SO2with NaClO2in a novel swirl wet system[J]. Ind Eng Chem Res,2011, 50(13): 8278-8284
[24] Bennett D L, Agrawal R, Cook P J. New pressure drop correlation for sieve tray distillation columns[J]. AIChE Journal, 1983, 29(3): 434-442
date: 2017-03-31; Accepted date: 2017-06-13.
Professor Sun Guogang, Tel. & Fax:+86-10-89734820; E-mail: ggsunbj@163.com.
杂志排行
中国炼油与石油化工的其它文章
- Thermal Decomposition Behavior of Terephthalate in Inert Gas
- Molecular Simulation of Competitive Adsorption on Fe(110) Between Gasoline Detergent and Deposit: I. Physical Adsorption
- Characterization and Apparent Kinetics of Polymerization of 1-Decene Catalyzed by Boron Trifluoride/Alcohol System
- Preparation of Cu-, Zn-, Co-Zeolites and Application for Adsorptive Desulfurization of Saudi Arabian Medium Crude
- Study on Con fined Impinging Jet Mixer and Mechanism offlash Nanoprecipitation
- Antimicrobial Degradation Performance of Novel Polyacrylamide Derivatives by Microbial Consortia for Enhanced Oil Recovery
