Change Detection in Synthetic Aperture Radar Images Based on Fuzzy Restricted Boltzmann Machine
2017-10-11NaLiJiaoShiandYuLei
Na Li, Jiao Shi, and Yu Lei
ChangeDetectioninSyntheticApertureRadarImagesBasedonFuzzyRestrictedBoltzmannMachine
Na Li, Jiao Shi*, and Yu Lei
Image Change Detection is a process to identify the changes of two images of the same scene that were taken in different times. In this paper, we propose a novel change detection approach based on Fuzzy Restricted Boltzmann Machine (FRBM). In order to adapt to the network structure of FRBM, we made some adjustments to the original Back Propagation (BP) and obtained the so-called Fuzzy Back Propagation (FBP). The proposed approach applies FRBM as unsupervised feature learning algorithm and FBP as supervised fine-tuning algorithm to train data. The feature of FRBM is the parameters controlling the model that are replaced by fuzzy numbers. FRBM applied to change detection which can reduce the effect of speckle noise in Synthetic Aperture Radar Images (SAR) and has better representation capability than traditional RBM. Experiments on real data sets and theoretical analysis show that the proposed method can obtain promising results and outperforms some other methods.
Fuzzy Restricted Boltzmann Machine (FRBM); image change detection; Synthetic Aperture Radar (SAR) image
1 Introduction
Image Change Detection is a technology to analyze and identify the change of surface qualitatively or quantitatively from multi-temporal images of the same scene but taken at different time. This technology is important and widely used in some fields, such as for resources and environment monitoring, it can monitor land utilization rate and land cover situation, forest and vegetation coverage and the situation of urban expansion. For agricultural survey, it can update the geographical spatial data timely to know the crop conditions of a particular geographical area. It also plays a great role in military field and the monitoring and evaluation of natural disaster[1].
Since SAR sensor has special image-forming principle and imaging capabilities of all-weather and all-time, SAR images have become popular in image change detection. Due to microwave imaging and pretty complex background information, however, the most prominent trouble for a change detection in single-polarization SAR images is the presence of the speckle noise[1]. At present, that is the most difficult problem in SAR image processing. And there are many methods to solve this problem, such as Markov Random Field FCM (MRFFCM)[2], Reformulated Fuzzy Local Information C-means (RFLICM)[3], etc. Change detection in SAR images has classical three-step process including (1) pre-processing, (2) producing a Difference Image (DI) between the multi-temporal images, (3) analyzing the DI[4]. Producing a DI and analyzing DI are the key research direction in change detection in SAR images, whose main difficulty is to reduce the effect of speckle noise. In respect of producing a DI, in order to reduce the impact of speckle noise, some classical methods have been proposed such as Log-ratio (LR)[5], Mean-ratio (MR)[6], Combined Difference Image (CDI)[7], Neighborhood-based Ratio (NR)[8], Wavelet Fusion (WF)[9], etc. The methods to analyze the DI fall into four major categories including thresholding based methods such as Generalized Kilter & Illingworth (GKI)[10], Locally Fitting and Semi-EM(LF&SEM)[11], clustering based methods such as Fast Generalized Fuzzy C-means (FGFCM)[12], Fuzzy Local Information C-means (FLICM)[13], Reformulated Fuzzy Local Information C-means (RFLICM)[3], and Markov Random Field FCM(MRFFCM)[2], graph-cut based methods such as Generalized Gaussian Segmentation (GC_GG)[14]and Local Fit-search and Kernel-induced Graph Cut (LFS&KGC)[15], level set methods such as CV model[16], Region-scalable Fitting (RSF)[17], and Multiresolution Level-set (MLS)[18].
As mentioned above, algorithms about change detection in SAR images have developed well. In spite of this, existing algorithms have the shortcoming of restraining speckle noise with the loss of image details, which leads to that the result of change detection is not very accurate. However, the development of neural networks has aroused our concern and it seems increasingly obvious that neural network can be applied to image processing. In this paper, we will apply the representation ability of neural networks to learn the characteristics of the images in order to better achieve the change detection.
Neural networks are used in image processing field as pattern recognition classifier and clustering technology originally. Along with the further research, neural networks are fully applied to various fields. In addition, Gong et al. proposed a novel framework for image change detection based on deep neural networks in[19], and the method of this paper is based on this framework.
In this paper, in view of the necessity to reduce the effect of speckle noise and good representation capability of FRBM, we try to use FRBM to learn the representation of the relationships between two images. The proposed algorithm mainly includes three parts as follows: (1) data preprocessing; (2) neural network training; (3) using the trained neural network for identifying changed and unchanged regions between two images.
This paper is organized into four sections. In section II, the proposed method will be described in detail. Section III will present the experimental results on real multi-temporal SAR images to verify the feasibility of the method. Finally, the conclusion is drawn in Section IV.
2 Methodology
Let us consider two co-registered intensity SAR images with the same sizeA×Bacquired over the same scene at different timet1andt2, respectively,I1={I1(i,j),1≤i≤A,1≤j≤B} andI2={I2(i,j),1≤i≤A,1≤j≤B}. They are applied to change detection. Both have different levels of speckle noise. The rangeXof a set ofNview speckle noise follows the following condition[20]

(1)
which is theNconvolution Rayleigh distribution whose parameter isσ. The speckle noise is multiplicative and impacts on the interpretation of SAR images seriously. Especially, for the change detection in SAR images, because of the contradiction between reducing the effect of speckle noise and retaining the details, it is quite difficult to estimate the statistics item about the changed and unchanged regions and carry out the change detection accurately.
The change detection problem is to design a method to find the change between these two images. Fig.1 shows the change detection problem.
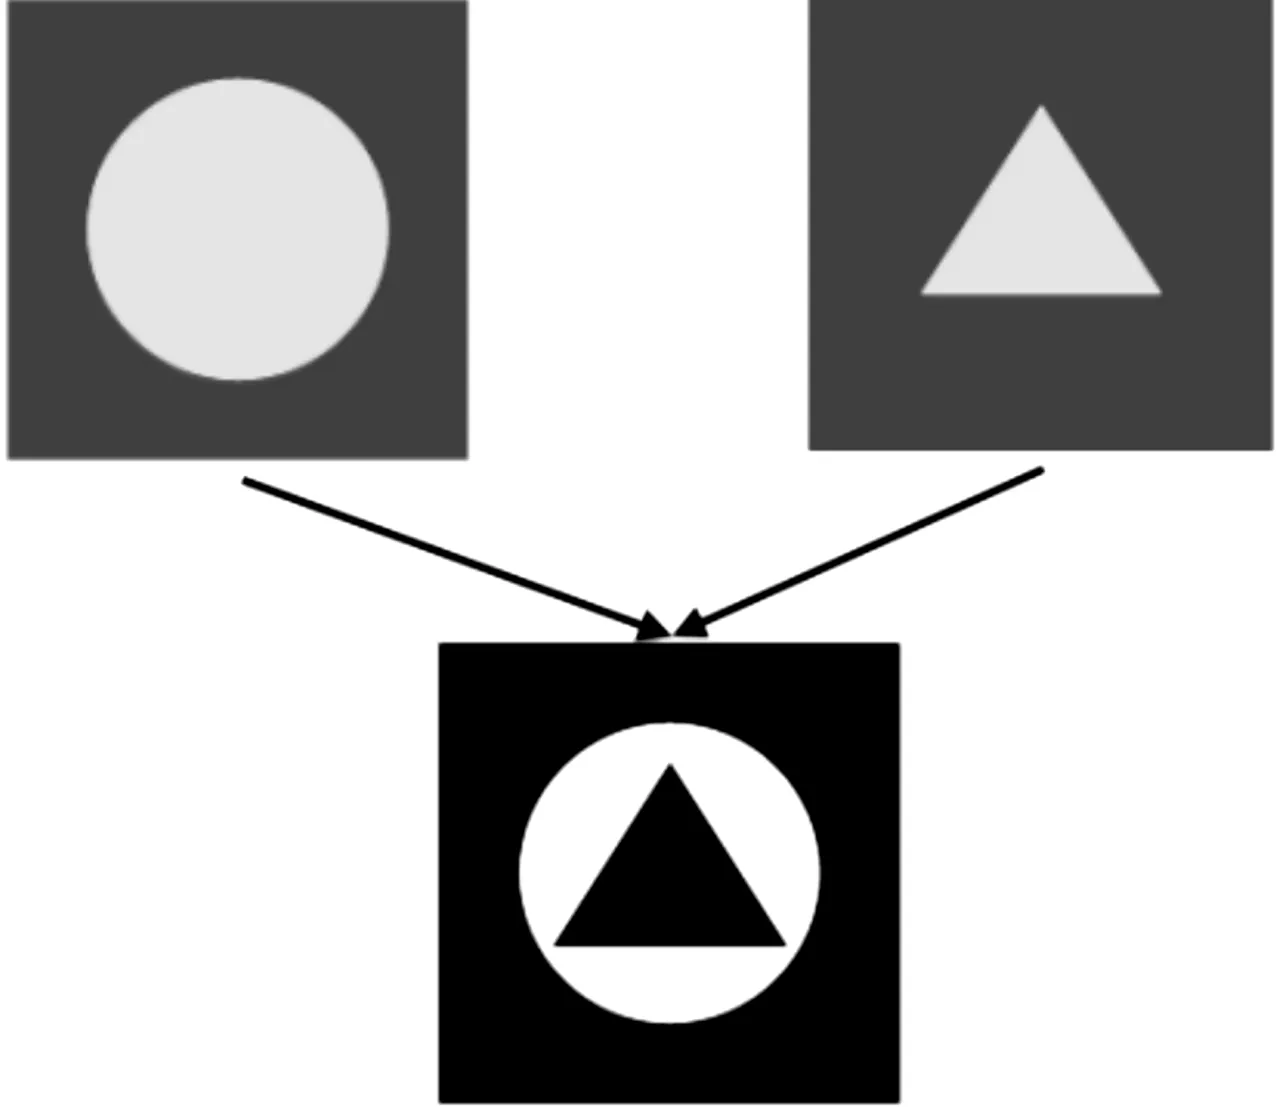
Fig.1 Change detection problem.
In this paper, the proposed method has three steps: (1) data preprocessing including data pre-classification and training sample selection; (2) neural network training including unsupervised learning and fine-tuning network; (3) identifying changed and unchanged regions between two images. Fig.2 shows the framework of the proposed method.
2.1 Data preprocessing
In the proposed method, data preprocessing is to obtain training sample and preclassify data of which the result is regarded as an adjustment direction of fine-tuning network. Firstly, a joint classifier based on FCM (JFCM), as a pre-classification[19], is used to the two original images. The result of pre-classification is regarded as rough adjustment direction of training fine-tuning networks. Secondly, in order to reduce the effect of speckle noise, according to the result of pre-classification, selecting appropriate samples from two original images is necessary. The selection criteria as follows:
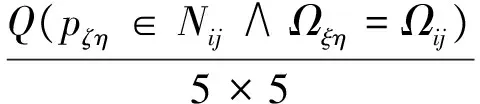
(2)
whereNijis the neighborhood of the pixelpijat the position(i,j) in the pre-classification result map has the labelΩij, and the pointpξηis a pixel at the position (ξ,η) in the neighborhoodNijandQ(pζη∈Nij∧Ωξη=Ωij) means the number of pixels with the label equals toΩijin the neighborhoodNij. The parameterα, which decides whether thepijis chosen as a sample, is very important[19].

Fig.2 Framework of the proposed method.
The selection criterion is to select the pixel of which the label of most pixels in the neighborhood is same with that.
2.2 Neural network training
In the proposed method, the key is to train neural networks. This part is made up of two steps, learning and fine-tuning.
2.2.1 Fuzzy RBM
The learning step to learn the representation of the relationships between the two original images is crucial and we use FRBM as the algorithm of the learning network.
The FRBM model, in which the connection weighs and biases between visible and hidden units are the fuzzy numbers, has a rather powerful representation capability and robustness[21]. The fuzzy numbers of the FRBM can reduce the effect of speckle noise in change detection effectively. In addition, the FRBM belongs to unsupervised learning. These means that the FRBM is a good choice. The structure of FRBM is illustrated in Fig.3.

Fig.3 The structure of FRBM.

(3)


Fig.4 Fuzzy number.
The energy function for the original RBM is defined by
E(x,h,θ)=-bTx-cTh-hTWx
(4)
The parameters governing the model are replaced by fuzzy numbers, and the energy function for the FRBM is defined by
(5)

(6)

(7)
For convenience, we only consider a special case, in which fuzzy numbers are degraded into intervals (α=1). The free energy function can be written as

(8)
The fuzzy conditional probabilities of FRBM have following forms:
(9)

(10)
and

(11)

(12)

ΔWL=ε(x(0)·PL(hL(0)=1|x(0))-
xL(1)·PL(hL(1)=1|xL(1)))
(13)
ΔbL=ε(x(0)-xL(1))
(14)
ΔcL=ε(PL(hL(0)=1|x(0))-
PL(hL(1)=1|xL(1)))
(15)
and
ΔWR=ε(x(0)·PR(hR(0)=1|x(0))-
xR(1)·PR(hR(1)=1|xR(1)))
(16)
ΔbR=ε(x(0)-xR(1))
(17)
ΔcR=ε(PR(hR(0)=1|x(0))-
PR(hR(1)=1|xR(1)))
(18)
Whereεis a learning rate[21].
2.2.2 Fuzzy BP
After learning the FRBM, in order to adjust parameters further and adapt to the structure of FRBM, we put the idea of fuzzy number of FRBM into BP, which is called fuzzy BP (FBP). The adjusted network structure of FBP is shown in Fig.5, wherevLandwLcorrespond to the lower bound of parameters of FRBM andvRandwRcorrespond to the upper bound of parameters of FRBM.
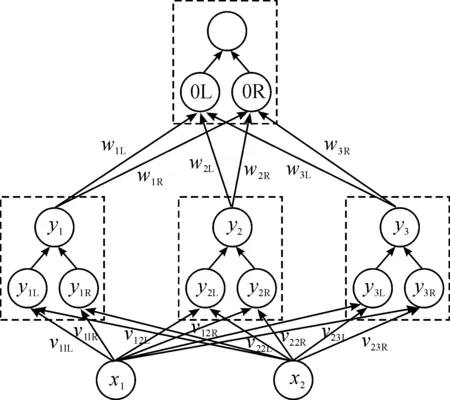
Fig.5 The network structure of FBP.
The hidden layer and output layer of FBP, respectively, is derived as follows:

(19)

(20)
The change in the lower and upper bound of output layer weight of FBP is derived as follows:
(21)
(22)
The change in the lower and upper bound of hidden layer weight of FBP is derived as follows:
(23)
(24)
2.2.3 Training Data
The FRBM is applied to learn the representation of the relationships between the two images, which means that the relationship characteristics of two pixels with the same position in two images, respectively, need to be learned. In the proposed method, the characteristics of a pixel are represented by its neighborhood which hasn×npixels. Thus, each pixel in the image corresponds to a vector ofn2variables. Since it is necessary to study the relationship between two corresponding pixels in two images, each input sample of the neural network is a vector with 2n2pixels in the proposed method.

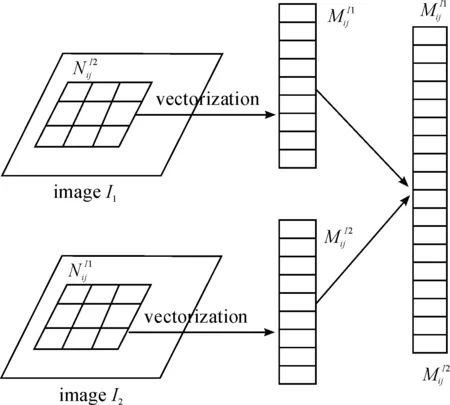
Fig.6 Neural network training.
The major process of neural network training is shown in Fig.7. The network trained in this paper is a five-layer network with three hidden layers and includes three steps: (1) inputting neighborhood features of each position, (2) constructing a stack of FRBM network to learn the representation of the relationships between the two images, (3) fine-tuning neural network by FBP. In these three steps, the most important is the second step, which is an unsupervised feature learning process. According to the feature learned by FBP and the result of pre-classification, the FBP network is to fine tune the network.

Fig.7 Neural network.
After data preprocessing and neural network training, the last part is to organize original data and feed that data into the trained neural network. The network output is a final change map of two images. The class label 0 represents that the pixel belongs to un-changed regions, showing black in change map, and the class label 1 represents the pixel belongs to changed regions, showing white in change map.
3 Experimental Study
In order to assess the effectiveness of the proposed approach, in this section, four data sets are considered in the experiments. We will introduce the comparison experiments as well as some evaluation criteria of the experiment results.
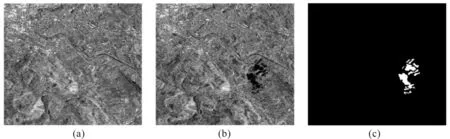
Fig.8MultitemporalimagesrelatingtothecityofBern: (a)ImageacquiredinApril1999beforetheflooding, (b)ImageacquiredinMay1999aftertheflooding,and(c)Groundtruth.
3.1Introductiontodatasets
The first data set, called Bern data set, represents a section (301×301pixels) of two SAR images acquired by the European Remote Sensing 2 satellites SAR sensor over an area near the city of Bern, Switzerland, in April and May 1999, respectively. Between these two dates, the River Aare flooded entirely parts of the cities of Thun and Bern and the airport of Bern. Therefore, the Aare Valley between Bern and Thun was selected as a test site for detecting the flooded areas. The available ground truth (reference image), which was shown in Fig.8 (c), was created by integrating prior information with photo interpretation based on the input images Fig.8 (a) and (b).
The second data set is a section (290×350 pixels) of two SAR images over the city of Ottawa acquired by the Radarsat SAR sensor. They were provided by the Defence Research and Development Canada in Ottawa, Canada. These images were registered by the automatic registration algorithm from A.U.G. Signals Ltd. That is available through the distributed computing at www.signalfusion.com. There are roughly two regions in these images, i.e., water and land. The available ground truth (reference image), i.e., shown in Fig.9 (c), was created by integrating prior information with photograph interpretation based on the input images Fig.9 (a) and (b).
The third data set used in the experiments consisted of two SAR images acquired by Radarsat-2 at the region of Yellow River Estuary in China in June 2008 and June 2009, respectively. The original size of these two SAR images acquired by Radarsat-2 is 7666×7692. They are too huge to show the detailed information in such small pages. We select two repressive areas of size 257×289 pixels [see Fig.10 (a) and (b)] and size 291×306 pixels [see Fig.11 (a) and (b)] to compare the change detection results obtained by different approaches. The available ground truth (reference image), i.e., shown in Fig.10 (c) and Fig.11 (c), was created by integrating prior information with photo interpretation based on the input images Fig.10(a) and (b) and Fig.11 (a) and (b), respectively. It should be noted that these two images considered are single-look image and four-look image, respectively. This means that the influence of speckle noise on the image acquired in 2009 is much greater than the one acquired in 2008. The huge difference of speckle noise level between the two images used may be complicated during the processing of change detection. In the following analysis, the data set in Fig.10 is called Yellow River data set A and the data set in Fig.11 is called Yellow River data set B.

Fig.9MultitemporalimagesrelatingtoOttawa: (a)ImageacquiredinJuly1997duringthesummerflooding, (b)ImageacquiredinAugust1997afterthesummerflooding,and(c)Groundtruth.
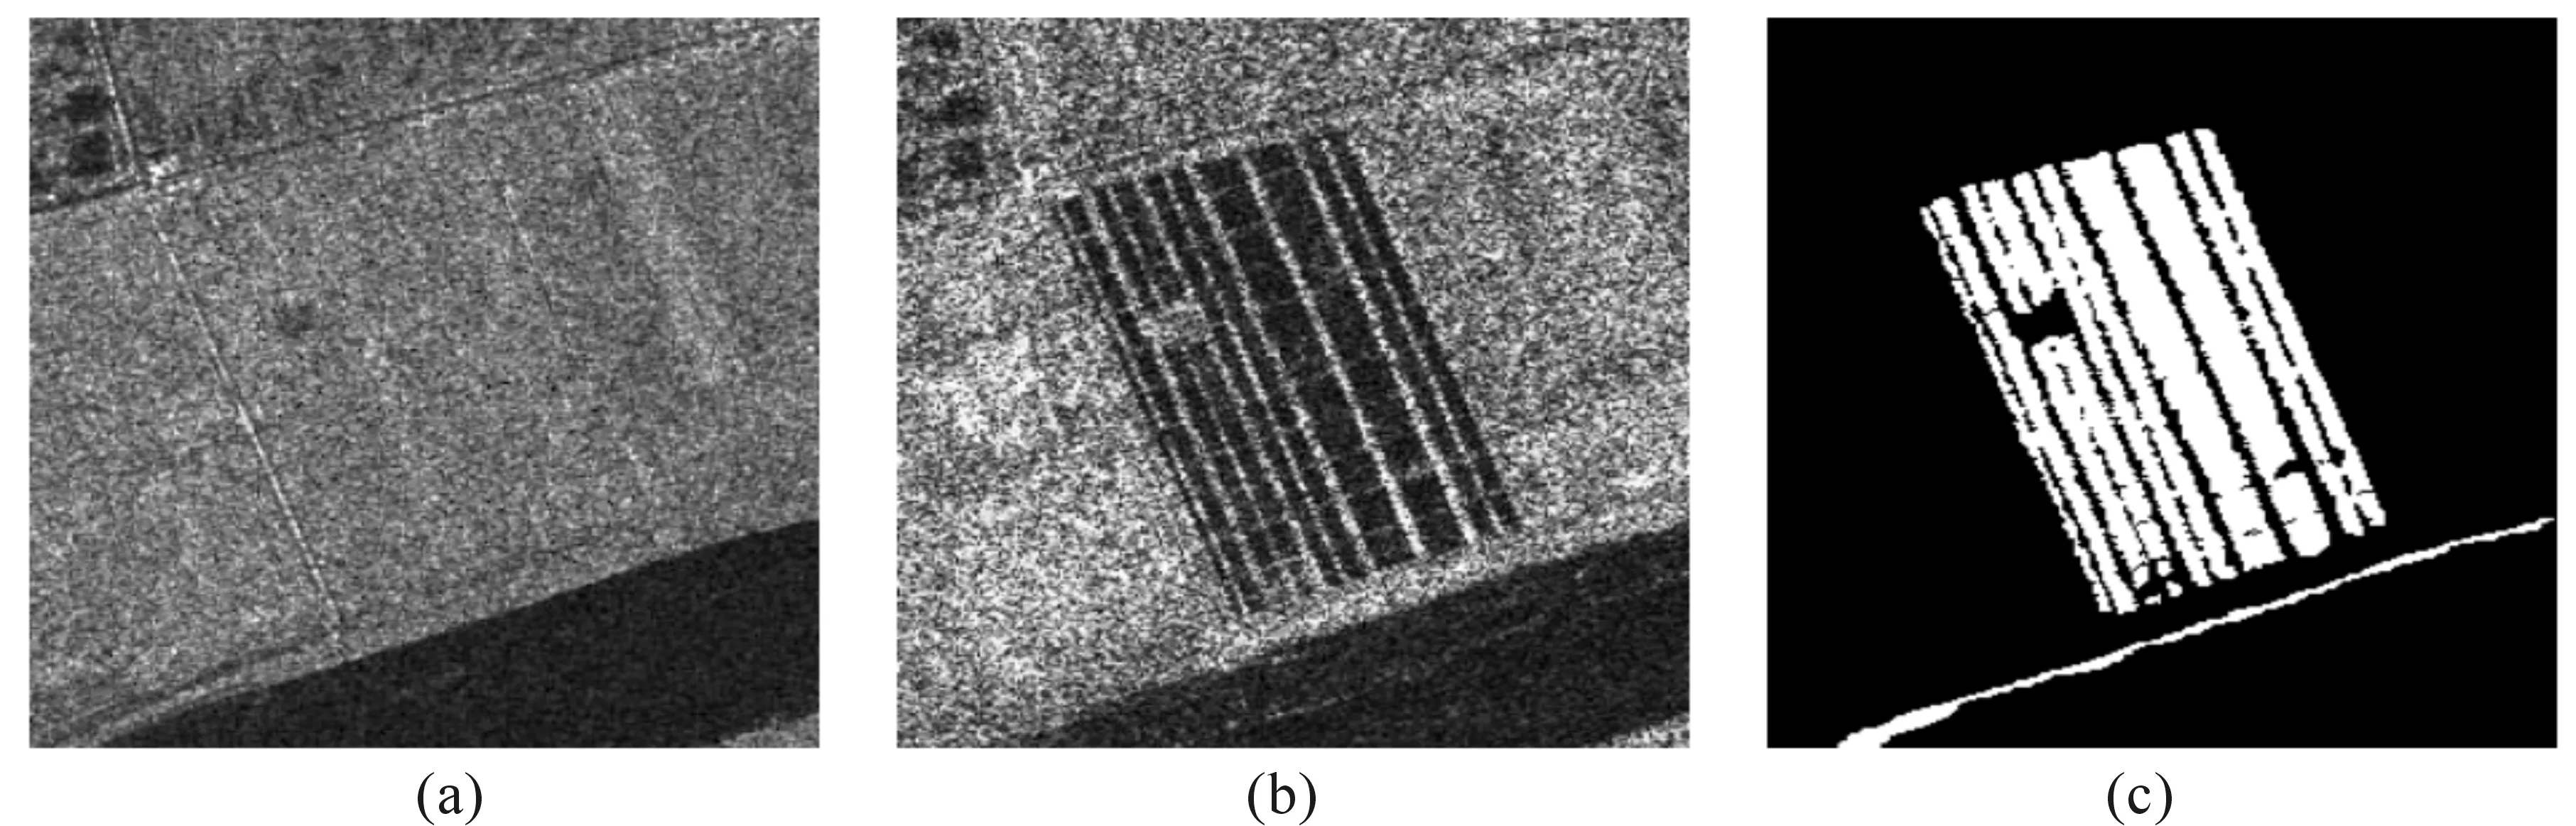
Fig.10MultitemporalimagesArelatingtotheYellowRiverEstuary: (a)ImageacquiredinJune2008, (b)ImageacquiredinJune2009,and(c)Groundtruth.
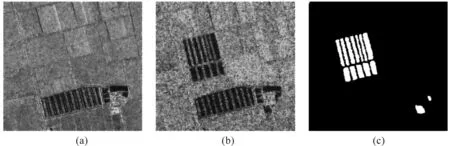
Fig.11MultitemporalimagesBrelatingtotheYellowRiverEstuary: (a)ImageacquiredinJune2008, (b)ImageacquiredinJune2009,and(c)Groundtruth.
3.2Evaluationcriteria
The quantitative analysis of change detection results is set by calculating some values of criteria including: (1) the false negatives (FN, changed pixels that undetected), (2) the false positives (FP, unchanged pixels wrongly classified as changed), (3) Overall error (OE) is the sum of FN and FP, (4) the percent-age correct classification (PCC), and it is given by

(25)
where TP is short for true positives, which is the number of pixels that are detected as the changed area in both the reference image and the result, and TN is short for true negatives, which is the number of pixels that are detected as the unchanged area in both the reference image and the result.
For accuracy assessment, Kappa statistic is a measure of accuracy or agreement based on the difference between the error matrix and chance agreement, which is given by
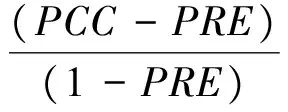
(26)
where

(27)
where Mu and Mc respectively represent the actual number of pixels belonging to the unchanged class and changed class. From Eqs.(25), (26) and (27), it is obvious that the greater the value of PCC and Kappa, the better the change detection result.
3.3Performanceoftheproposedmethod
In this section, the change detection result of four dataset will be discussed. In order to prove the superiority of the proposed, there are some change detection result and evaluation criteria values of other different method as a comparison. The results of experiments about four data sets include the final map in figure form and the criteria in tabular form.
Table1Valuesoftheevaluationcriteriaoftheberndataset.
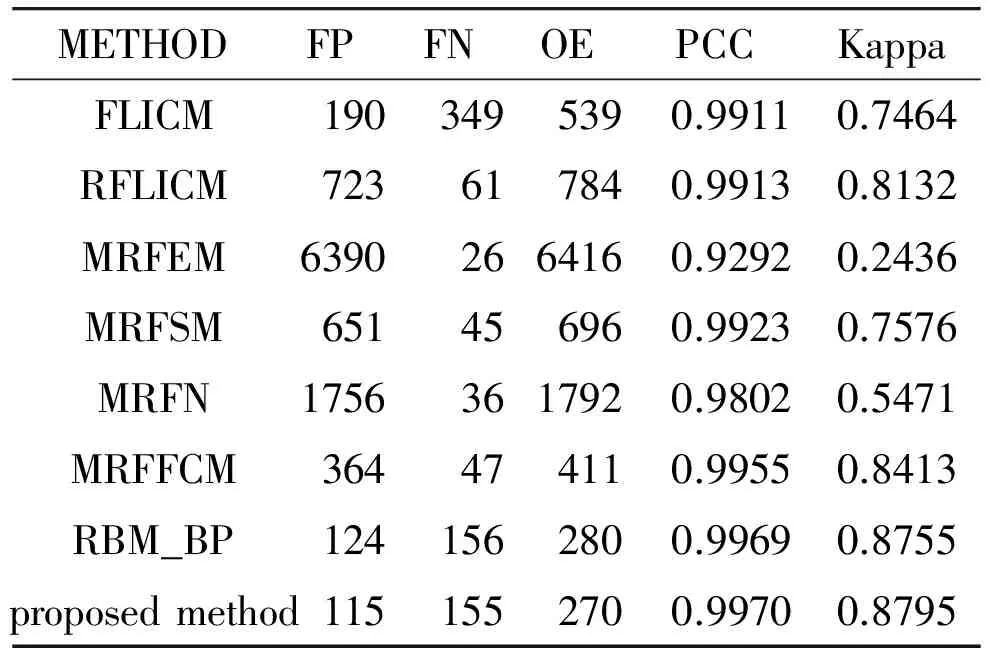
METHODFPFNOEPCCKappaFLICM1903495390.99110.7464RFLICM723617840.99130.8132MRFEM63902664160.92920.2436MRFSM651456960.99230.7576MRFN17563617920.98020.5471MRFFCM364474110.99550.8413RBM_BP1241562800.99690.8755proposedmethod1151552700.99700.8795
3.3.1 Results on the Bern Data Set
The change detection results generated by the proposed method and the seven comparative methods on the Bern data set are presented in Fig.12 and Table 1. The method called RBM_BP is proposed by Gong et al.[19], and the method in this paper is based on that. As shown in Fig.12, the final change detection map generated by RBM_BP and the proposed method is better and has fewer white noise spots than other six methods. That by MRFEM has the most white noise spots among all present methods. From Table 1, the PCC and Kappa yield by the proposed method are 99.70% and 87.95%, respectively, which are both higher than that yield by RBM, 99.69% and 87.55%, respectively. Although the PCC of them approach each other, the Kappa of them, as accuracy assessment, are different significantly. That means the proposed method has a promotion comparing with RBM_BP. In addition, serving as an overall evaluation, PCC and Kappa of the proposed method exhibit best among all the present methods, although FN of it is not best. That means the proposed method for image change detection on the Bern data set is the best comparing with other seven methods.
3.3.2 Results on the Ottawa data set
The results of the experiment on the Ottawa data set are shown and listed in Fig.13 and Table 2. There are eight comparative methods used to verify the superiority of the proposed method. In Fig.13, the final change detection map of the proposed method has little white noise spots comparing with the ground truth shown in Fig.9 (c). However, in Table 2, the FN yield by the proposed method is worse than that by seven methods and is just lower than that by RBM_BP, which means that there are many change pixels undetected by the proposed method. The reason is that the proposed method has a strong ability of reducing the effect of speckle noise so that many isolated and small scale change areas are regarded as noise. In spite of that, the OE is smallest among, because of the small FP. Moreover, the PCC and Kappa yield by the proposed method, 98.13% and 92.82% respectively, is the highest. However, that of RBM_BP are 98.04% and 92.39%. That means not only the proposed method has better than RBM_BP, but also that is the best. This experiment indicates the proposed method for image change detection on the Ottawa data set is the best.

Fig.12ChangedetectionresultsofBerndatasetachievedby(a)FLICM, (b)RFLICM, (c)MRFFCM, (d)MRFEM, (e)MRFSM, (f)MRFN, (g)RBM_BP,and(h)theproposedmethod.

Fig.13ChangedetectionresultsofOttawadatasetachievedby(a)FLICM, (b)RFLICM, (c)MRFFCM, (d)MRFEM, (e)MRFSM, (f)MRFN, (g)GKI, (h)RBM_BP,and(i)theproposedmethod.
Table2ValuesoftheEvaluationCriteriaoftheOttawaDataset.
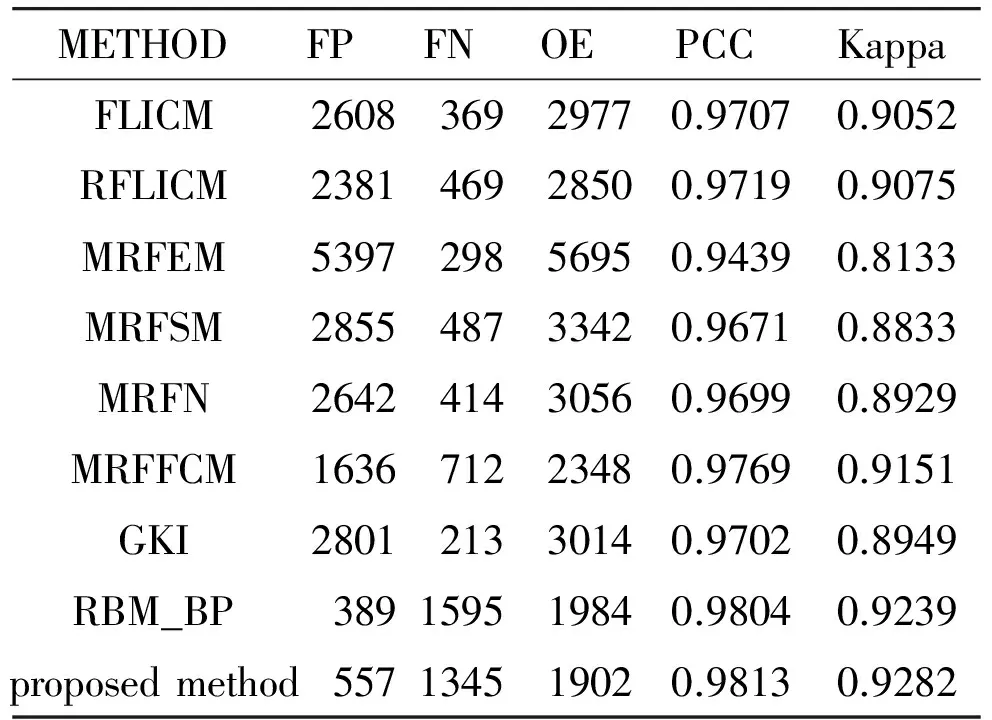
METHODFPFNOEPCCKappaFLICM260836929770.97070.9052RFLICM238146928500.97190.9075MRFEM539729856950.94390.8133MRFSM285548733420.96710.8833MRFN264241430560.96990.8929MRFFCM163671223480.97690.9151GKI280121330140.97020.8949RBM_BP389159519840.98040.9239proposedmethod557134519020.98130.9282
3.3.3 Results on the Yellow River data set
Fig.14 and Fig.15 are the change detection maps of two Yellow River data sets from several different methods. It is worth noting that the speckle noise level of two original of the Yellow River is quite different, which means the change detection about this data set will be more difficult than other data set. In the following, the results of the two data sets will be analyzed separately.
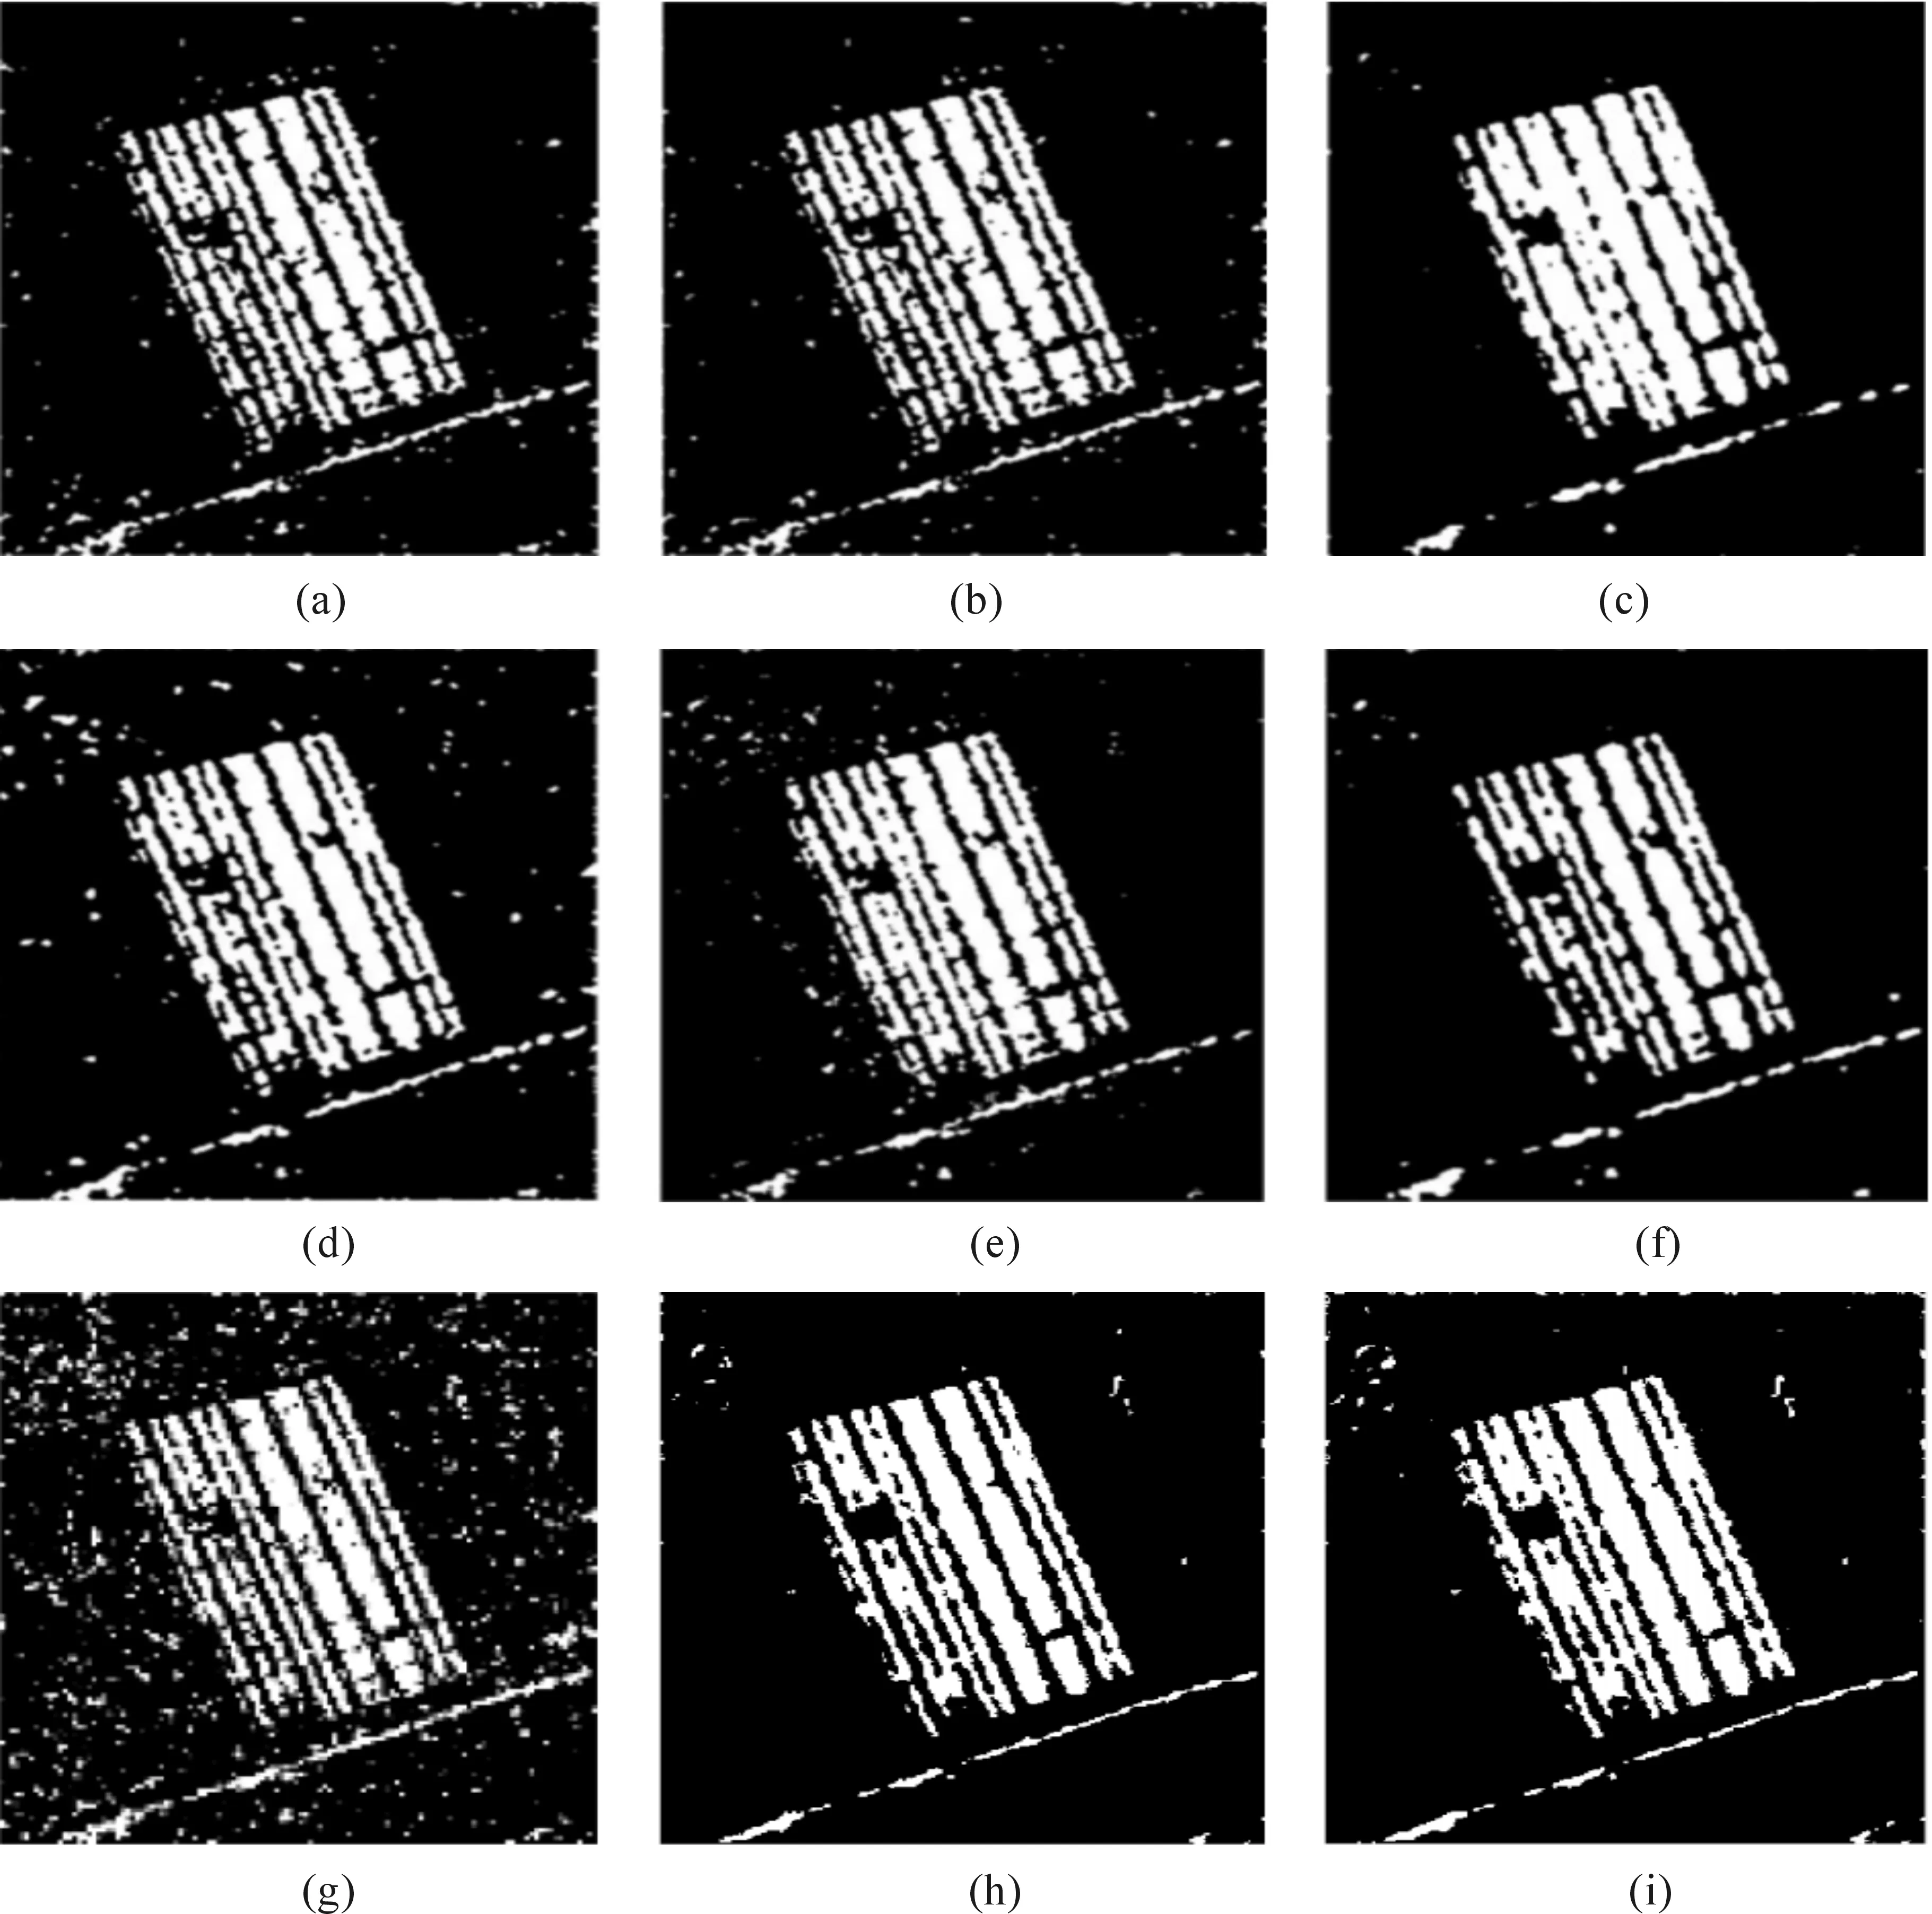
Fig.14ChangedetectionresultsofYellowRiverdatasetAachievedby(a)FLICM, (b)RFLICM, (c)MRFFCM, (d)MRFEM, (e)MRFSM, (f)MRFN, (g)GKI, (h)RBM_BP,and(i)theproposedmethod.
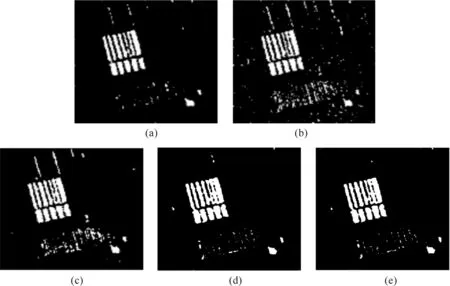
Fig.15ChangedetectionresultsofYellowRiverdatasetBachievedby(a)RFLICM, (b)GKI, (c)MRFFCM, (d)RBM_BP,and(e)theproposedmethod.
Table3ValuesoftheEvaluationCriteriaoftheYellowRiverDatasetA.

METHODFPFNOEPCCKappaFLICM1415295143660.94120.7695RFLICM1261294742080.94330.7741MRFEM2602268752890.90570.7391MRFSM2747264553920.91050.7598MRFN1512165131720.94630.8482MRFFCM1260118224420.96150.8791GKI3884375874620.89650.6535RBM_BP455332237770.94910.8128proposedmethod737252632630.95610.8436
Table4ValuesoftheEvaluationCriteriaoftheYellowRiverDatasetB.

METHODFPFNOEPCCKappaRFLICM47189013610.98460.8568GKI255686434200.96150.6996MRFFCM185247223240.97380.7903RBM_BP70142211230.98660.8819proposedmethod58156411450.98710.8847
For Yellow River Data Set A, from Fig.14, we can see that the maps from MRFEM, MRFSM and GKI method has some white noise spots, which means that these three methods are sensitive to speckle noise. In Table 3, only the value of PCC and Kappa of MRFFCM is higher than that of the proposed method. However, the values of PCC and Kappa of the proposed method are much higher than those of RBM_BP, which means that there is a great improvement from RBM_BP to the proposed method. Nonetheless, the values of PCC and Kappa of the proposed method are not the highest. The reason about that is that the joint classifier, as pre-classification, is sensitive to speckle noise and the network parameters about this data set are not well set. Although the proposed method has some shortcomings and is not the best method for this data set, the proposed method is better than other existing methods in this paper except MRFFCM.
For Yellow River Data Set B, from Fig.15, it is obvious that the final change detection map of the proposed method has fewer white noise spots than that of other three methods comparing with the ground truth shown in Fig.11 (c). In Table 4, the values of PCC and Kappa of the proposed method are much higher than other present methods in this paper. So in this experiment about data set B, the proposed method is the best one among them.
From the above, the proposed method can achieve the change detection on the four data sets well and reduce the effects of speckle noise better than other methods in this paper. That means comparing with other methods, the proposed method based on FRBM is more exceptional.
4 Conclusion
This paper has presented a novel change detection method based on FRBM. Since the rather powerful representation capability and robustness, the FRBM can be applied to learn the representation of the relationships between the two images, which can reduce the effects of the speckle noise effectively. In order to adapt to the structure of FRBM, we put the idea of fuzzy number of FRBM into BP, which is to adjust parameters further. The experiments on the two data sets can demonstrate that the proposed method base on FRBM can achieve change detection well and is more exceptional than other present methods in this paper.
[1]M.G.Gong, L.Su,H.Li, and J.Liu, A survey on change detection in synthetic aperture radar imagery,JournalofComputerResearchandDevelopment,vol.53,no.1,pp.123, 2016.
[2]M.Gong, L.Su, M.Jia, and W.Chen, Fuzzy clustering with a modified mrf energy function for change detection in synthetic aperture radar images,IEEETransactionsonFuzzySystems,vol.22,no.1,pp.98-109, 2014.
[3]M.Gong, Z.Zhou, and J.Ma, Change detection in synthetic aperture radar images based on image fusion and fuzzy clustering,IEEETransactionsonImageProcessing,vol.21,no.4, pp.2141-2151,2012.
[4]L.Bruzzone and D.F.Prieto, An adaptive semiparametric and context-based approach to unsupervised change detection in multitemporal remotesensing images,IEEETransactionsonImageProcessing,vol.11,no.4, pp.452-466,2002.
[5]F.Bovolo and L.Bruzzone, A detail-preserving scale-driven approach to change detection in multitemporal SAR images,IEEETransactionsonGeoscienceandRemoteSensing,vol.43,no.12, pp.2963-2972,2005.
[6]J.Inglada and G.Mercier, A new statistical similarity measure for change detection in multitemporal SAR images and its extension to multiscale change analysis,IEEETransactionsonGeoscienceandRemoteSensing,vol.45,no.5,pp.1432-1445, 2007.
[7]Y.Zheng, X.Zhang, B.Hou, and G.Liu, Using combined difference image and-means clustering for SAR image change detection,IEEEGeoscienceandRemoteSensingLetters,vol.11,no.3,pp.691-695,2014.
[8]J.Ma, M.Gong, and Z.Zhou, Wavelet fusion on ratio images for change detection in sar images,IEEEGeoscienceandRemoteSensingLetters,vol.9, no.6,pp.122-1126, 2012.
[9]M.Gong, Y.Cao, and Q.Wu, A neighborhood-based ratio approach for change detection in SAR images,IEEEGeoscienceandRemoteSensingLetters,vol.9,no.2,pp.307-311,2012.
[10] G.Moser and S.B.Serpico, Generalized minimum-error thresholding for unsupervised change detection from SAR amplitude imagery,IEEETransactionsonGeoscienceandRemoteSensing,vol.44,no.10,pp.2972-2982,2006.
[11] L.Su, M.Gong, B.Sun, and L.Jiao, Unsupervised change detection in sar images based on locally fitting model and semi-em algorithm,InternationalJournalofRemoteSensing,vol.35,no.2,pp.621-650,2014.
[12] W.Cai, S.Chen, and D.Zhang, Fast and robust fuzzy c-means clustering algorithms incorporating local information for image segmentation,PatternRecognition,vol.40,no.3,pp.825-838,2007.
[13] S.Krinidis and V.Chatzis, A robust fuzzy local information c-means clustering algorithm,IEEETransactionsonImageProcessing,vol.19,no.5,pp.1328-1337,2010.
[14] X.Zhang, J.Chen, and H.Meng, A novel SAR image change detection based on graph-cut and generalized Gaussian model,IEEEGeoscienceandRe-moteSensingLetter,vol.10,no.1,pp.14-18,2013.
[15] M.Gong, M.Jia, L.Su, S.Wang, and L.Jiao, Detecting changes of the yellow river estuary via sar images based on a local fit-search model and kernel-induced graph cuts,InternationalJournalofRemoteSensing,vol.35,nos.11&12,pp.4009-4030,2014.
[16] M.Gong, Y.Li, L.Jiao, M.Jia, and L.Su, SAR change detection based on intensity and texture changes,ISPRSJournalofPhotogrammetryandRemoteSensing,vol.93,pp.123-135,2014.
[17] C.Li, C.Y.Kao, J.C.Gore, and Z.Ding, Minimization of region-scalable fitting energy for image segmentation,IEEETransactionsonImageProcessing,vol.17,no.10,pp.1940-1949,2008.
[18] Y.Bazi, F.Melgani, and H.D.Al-Sharari, Unsupervised change detection in multispectral remotely sensed imagery with level set methods,IEEETransactionsonGeoscienceandRemoteSensing,vol.48,no.8,pp.3178-3187,2010.
[19] M.Gong, J.Zhao, J.Liu, Q.Miao, and L.Jiao, Change detection in synthetic aperture radar images based on deep neural networks,IEEETransactionsonNeuralNetworksandLearningSystems,vol.27,no.1, pp.125-138,2016.
[20] J.S.Lee and E.Pottier,Polarimetricradarimaging:Frombasicstoapplications, Boca Raton, FL,USA: CRC Press,2009.
[21] C.L.P.Chen, C.Y.Zhang, L.Chen, and M.Gan, Fuzzy restricted boltzmann machine for the enhancement of deep learning,IEEETransactionsonFuzzySystems, vol.23,no.6,pp.2163-2173,2015.
2016-12-20; received:2016-12-28; accepted:2017-01-20
•Na Li, Jiao Shi, and Yu Lei are with School of Electronics and Information, Northwest Polytechnical University, Xi’an 710072, China. E-mail: linaflydream@mail.nwpu.edu.cn; jiaoshi@nwpu.edu.cn; leiy@nwpu.edu.cn.
*To whom correspondence should be addressed. Manuscript
杂志排行

CAAI Transactions on Intelligence Technology的其它文章
- A Multi-Objective Evolutionary Approach to Selecting Security Solutions
- Fine-grained Image Categorization Based on Fisher Vector
- Second Order Differential Evolution Algorithm
- Automated Test Data Generation Based on Particle Swarm Optimization with Convergence Speed Controller
- A Common Strategy to Improve Community Detection Performance Based on the Nodes’ Property
- Research on Micro-blog New Word Recognition Based on SVM