Transformation mechanism of nutrient elements in the process of biochar preparation for returning biochar to soil☆
2017-05-28ShuangshuangTianZhongxinTanAlfredaKasiulienPingAi
Shuangshuang Tian ,Zhongxin Tan ,*,Alfreda Kasiulienė,Ping Ai
1 College of Resources and Environment,Huazhong Agricultural University,Wuhan 430070,China
2 Waste Science and Technology,Department of Civil,Environmental and Natural Resources Engineering,Luleå University of Technology,SE-97187 Luleå,Sweden
3 College of Engineering,Huazhong Agricultural University,Wuhan 430070,China
1.Introduction
In order to address the challenges of global climate change and to ensure the development of sustainable agriculture,biochar research is becoming increasingly important.Biochar is generated from biomass pyrolyzation under anoxic conditions,has a stable nature and contains more than 50%of carbon[1].Returning biochar to the soil can improve chemical and physical properties of the soil because biochar has intrinsic low viscosity and density,which abates bulk density and promotes soil softness[2–4].In addition,biochar can retain soil moisture,improve aeration and provide carbon,as well as energy and mineral nutrition for microorganisms[5–7].In the long term,biochar returned to the soil can reduce CO2,CH4and N2O emissions[8–10]and also increase fertility through an increase in the biochemical-conversion processes in the soil[11–13].It was also reported that biochar improves absorption in plants,which can promote growth and ripening of crops[14–16].
Although returning biochar to the soil has many bene fits,biochar's reputation has been tainted by the presence of poor quality,commercially produced products.Biochar quality is affected by the following preparation conditions:when the pyrolysis temperature increased from 300 °C to 1000 °C,biochar yield decreased from 50.1%to 26.2%;when the temperature was less than 500°C,biochar N content increased from 1.55%to 1.86%;when the temperature was more than 500 °C,N content decreased to 1.23%[29–31].Mohanty[32]studied the effect of heating rate(450 °C·min−1and 2 °C·min−1)on the biochar nutrient elements(N,P and K)and obtained results,such as the content of N(0.9%of 450 °C·min−1< 0.8%of 2 °C·min−1),the content of P(3.6 g·kg−1of 450 °C·min−1> 3.5 g·kg−1of 2 °C·min−1)and the content of K(76.5 g·kg−1of 450 °C·min−1> 75.5 g·kg−1of 2 °C·min−1).When the pyrolysis gas(5%O2+Ar,5%CO2+Ar)is different,N species in the pyrolysis process are also changed;O2can promote the formation of HCN,NO,and HNCO,while CO2can inhibit the generation of HCN and HNCO[33].To date,few studies on the nutrients generated by biochar preparation have been conducted.In this article,the effects of a N2and CO2atmosphere on the pH,N,P,K and metal elements of biochar were systemically studied in order to provide better theoretical guidance for biochar preparation.
2.Materials and Methods
2.1.Feedstock
Rice straw as raw biomass was obtained from a local farm at the Huazhong Agricultural University,Wuhan,China.
2.2.Experimental setup
Rice straw biochar was prepared using a fluidized bed pyrolysis furnace,as shown in Fig.1.The pyrolysis was performed at nine different temperatures:100 °C,150 °C,200 °C,250 °C,300 °C,350 °C,400 °C,500 °C,and 600 °C,both in CO2and N2atmospheres.In order to complete the reaction,the residence time was 40 min.

Fig.1.Biochar preparation system.
2.3.pH,acid and alkali functional groups and nutrients analysis
pH:the pH of biochar was measured by adding biochar to deionized water in a mass ratio of 1:5.The solution was measured by a pH meter[24].
Acid and alkali functional groups:Acid and alkali functional groups of biochar samples were determined using the Boehm's titration method:(1)A dried biochar sample(0.5 g)was mixed with 50 ml of a 0.05 mol·L−1solution of NaOH,which neutralizes all acidic groups including carboxyl,lactonic and phenolic groups;(2)A dried biochar sample(0.5 g)was mixed with 50 ml of a 0.1 mol·L−1solution of HCl,which neutralizes all basic groups including ketonic,pyronic,and chromenic groups;(3)The suspensions of biochar samples were shaken for 24 h,and all acidic groups were subsequently calibrated using 0.05 mol·L−1HCl with Methyl orange as indicator and all alkali groups were calibrated by using 0.1 mol·L−1NaOH to pH=7[34].
Acidic functional groups:
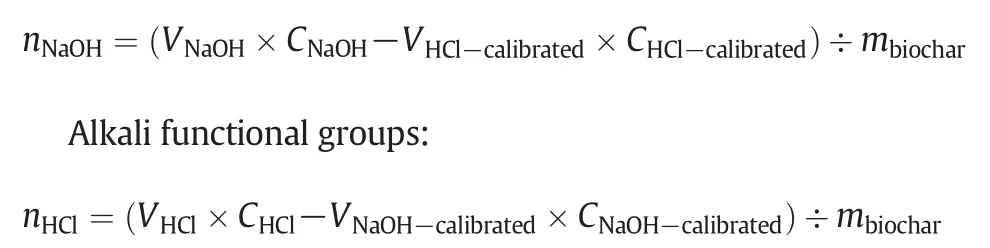
where:nis the amount of functional groups(mmol·g−1);Vis the volume(L);Cis the concentration(mmol·L−1);mis biocharquality(g)
Nutrient elements:Total N content was determined by the semimicro Kjeldahl method[25].Total P content was measured using the Mo–Sb colorimeter and the contents of inorganic P and organic P were measured in accordance to the standardized method program[26].Total K content was assessed using inductively coupled plasma atomic emission spectrophotometer(ICP-AES)[27].The composition of different K species was determined by first washing biochar with water,NH4AC and HCl,and the K content of the solution was later measured by flame photometer[28].The content of trace metals in the biochar was determined by ICP-AES[27].
2.4.Kinetic analysis
In order to investigate biochar mass loss due to temperature,common kinetic equations such as the Elovich Eq.(1),two-constant Eq.(2)and the equation of different order kinetics(3)were used:
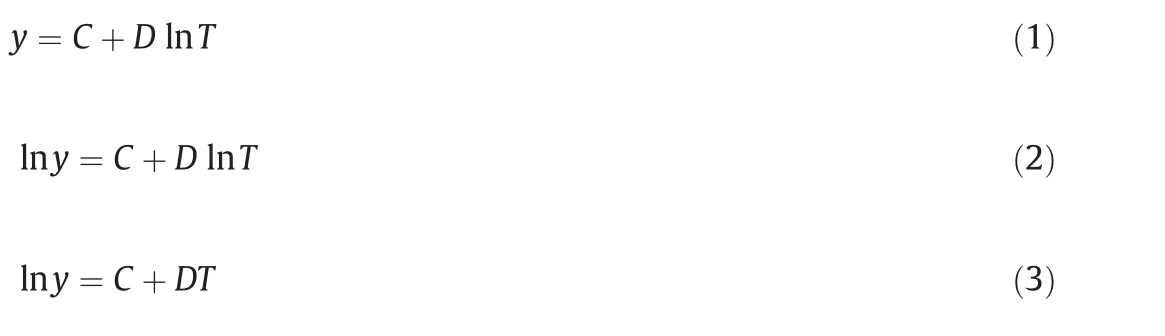
whereyis the mass of biochar(g);Tis the temperature(K);Cis the constant coefficient of the equation;Dis the variable coefficient of the equation.By fitting three kinetic equations and comparing the coefficient of determination(R2)value,as given in Table 1,it can be concluded that the Eq.(3)of different order kinetics is more suitable for biochar mass loss evaluation.

Table 1Effects of temperature and atmosphere of biochar preparation on the alkali metals' contents in the biochar solutions
To determine the reaction order in the equation of different order kinetics,the reaction kinetics Eq.(4)was used as follows:

During the straw pyrolysis process,kandTcan be calculated using Eqs.(6)and(7),respectively:
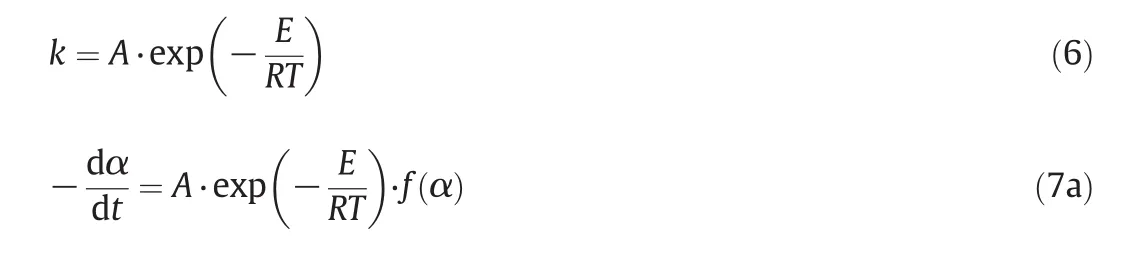
For the general pyrolysis reaction,reaction activation energy(E)is not related to reaction temperature(T);thus,Eq.(7a)can be transformed into Eq.(7b):
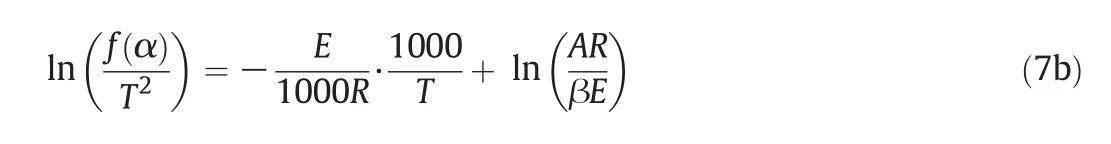
where:kis the reaction rate constant;α is the mass fraction;Mis the straw mass(g);Eis the reaction activation energy;Tis the reaction temperature(K);Ais the frequency factor;β is the heating rate(°C·min−1);R=8.314(J·mol−1·K−1).
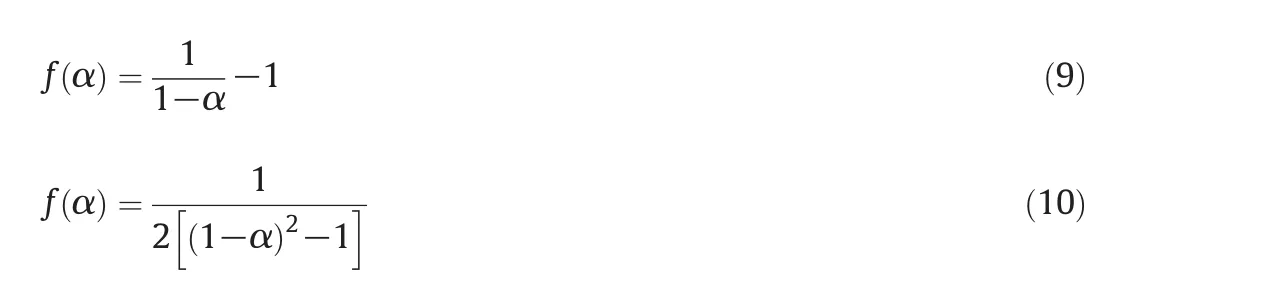
First,second and third order kinetics can be calculated using Eqs.(8),(9)and(10),respectively:


Fig.2.Effects of N2 or CO2 on pH.

3.Results and Discussion
3.1.Changes of the biochar pH value in the N2 and CO2 atmospheres
Changes in biochar pH influenced by the different pyrolysis atmospheres and temperatures are presented in Fig.2.As seen in Fig.2,biochar pH increased with rising temperature independent of the pyrolysis atmosphere.Thus,alkaline biochar could be used as a reliable tool for soil acidification reduction.When the temperature was below 350°C,the pH of the rice straw biochar was higher in the CO2atmosphere in comparison to the N2atmosphere.
The content of alkali metals(Ca,K,Na and Mg)in the solutions from differently prepared biochar is presented in Table 2.It is clear from the table that metal content increased with rising temperature during biochar preparation.At higher pyrolysis temperatures,alkali metals in the produced biochar were more soluble in water and thus,more readily bioavail able.Therefore,another reason for rising pH values is that the aromatic degree of biochar increased along with the rising temperature,which caused the gradual increase of alkaline groups.The trends in Fig.3 identify the amount of acidic and alkaline functional groups in the biochar prepared under different working conditions.It can be observed that the difference between acidic and alkaline functional group amount below 350°C was smaller in the N2atmosphere,consequently the pH value was also lower.Meanwhile,biochar produced using CO2atmosphere exhibited a larger difference between acidic and alkaline functional group amount,hence the pH value was higher.However,when the reaction temperature rose above 350°C,the difference between acidic and alkaline functional group amount was not obviously different between the biochar produced under the CO2and N2atmospheres,so the pH values were the same.The mechanism of pH transformation can be shown schematically in Fig.4,according to the changed characteristics of functional groups and alkali metals.
3.2.Biochar mass changes in the N2 and CO2 atmospheres
Fig.5 shows the variation in straw quality resulting from straw pyrolysis.Initially,straw mass started to decrease because water evaporated at temperatures up to 200 °C.From 200 to 350 °C,cellulose and hemi-cellulose in the straw pyrolysed into gases,such as CO,CO2,etc.Straw also contains a significant amount of lignin and minerals,which can produce acetates during the pyrolysis.Consequently,acetate could promote the pyrolysis reaction itself[20,21].Above 350°C,the biocharmass decreased continuously,but the speed of the mass loss was very low.In the CO2atmosphere,the mass abruptly dropped because biochar gasification started to occur above 700°C(C+CO2→ 2CO).
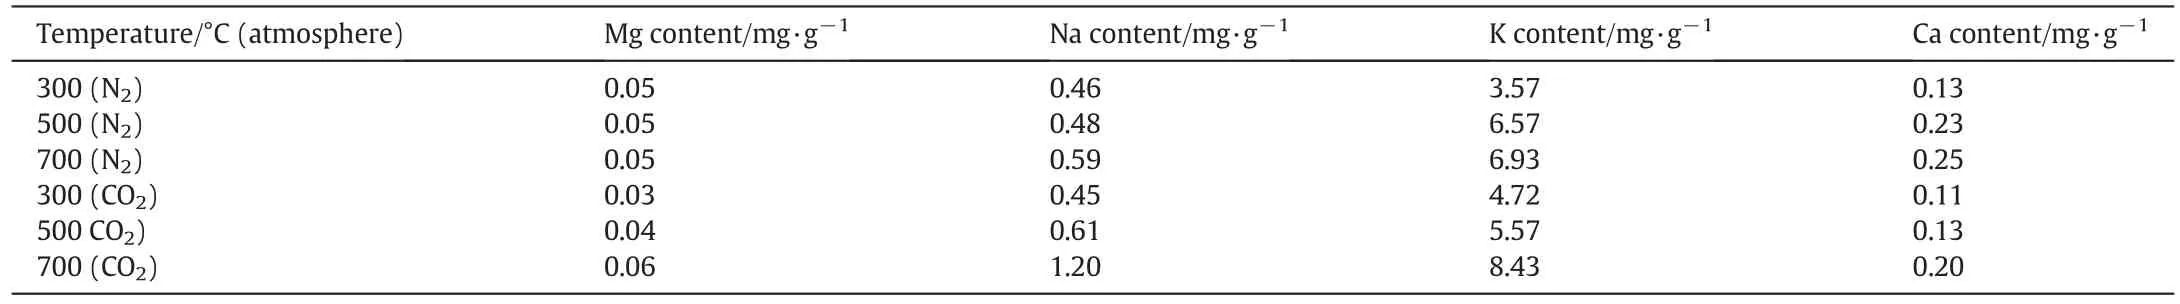
Table 2Alkali metal content in the solutions of differently prepared biochar(time of dissolution equilibrium–2 h)
Identified reaction characteristics,such as temperature,atmosphere and products(Fig.5),enabled the calculation of the straw pyrolysis kinetics.The changes of biochar mass along with rising temperature were simulated using the aforementioned equation of the different order kinetics(3)as the most suitable for biochar mass loss evaluation(Table 1).First,second and third order kinetic equations were calculated and the results are presented in Fig.6.
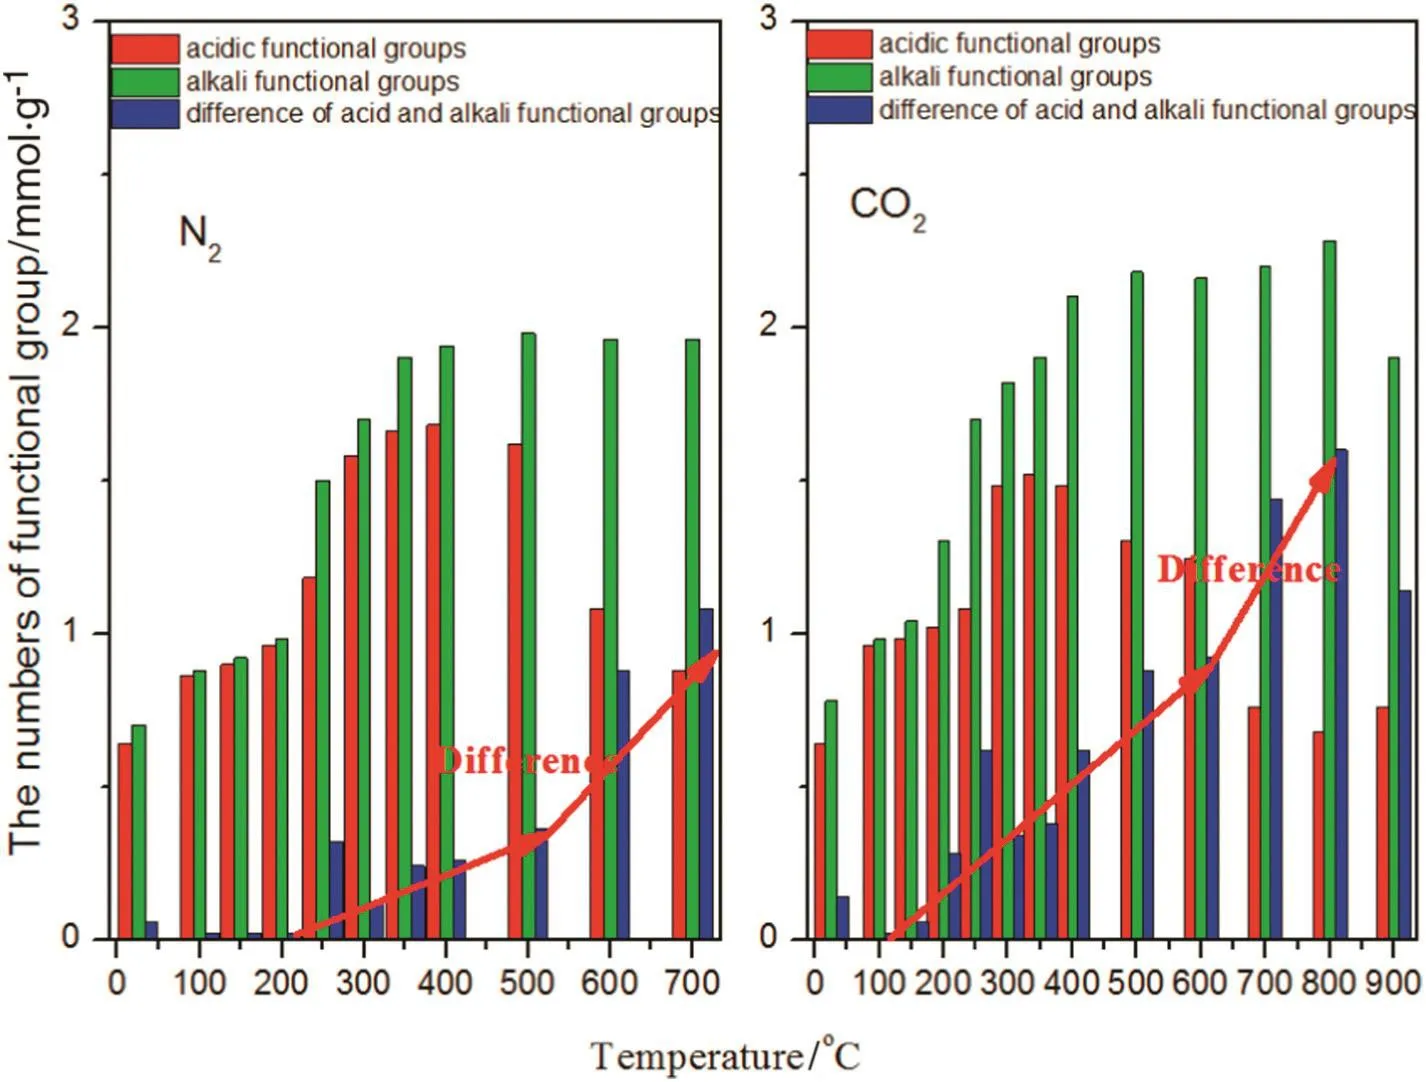
Fig.3.Effects of N2 or CO2 on the quantity of acid and alkali functional groups.
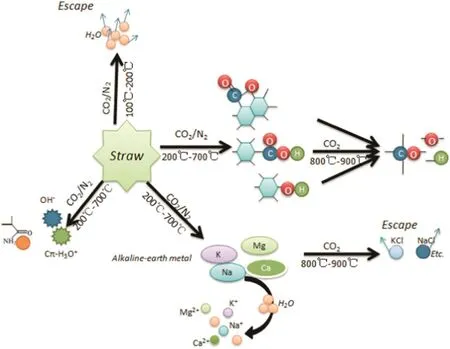
Fig.4.The mechanism of pH transformation during biochar preparation(N2 and CO2).
The equation of the first order kinetics was the most accurate for considering the mass loss regardless the N2and O2atmospheres during the pyrolysis.Via linear fitting from Fig.6,frequency factor(A)and activation energy(E)were obtained,and the kinetics equations for the different pyrolysis atmospheres are shown in Table 3.
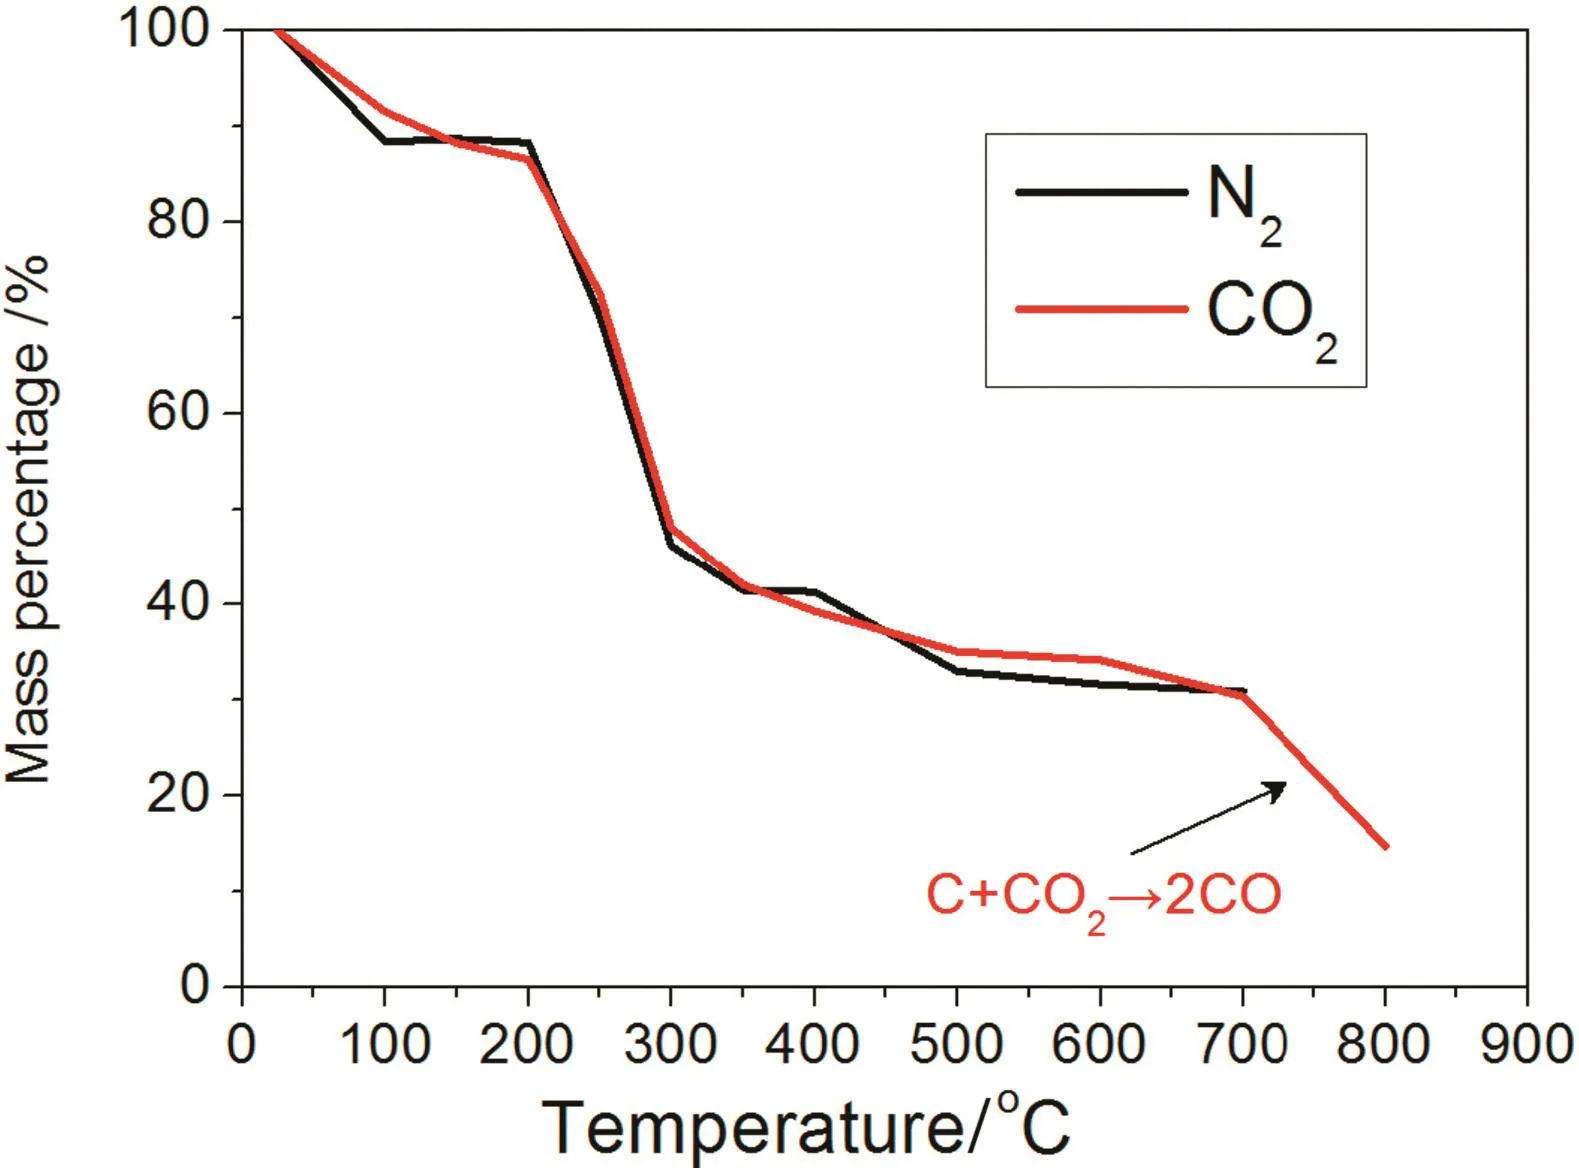
Fig.5.Effects of N2 or CO2 on mass loss with temperature.
3.3.Effects of N2 or CO2 on nutrients(N,P and K)
3.3.1.The mechanism of N transformation during biochar preparation
Fig.7 shows the N percentage during biochar preparation.N percentage decreased with rising temperature regardless of the N2or CO2atmosphere.However,N was reduced quicker in the N2atmosphere in comparison to the CO2atmosphere,when the temperature was below 700°C.Therefore,if there is an intention to return biochar to the soil,from the perspective of nutrients and N in particular,the preparation of the biochar in a CO2atmosphere is more favorable.
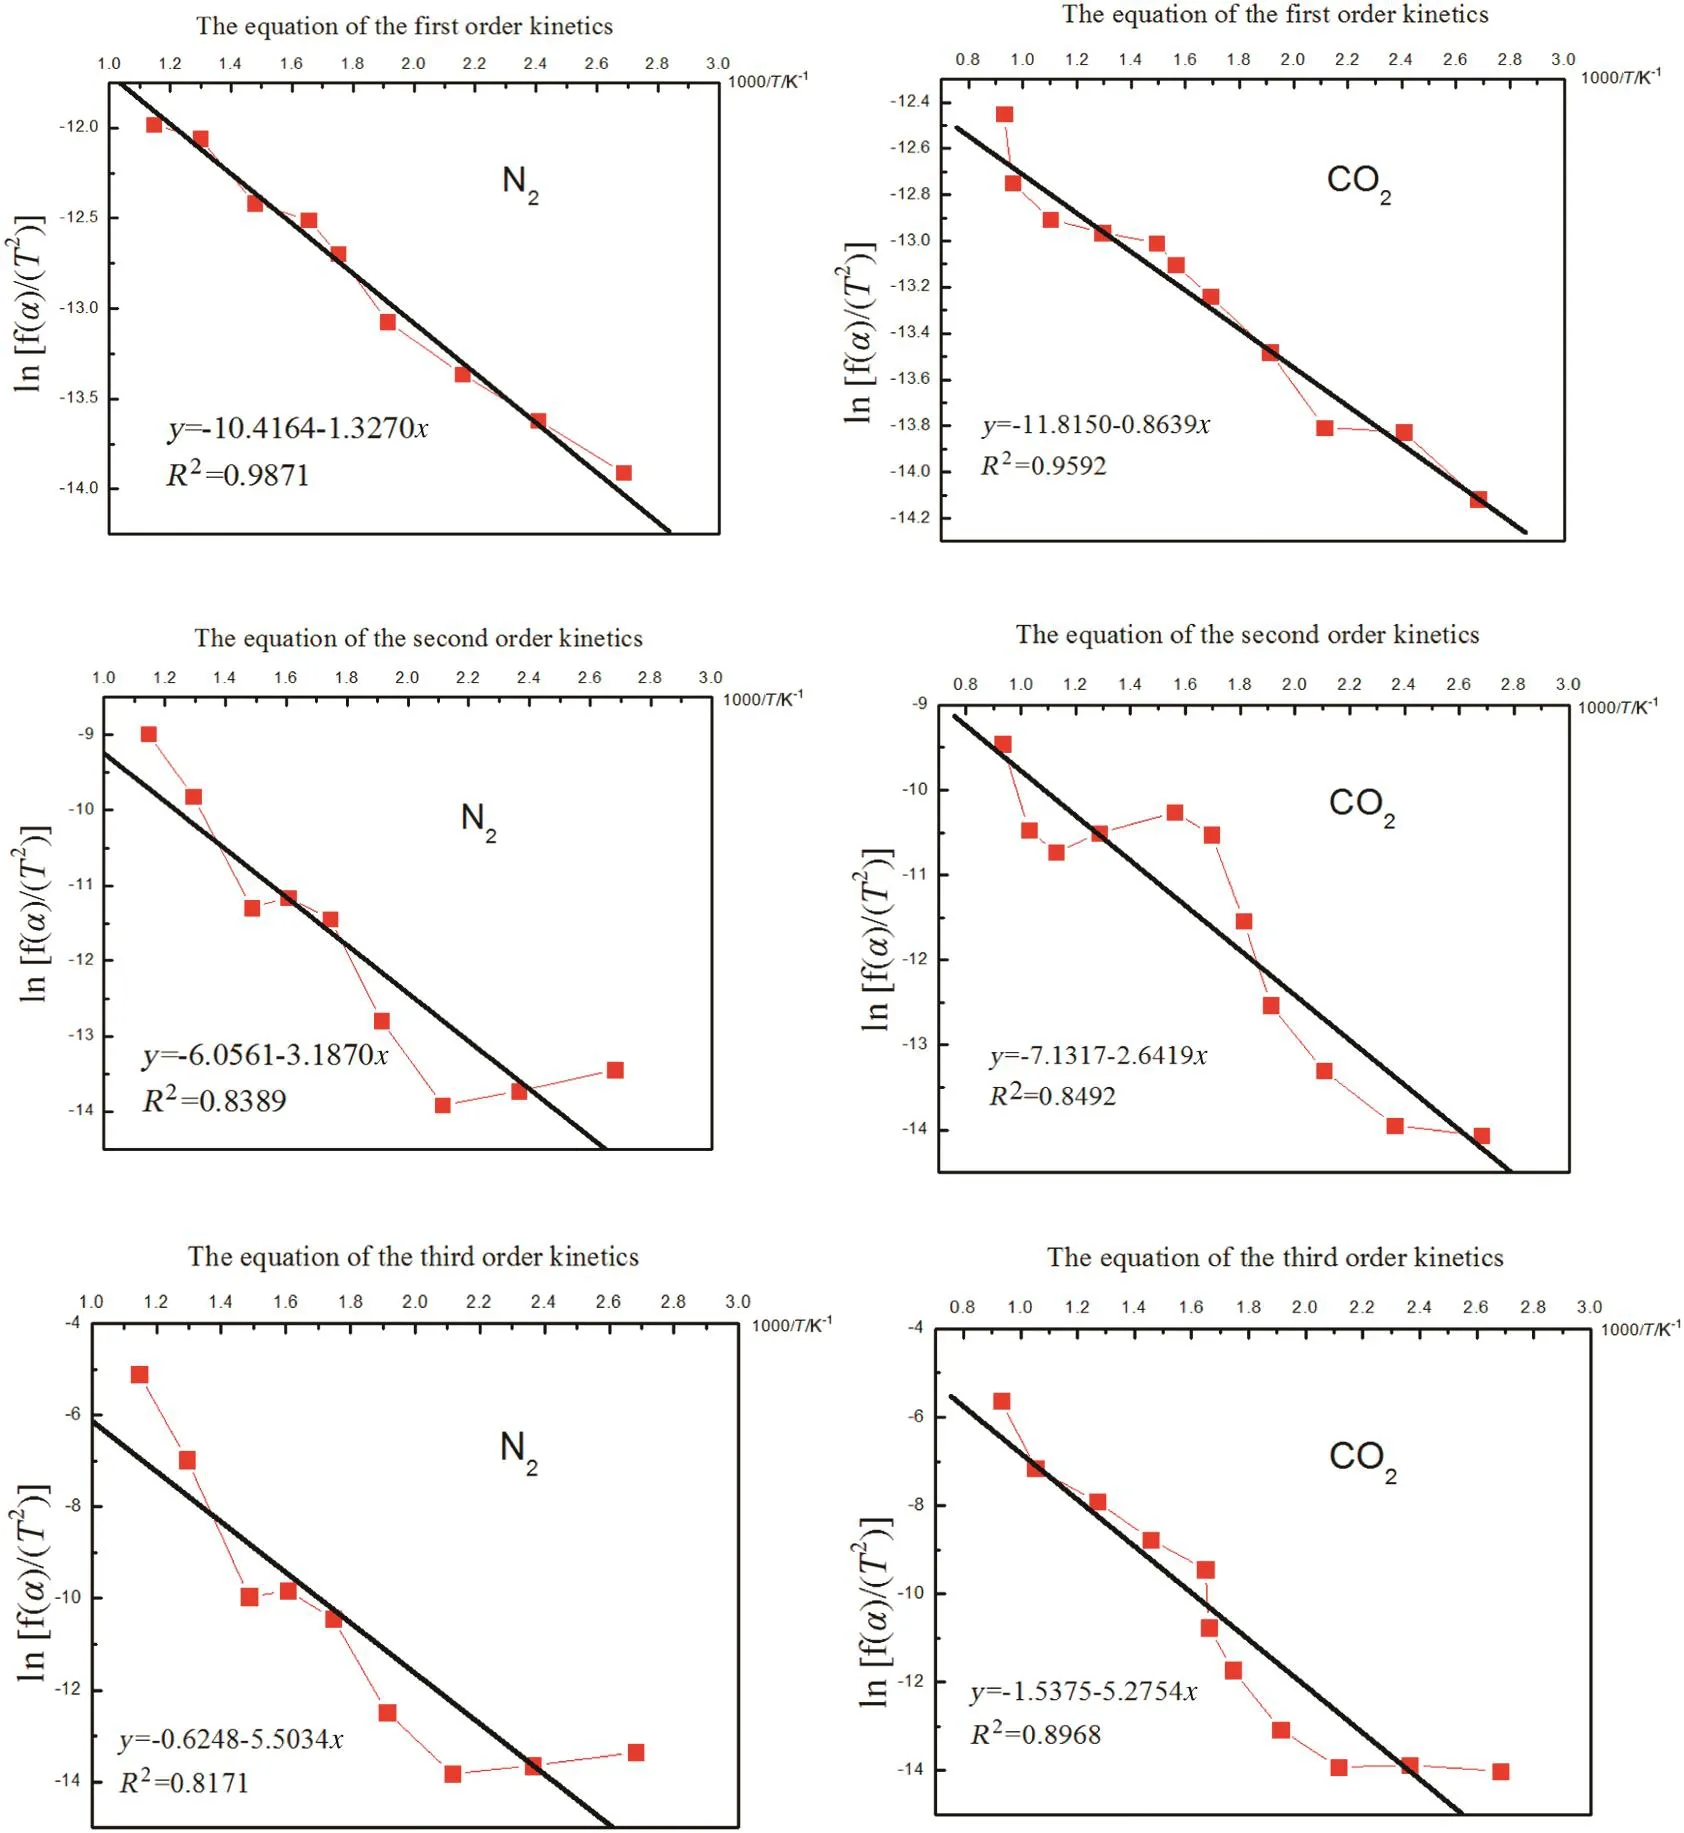
Fig.6.Straw mass loss simulated using different order kinetics equations.
Under the N2or CO2atmosphere,the N percentage started to decrease starting at 150 °C,as cellulose began to degrade.From 250 °C to 500°C,the N percentage was reduced even more because of the pyrolysed cellulose,hemi-cellulose and lignin.In contrast,the N loss in the CO2atmosphere was lower than in the N2atmosphere because(i)the temperature at which N volatiles are formed is different in different atmospheres,and(ii)such compounds as NH3,HCN and NO are inhibited in the CO2atmosphere.As shown in Table 4,the temperatures at which NH3,HCN and NO are formed are lowest under the N2atmosphere compared with other atmospheres.The CO2atmosphere can inhibit the initiation of NH3,HCN and NO compounds,so more nitrogen will be retained in the biochar,which is advantageous when biochar is returned to the soil.According to the formation temperature of volatile N compounds(Table 4)and the trends for N loss(Fig.7),the migration and transformation mechanisms of nitrogen during the biochar preparation are shown in Fig.8.

Table 3Frequency factor(A),activation energy(E)and kinetic equations for the biochar produced in the N2 and CO2 atmospheres
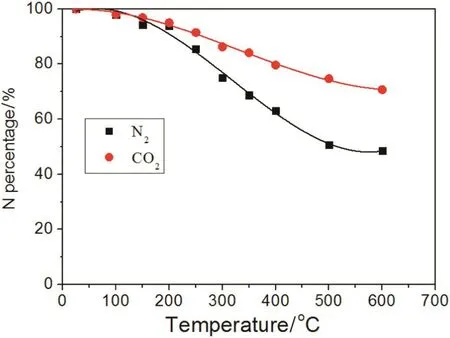
Fig.7.Effect of N2 or CO2 on N.
3.3.2.The mechanism of P transformation during biochar preparation
The biochar's loss of P in the N2and CO2atmospheres under the different pyrolysis conditions is presented in Fig.9.The loss of P increases with rising temperature regardless of the N2or CO2atmosphere.The P loss in the N2atmosphere is higher than in the CO2atmosphere.For ambient temperature up to 250°C,the content of P in the N2atmosphere was almost 100%;from 250 to 300°C,the P percentage decreased to 79%and became stabile.However,the percentage of P loss in the CO2atmosphere was different from that in the N2atmosphere.Modest P loss in the CO2atmosphere is reduced very slowly from 100%to 88%with ambient temperature up to 600 °C.Next,from 700 °C,the speed of P loss sharply increased because the gasification of biochar occurred(C+CO2→2CO).

Fig.8.The mechanism of N transformation in the process of biochar preparation(N2 and CO2).
Phosphorus in the straw is comprised of two species:organic(OP)and inorganic(IP).It is difficult to volatilize IP at ambient temperature as it is an inert compound found in the straw,but when the temperature increases,inorganic P will be lost through volatilization.Organic P is unstable in the thermal environment and it is easily decomposed into phosphates and phosphorus oxides,etc.,which are released from the biochar without difficulty.The content of P in the N2atmosphere decreased much more than in the CO2atmosphere,where OP decomposed quicker in the N2atmosphere and the CO2inhibited the decomposition of OP,thus,the loss of P was lesser.The transformation trends of OP,IP and volatile P in the biochar are shown in Fig.10.Below 600°C,OP in the CO2atmosphere slowly decreased with temperature,but the OP in the N2atmosphere was reduced quicker;the content of IP increased along with rising temperature as a part of the OP was transferred into IP.According to the transformation of P,the conversion mechanism of IP,OP and volatile P is shown in Fig.11.Phosphorus is not lost below 250°C,but with rising temperature and the distribution of IP,OP andvolatile P,started to change because OP decomposes into IP and volatile P,such as P4O10.
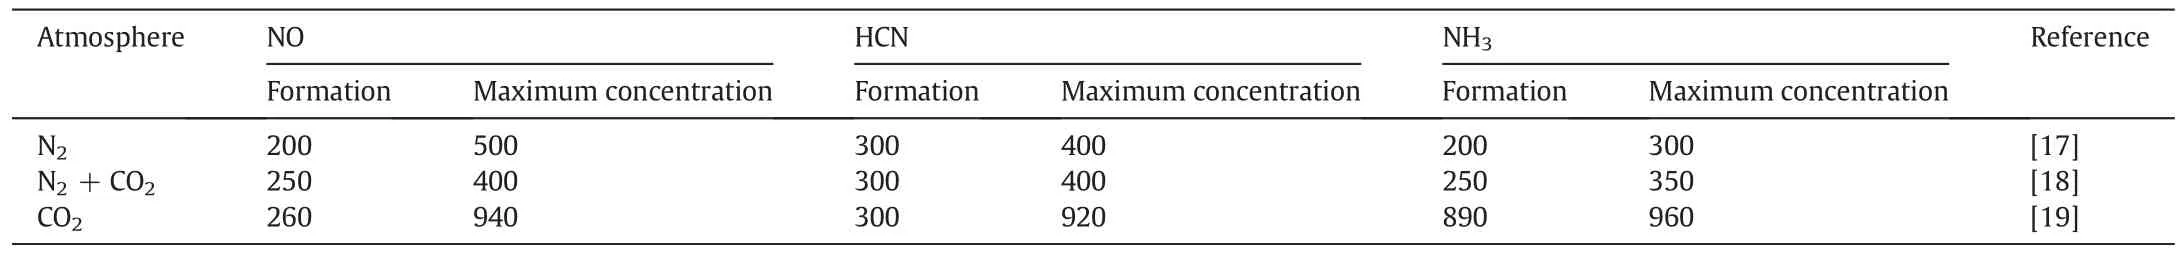
Table 4Effect of N2 or CO2 on the temperature at which NH3,HCN and NO form
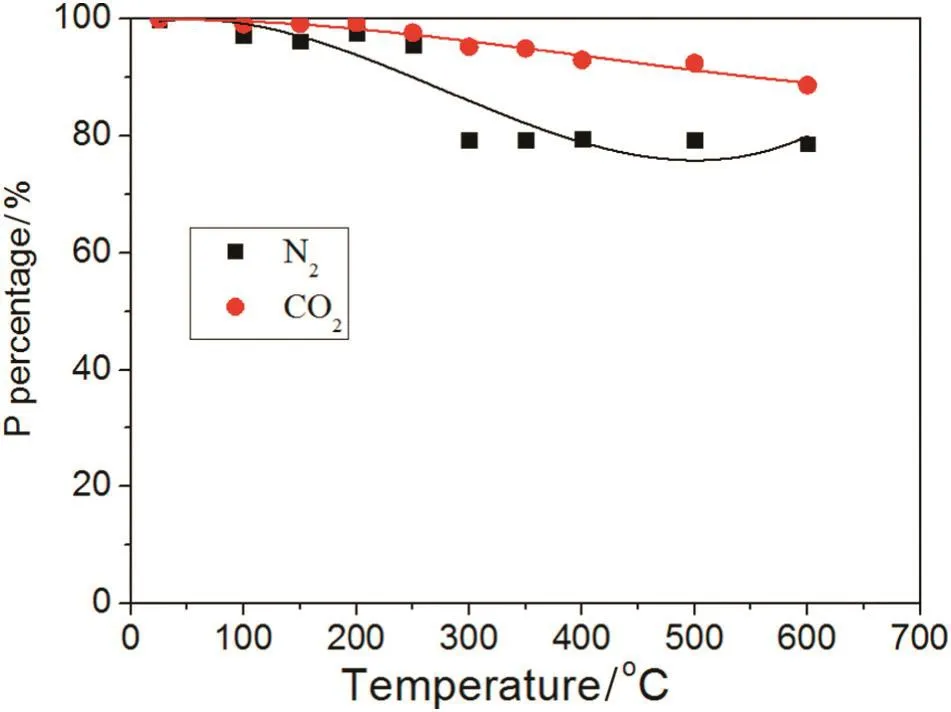
Fig.9.Effect of N2 or CO2 on P.
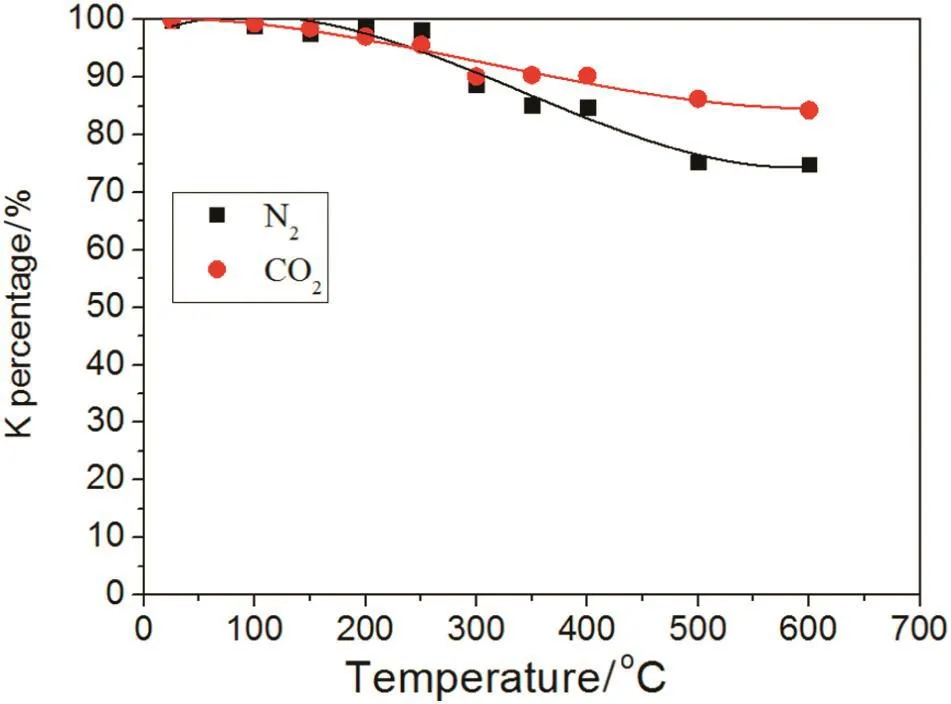
Fig.12.Effect of N2 or CO2 on the K percentage of biochar.
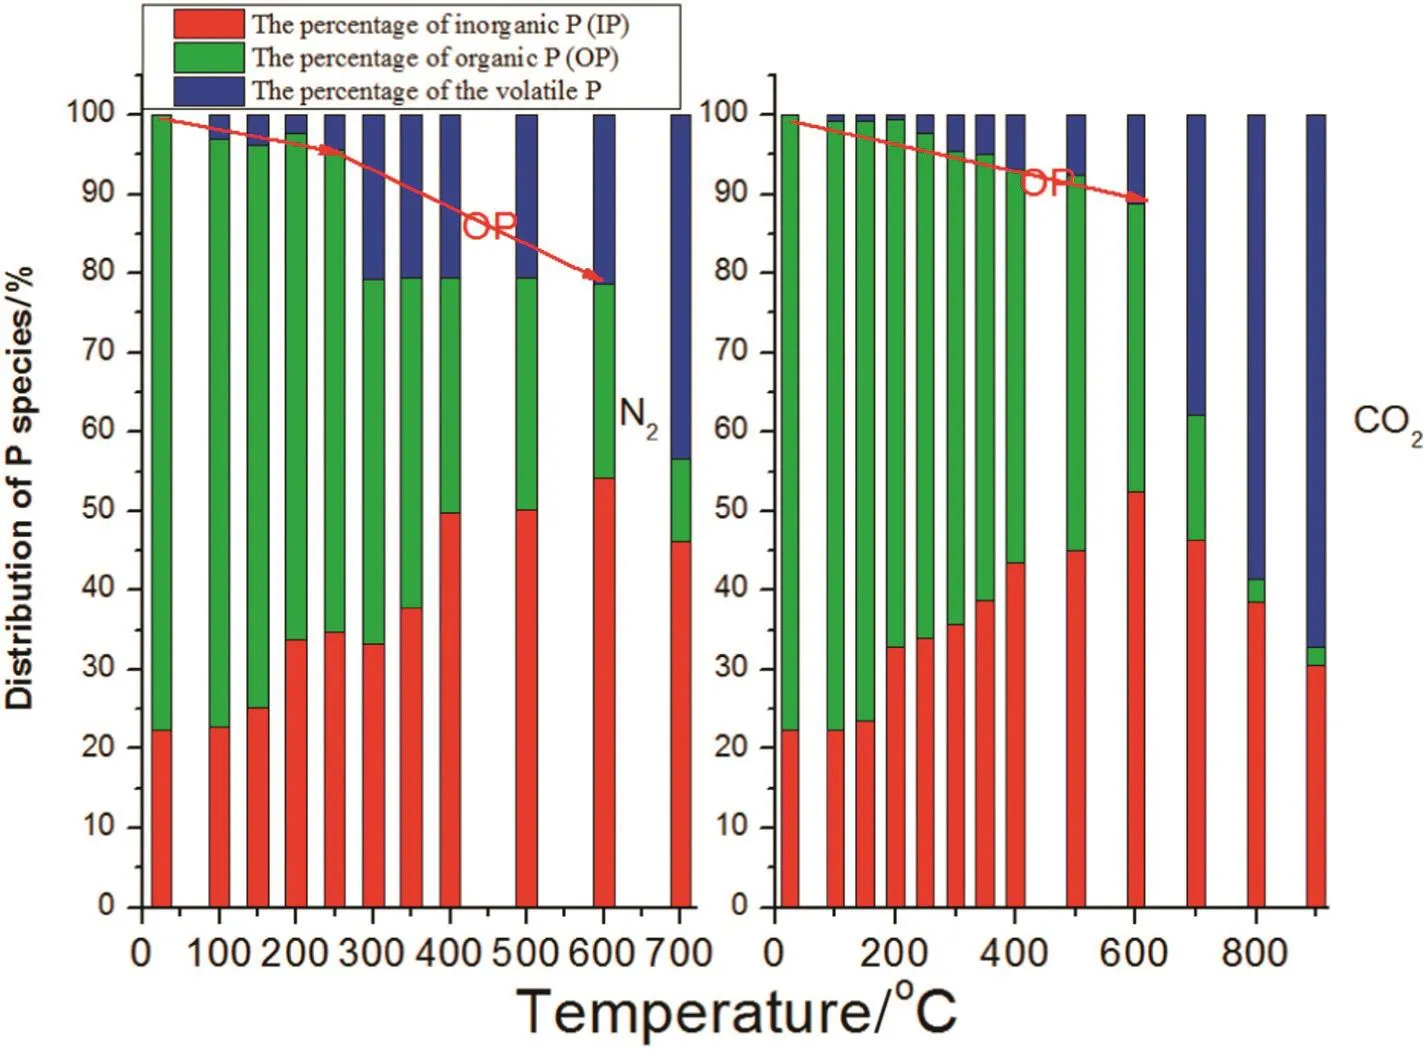
Fig.10.The distribution of IP,OP and volatile P with temperature.

Fig.11.The mechanism of P transformation during biochar preparation(N2 and CO2).

Fig.13.The distribution of K species with biochar temperature.
3.3.3.The mechanism of K transformation during the biochar preparation process
The trend of the percentage K loss in CO2and N2atmospheres under the different working temperatures is shown in Fig.12.The percentage of K decreases with rising temperature.In the N2atmosphere,when temperature was below 300°C,the K percentage was almost unchanged.A decline in K percentage was observed at higher temperatures and at 400°C,the K percentage in the biochar was 84%.Between 500 and 700°C,the K percentage was relatively steady and remained at 75%.In the CO2atmosphere,below 700°C,the K percentage decreased slower than in the N2atmosphere and at 600°C,the K percentage was 84%which was higher than in the N2atmosphere(75%).Therefore,a CO2atmosphere is better for keeping K in the biochar compared with a N2atmosphere.Specifically,biochar created in a CO2atmosphere produces better results when returned to soil.

Fig.14.The mechanism of K transformation in the process of biochar preparation(N2 and CO2).
The transformation trend of different K species along with increasing temperature is shown in Fig.13.Below 250°C,total K remained almost unchanged,regardless of the different atmospheres.From 250°C up to 700°C,the biochar K was mainly in the water soluble K(WSK)form[22].Water soluble components can be transformed into the organic K(OK),silicate K(SK)and volatile K(VK)such as KCl,KOH and K2SO4[23]and volatiles can escape from the biochar.Biochar obtained using CO2atmospheres contained higher contents of K below 700°C,which is better for returning biochar to soil.According to the trends presented in Fig.13,the transformation mechanism of K species is shown in Fig.14.Below 500°C,the WSK transformed into OK,(e.g.R-COOK and VK).From 500 °C up to 700 °C,OK transformed into VK and SK.The transformation steps are shown in Fig.14.
3.4.Effects of N2 or CO2 on the metal elements in the biochar preparation
The trends ofmetal(Na,Ca,Mg,Al,Cu,Mn,Fe and Zn)content in the biochar prepared using different atmospheres are presented in Fig.15.In the N2atmosphere,metal content increased with rising temperature because the mass of biochar was reduced.Metal content changes in the CO2atmosphere were similar to those in the N2atmosphere,but only up to 700 °C.From 700 °C to 900 °C,metal content in the CO2atmosphere was abruptly reduced because gasification of the biochar occurred(C+CO2→2CO).Changes in the metal content can be described as a three-step process:(i)below 300°C,metal content in the biochar changes slowly;(ii)from 300 to 500°C,metal content rapidly increases because the straw mass is being reduced with the onset of the pyrolysis;(iii)from 500 °C to 700 °C,metal content in the biochar changes very slowly because the biochar mass is being reduced at a slow pace.
Both in the N2and CO2atmospheres,content of Na varies widely because sodium is mainly in volatile compounds,which are easily released from the biochar.Contents of Ca and Mg are more stable compared to Na because both Ca and Mg exhibit+II valence state;thus,it is easier to bond with C or Si and be retained in the biochar.There were no obvious differences among the trends of Al,Cu,Mn,Fe and Zn contents,and all the elements of Al,Cu,Mn,Fe and Zn are better enriched in the biochar.In sum,most of the metal elements are very well enriched in the biochar,which is beneficial for returning biochar to soil and to maintain soil balance with respect to metal elements.
4.Conclusions
Proper biochar preparation method is the key for the successful return of biochar to soil since nutrient loss occurs easily during preparation.Several conclusions can be drawn from the results of this study with regard to the biochar preparation.(i)The pH of biochar is always alkaline no matter in what atmosphere the pyrolysis is performed and this is beneficial for soil acidity reduction.(ii)The best temperature range for biochar preparation is from 350°C to 450°C,as macronutrient(N,P and K)loss is reduced,and the CO2atmosphere is more favorable than the N2atmosphere.(iii)Metal content in the biochar is the highest at a temperature range from 350 °C to 450 °C.(iv)The comparison of pH trends,changes in mass,nutrients and metals indicates that the most suitable temperature for biochar preparation is 350°C,and the CO2atmosphere is more favorable.
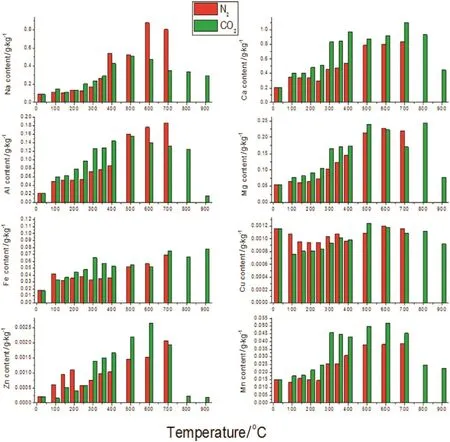
Fig.15.Effects of N2 or CO2 on the metal contents of biochar.
[1]J.Lehmann,J.Gaunt,M.Rondon,Bio-char sequestration in terrestrial ecosystems—A review,Mitig.Adapt.Strat.Gl.11(2006)403–427.
[2]A.Masulili,W.H.Utomo,M.S.Syechfani,Rice husk bio-char for rice based cropping system in acid soil 1.The characteristics of rice husk bio-char and its influence on the properties of acid sulfate soils and rice growth in west Kalimantan,Indonesia,J.Agric.Sci.2(2010)39–47.
[3]M.Yamato,Y.Okimori,I.F.Wibowo,Effects of the application of charred bark ofAcacia mangiumon the yield of maize,cowpea,peanut and soil chemical properties in south Sumatra,Indonesia,Soil Sci.Plant Nutr.52(2006)489–495.
[4]S.Yoshizawa,S.Tanaka,M.Ohata,Proliferation effect of aerobic microorganisms during composting of rice bran by addition of biomass charcoal,Proceedings of the International Agrichar Conference,Terrigal NSW,Australia 2007,pp.26–27.
[5]D.D.Warnock,J.Lehmann,T.W.Kuyper,Mycorrhizal responses to bio-char in soil concepts and mechanisms,Plant Soil300(2007)9–20.
[6]M.Saito,T.Marumoto,Inoculation with arbuscular mycorrhizal fungi:The status quo in Japan and the future prospects,Plant Soil244(2002)273–279.
[7]J.Meng,W.M.Zhang,S.B.Wang,Z.J.Xu,W.F.Chen,Developments and prospect of carbonization and returning technology of agro-forestry residue,J.Shenyang Agric.Univ.42(2011)387–392.
[8]M.Rondon,J.Ramirez,J.Lehmann,Charcoal additions reduce net emissions of greenhouse gases to the atmosphere,Proceedings of the 3rd USDA Symposium on Greenhouse Gases and Carbon Sequestration,2005,March 21–24,Baltimore,MD 2005,p.208.
[9]J.Lehmann,S.Joseph,Bio-Char for Environmental Management:Science and Technology,Earthscan Publications Ltd,London,2009.
[10]K.A.Spokas,W.C.Koskinen,J.M.Baker,D.C.Reicosky,Impacts of wood-chip bio-char additions on greenhouse gas production and sorption/degradation of two herbicides in a Minnesota soil,Chemosphere77(2009)574–581.
[11]B.Glaser,J.Lehmann,W.Zech,Ameliorating physical and chemical properties of highly weathered soils in the tropics with charcoal-A review,Biol.Fertil.Soils35(2002)219–230.
[12]C.Steiner,B.Glaser,W.Teixeira,Nitrogen retention and plant uptake on a highly weathered central Amazonian Ferralsol amended with compost and charcoal,J.Plant Nutr.Soil Sci.171(2008)893–899.
[13]B.Liang,J.Lehmann,D.Solomon,Black carbon increases cation exchange capacity in soils,Soil Sci.Soc.Am.J.70(2006)1719–1730.
[14]D.A.Wardle,O.Zackrisson,M.C.Nilsson,The charcoal effect in Boreal forests:Mechanisms and ecological consequences,Oecologia115(1998)419–426.
[15]M.W.I.Schmidt,A.G.Noack,Black carbon in soils and sediments:analysis,distribution,implications,and current challenges,Glob.Biogeochem.Cycles14(2000)777–793.
[16]B.Glaser,L.Haumaier,G.Guggenberger,The “Terra Preta”phenomenon:A model for sustainable agriculture in the humid tropics,Naturwissenschaften88(2001)37–41.
[17]F.J.Tian,B.Q.Li,Y.Chen,C.Z.Li,Formation of NOxprecursors during the pyrolysis of coal and biomass.Part V.Pyrolysis of a sewage sludge,Fuel81(2002)2203–2208.
[18]Q.Q.Ren,C.S.Zhao,NOxand N2O precursors from biomass pyrolysis:Nitrogen transformation from amino acid,Environ.Sci.Technol.46(2012)4236–4240.
[19]Z.H.Wang,Research on Form Transformation and Releasing Regulation of Fuel-N during the Pyrolysis and Gasification(Ph.D.Dissertation)Huazhong University of Science and Technology,Wuhan,2011.
[20]H.Zhang,R.Xiao,D.Wang,G.He,S.Shao,J.Zhang,Z.Zhong,Biomass fast pyrolysis in a fluidized bed reactor under N2,CO2,CO,CH4and H2atmospheres,Bioresour.Technol.102(2011)4258–4264.
[21]C.Jindarom,V.Meeyoo,T.Rirksomboon,B.Kitiyanan,P.Rangsunvigit,Production of bio-oil by oxidative pyrolysis of sewage sludge in rotating fixed bed reactor,Asian J.Energy Environ.4(2006)401–409.
[22]H.Zheng,Z.Y.Wang,X.Deng,J.Zhao,Y.Luo,J.Novak,S.Herbert,B.S.Xing,Characteristics and nutrient values of biochars produced from giant reed at different temperatures,Bioresour.Technol.130(2013)463–471.
[23]C.Boman,Particulate and Gaseous Emissions from Residential Biomass Combustion(Ph.D.Dissertation)Umeå University,Sweden,2005.
[24]L.Tsechansky,E.R.Graber,Methodological limitations to determining acidic groups at biochar surfaces via the Boehm titration,Carbon66(2014)730–733.
[25]E.M.Smit,An ultra-micromethodfor the determination of total nitrogen in biological fluids based on Kjeldahl digestion and enzymatic estimation of ammonia,Clin.Chim.Acta4(1979)129–135.
[26]A.Boenke,The standards,measurements and testing programme(SMT),the European support to standardisation,measurements and testing projects,Mikrochim.ActaSupplement 15(1998)387–392.
[27]E.Borai,M.Eid,H.Aly,Determination of REEs distribution in monazite and xenotime minerals by ion chromatography and ICP-AES,Anal.Bioanal.Chem.372(2002)537–541.
[28]W.R.Knolle,A simple modification of a flame photometer for routine trace potassium analysis,Appl.Spectrosc.27(2)(1973)142.
[29]P.Fu,W.Yi,X.Bai,et al.,Effect of temperature on gas composition and char structural features of pyrolyzed agricultural residues,Bioresour.Technol.102(17)(2011)8211–8219.
[30]S.Wang,B.Gao,A.R.Zimmerman,et al.,Physicochemical and sorptive properties of biochars derived from woody and herbaceous biomass,Chemosphere134(2015)257–262.
[31]W.Wu,M.Yang,Q.Feng,et al.,Chemical characterization of rice straw-derived biochar for soil amendment,Biomass Bioenergy47(2012)268–276.
[32]Q.Q.Ren,C.S.Zhao,W.U.Xin,etal.,Formation of NOx precursors during wheat straw pyrolysis and gasification with O2and CO2,Fuel89(5)(2010)1064–1069.
[33]J.Zhang,J.Liu,R.Liu,Effects of pyrolysis temperature and heating time on biochar obtained from the pyrolysis of straw and lignosulfonate,Bioresour.Technol.176(2015)288–291.
[34]L.Tsechansky,E.R.Graber,Methodological limitations to determining acidic groups at biochar surfaces via the Boehm titration,Carbon66(2014)730–733.
杂志排行
Chinese Journal of Chemical Engineering的其它文章
- Suppressing secondary reactions of coal pyrolysis by reducing pressure and mounting internals in fixed-bed reactor☆
- An adaptive neuro-fuzzy sliding mode controller for MIMO systems with disturbance
- Preparation of cross-linked enzyme aggregates of nitrile hydratase ES-NHT-118 from E.coli by macromolecular cross-linking agent☆
- Development of a new cleaner production process for cassava ethanol☆
- Multi-objective regulation in autohydrolysis process of corn stover by liquid hot water pretreatment
- Modelling of adsorption of textile dyes over multi-walled carbon nanotubes:Equilibrium and kinetic