Suppressing secondary reactions of coal pyrolysis by reducing pressure and mounting internals in fixed-bed reactor☆
2017-05-28ShuaiChengDengguoLaiZhenShiLeishengHongJianlingZhangXiZengShiqiuGaoGuangwenXu
Shuai Cheng ,Dengguo Lai,Zhen Shi,Leisheng Hong ,Jianling Zhang ,Xi Zeng ,Shiqiu Gao ,*,Guangwen Xu ,*
1 State Key Laboratory of Multi-phase Complex Systems,Institute of Process Engineering,Chinese Academy of Sciences,Beijing 100190,China
2 University of Chinese Academy of Sciences,Beijing 100049,China
3 AnHui University of Technology,Ma'anshan 243002,China
1.Introduction
Coal plays an important role in energy supply and substitution of petroleum chemicals and oils,especially in China[1].Low-rank coals including lignite and bituminite attribute about 65%of China coal reserve[2].As one economical technology for low-rank coal upgrading and utilization,pyrolysis of coal has been extensively investigated to produce coal tar and also hydrogen-rich gas.Coal tar provides more than 95%supplement of aromatics and heterocyclic compounds with 2–4 rings in China,with 15%–25%being BTX[3].The gas product of coal pyrolysis can be feedstock of coal chemical processes,while pyrolysis char can be used like coal.
Various factors including temperature[4,5],pressure[6,7],heating rate[8],atmosphere[9,10],coal type[10,11]and particle size[12,13]have been studied to obtain more tar and gas via coal pyrolysis.A series of homogenous or heterogeneous coking and cracking reactions to coal released volatiles play an important role in the final distribution and qualities of pyrolysis products[14,15].Such secondary reactions closely depend on reactor geometry[8,16],operation condition[8,17]and coal type[11,12]but they usually reduce tar yield by about 50%[18].Fluidized bed would reduce secondary reactions by quick exporting volatiles,while pyrolysis products in fixed bed reactor normally have to contact high-temperature char and reactor surfaces to have more intensive secondary reactions[5,8,10,11,19].It is well known that high temperature,long residence time and high pressure are not good to tar production because they lead to more tar cracking and coking reactions.Coal type influences coal pyrolysis through volatile content,intraparticle diffusion and catalytic activity of char to secondary reaction[8,11,20].
Serio[15]found that vacuum pyrolysis of a thin layer fine coal particle significantly eliminated secondary reactions.There are several literature studies on vacuum coal pyrolysis,but they were mainly at relatively low temperatures[4,21,22]and in micro reactor mainly heated by wire-mesh[23–26].While Royet al.[13,27]reported the effects of temperature on products distribution under vacuum conditions,Liet al.[26]demonstrated that reducing pressure enhanced release of tar precursors to have tar yield of 5 wt%increase over coal volatile content.Hirajimaet al.[28]identified that pyrolysis char from reduced pressure has relatively low burning temperature.There are few comprehensive studies about distribution and qualities of entire coal pyrolysis products under reduced pressure in reactor treating kilogram coal.
Our previous studies demonstrated that the indirectly heated fixed bed reactor mounted with particularly designed internals consisting of a central gas collection pipe and some heat transfer plates immersed in coal bed can remarkably reduce secondary reactions through their changing flow pattern of pyrolysis volatile in the reactor[29,30].The application of vacuum condition to oil shale pyrolysis was found quite effective in this reactor,which obviously promoted the yields of light oil and VGO[31].The present study aims at clarifying the mutual interaction of mounting internals and lowering reaction pressure on coal pyrolysis through their synergetic suppression of secondary reactions occurring inside the reactor.Tests will be first performed in a fixed bed reactor with internals by loading 1200 g coal each time and further be comprehensively analyzed to clarify the inhibiting effect resulted from that mutual interaction on secondary pyrolysis reactions.Subsequently,a small fixed bed treating 20 g coal sample will be adopted,in terms of their induced variations in products yield and properties of coal pyrolysis,to investigate how reducing pressure interacts with other operating parameters on suppressing secondary pyrolysis reactions.
2.Experimental
2.1.Facility and methods
Fig.1 shows the experimental apparatus using a bench-scale fixed bed reactor without or with internals(types A and B reactors)for coal pyrolysis[30].The reactor A is a kind of traditional fixed bed reactor,while the reactor B is mounted with both a central gas collecting pipe and numbers of heat transfer plates.After loading 1200 g coal below 5 mm(for each experiment),the reactor was fitted into a furnace preheated to 1000°C to start pyrolysis.Both furnace and reactor were covered with silica wool for reducing heat loss and achieving the possibly uniform heating to the reactor.The gauge pressure in the reactor was controlled using a vacuum pump.Gaseous pyrolysis products from the reactor were quickly cooled down in condenser(5),and the formed liquid product was collected into bottle(6).After passing through a number of acetone absorption bottles(8)to further remove tar from gas,the pyrolysis gas passed through a sodium bicarbonate bottle(14)and a silica dehydrator bottle(15)to remove H2S and H2O.The volume of non-condensable gas was accumulatively measured in a wet gas flowmeter and it was further sampled using gas sampling bags in every 3 min for performing gas analysis in a micro-GC(Agilent 3000 A).When the temperature of central bed layer or near the central gas collection pipe reached 550°C,the heating to reactor was stopped and the reactor was lifted out of the furnace immediately.Coalpyrolysis tests were performed at atmospheric pressure and gauge pressures of−20,−40 kPa.Because of high pyrolysis gas volume,the realized lowest reaction pressure in this bench-scale fixed bed reactor was limited to−40 kPa.
Fig.2 shows a schematic diagram of the adopted small fixed bed reactor and its furnace,gas supply and product collection lines.Nitrogen was used as sweeping gas and its flow rate was regulated at 100 ml·min−1by a mass flow controller.A quartz-made fixed bed(inner diameter:28 mm)coupled with an electric golden furnace was adopted.The temperature of reactor was monitored using a K-type thermocouple located in the middle of the reactor.Before experiment,the reactor was heated to a preset temperature of 600 to 800°C.When starting experiment,20 g of coal sample was quickly added into the reactor via a hopper to occur pyrolysis reaction at the preset temperature.A vacuum pump was used to regulate and control the pressure in reactor varying among 0,−40 and−70 kPa.Pyrolysis products from the reactor were carried by sweeping gas and quickly cooled down in a pipe condenser.Most tar and water were stripped from the product steam inside the condenser and in turn pyrolysis product passed through a few acetone-washing bottles immersed in an ice-water bath to collect rest tar from the pyrolysis product stream.Further through a NaHCO3-saturated solution bottle and a silica dehydrator bottle,the pyrolysis gas was collected by gas sampling bags to detect its composition in the micro-GC(Agilent 3000 A).The total volume of noncondensable gas was measured in a wet gas flowmeter.It took 70 min for each experiment,which includes 30 min for reaction and 40 min for cooling and purging.After cooled,all pipes were washed using acetone,while the water in tar-containing liquid,the mixture of that from condensation and also acetone-scrubbing solution,was removed by adding MgSO4.The tar sample for GC–MS analysis was obtained by removing acetone from the dewatered solution of tar through lowpressure(−0.08 MPa)distillation at 25 °C(then kept in refrigerator).Before the condenser,all pipes were heated and maintained at 120°C so that the steam with pyrolysis products was mainly collected by condenser.Thus,50 ml toluene was used to measure the water content in the condenser-collected liquid according to the azeotropic distillation method.
2.2.Materials and characterization
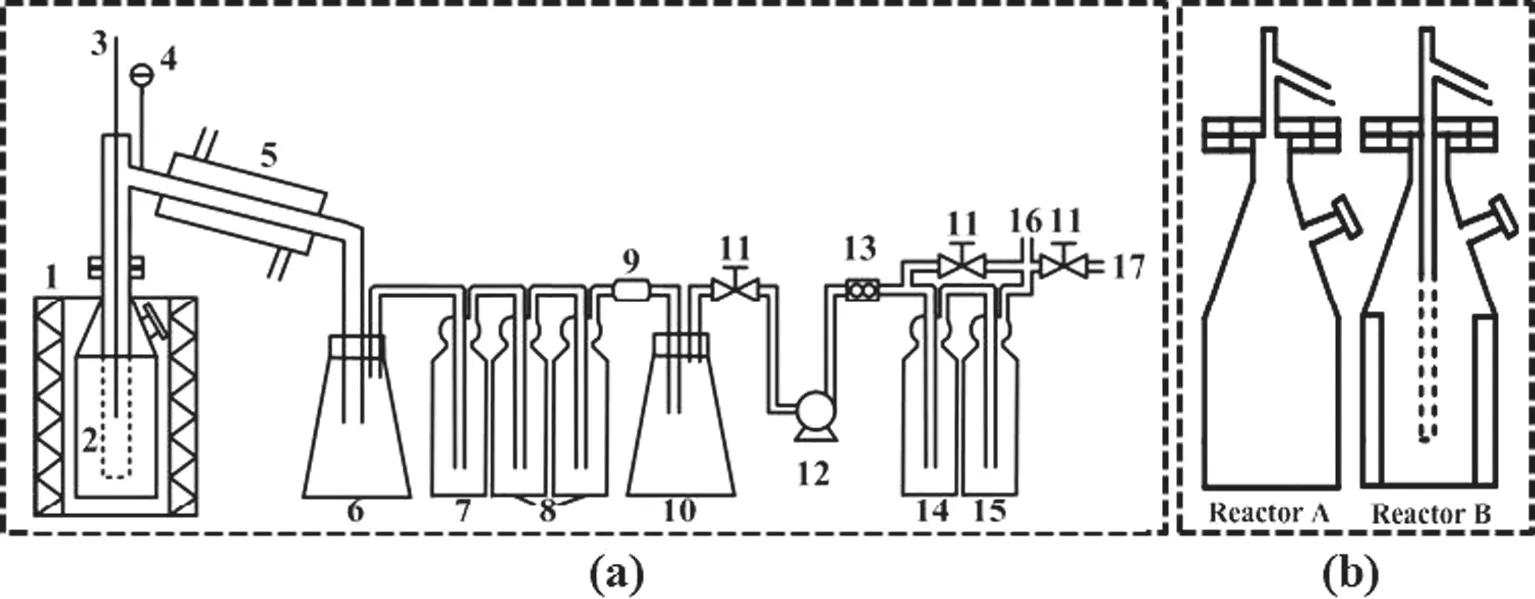
Fig.1.A schematic diagrams of experimental apparatus using a bench-scale fixed bed reactor with or without internals(see(b)Reproduced from Ref.[30,33]).
The coal used in this article was Shenmu coal from Shanxi province of China.The sieved coal below 5 mm was directly used without predrying for the pyrolysis in the bench-scale reactor(1200 g loading),while in the small fixed bed reactor(20 g sample)the tested coal was crashed particles of 0.5–1.0 mm and further dried in an oven of 105 °C for 4 h.Table 1 shows the results of proximate and ultimate analyses for the tested coal samples.The tar content of Gray–King assay was 10.43 wt%against dry basis coal in sizes of 0.5–1.0 mm and this was 9.94 wt%in dry-coal basis for the coal below 5 mm.The volatile contents were over30 wt%for both groups of coal to indicate they are suitable for pyrolysis conversion.In this article,all contents and yields cited herein refer to dry-coal basis,unless a particular specification is made.
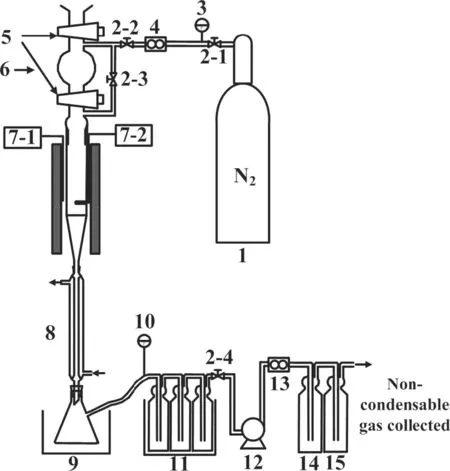
Fig.2.A schematic diagram of experiment apparatus using a small-scale fixed bed reactor.
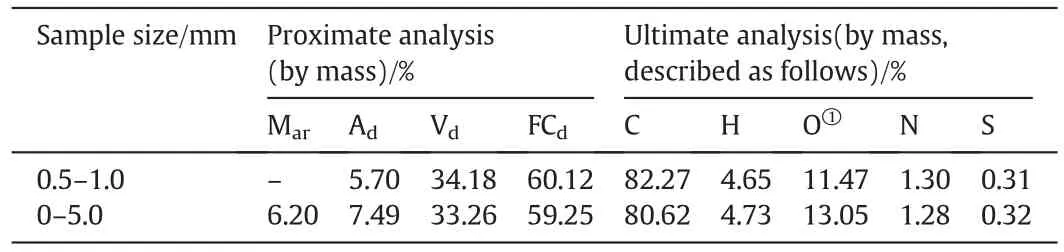
Table 1Proximate and ultimate analyses of Shenmu coal tested
The gaseous pyrolysis product was analyzed in a three-channel GC coupled with TCD(Agilent micro-3000 A)to detect its volume compositions of H2,CH4,CO,CO2,C2H4,C2H6,C3H6and C3H8.The sum of C2H4,C2H6,C3H6and C3H8was presented as C2–C3 species in this paper.The inlet temperature of GC was 120°C,its injector was held at 90 °C and the column temperature was 80 °C,55 °C and 80 °C for its channels A(5 A zeolite),B(Plot U)and C(Plot Q),respectively.Argon was the carrier gas for channel A,and Helium was the gas for both channels B and C.Combining with the total gas volume measured in a gas flow meter,the mass yields of gaseous products were calculated based on ideal gas law for conditions of 1 atm and 15°C.
Dehydrated tar was analyzed in a simulated distillation GC(Agilent 7890B)to determine tar fractions for different boiling points.The analysis was performed on a 10 m×0.32 mm i.d.diphenyl polysiloxane copolymer capillary column by thickness 0.25 μm with 1 μl injected each time.The column box was initially at50 °C before being heated to 400 °C at 9 °C·min−1and further maintained at this temperature for 20 min.Its pressure was controlled at 8.454 kPa(abs)through a balancing flow of 5 ml·min−1high purity N2(99.999%).For running Agilent 7890B GC three streams of 35 ml·min−1high purity H2(99.999%),400 ml·min−1compressed air and 25 ml·min−1high-purity N2(99.999%)were adopted as the fuel gas,oxidant gas and tail-blowing gas for the GC,respectively.The GC-given fractions of tar were further divided into light and heavy oil fractions for boiling points below 350°C(b.p.< 350 °C)and above 350 °C(b.p.≥ 350 °C),respectively.
The major chemical components in tar were analyzed in GC–MS of Shimadzu QP2010 Ultra equipped with 30 m×0.25 mm i.d.Rtx-5MS fused capillary column in a 0.25μm film of silica.Helium was the carrier gas,and the column box was initially at 50°C for 5 min,subsequently heated to 280 °C at 6 °C·min−1and further maintained at 280 °C for 10 min.The column pressure was 68.1 kPa(abs),and the split ratio of 1 μl injected sample was 49:1.For MS its inlet temperature was 280 °C and scan range was 10–900 amu.Compounds were identified by searching the NIST library and WILEY database.Individual compound concentration was obtained from the fractions of peak areas that are normalized to 100%in total.The chemicals in tar identified by GC–MS were grouped into aliphatics(alkane&alkene),phenols,aromatics and the others[29],of which only the first three indicated evident variations with the extent of secondary reactions.
An elemental analyzer(vario MACRO cube CHNS)was employed to measure the mass percentages of elements C,H,N,S and O in coal,tar and char based on the sufficient combustion principle.Thus,the element O fraction was determined by difference.In analysis,the combustion and reduction tubes of the instrument were maintained at 1150 °C and 850 °C,respectively.High-purity Helium(99.999%)was carrier gas with its partial pressure of 1200–1250 mPa,and oxygen at 0.20–0.22 MPa was the oxidant gas.Calibration was based on sulfanilamide having the element contents of N 16.25%,C 41.81%,S 18.62%and H 4.65%.
In addition,the disordered degree of char carbon structure was scanned through Jobin Yvon Lab RAM HR800 Laser Micro-Raman Spectrometry at a laser beam(514 nm).
3.Results and Discussion
3.1.Synergetic effect identi fi cation
The results of coal pyrolysis in the reactor with internals were compared with that in the reactor without internals under gauge pressures of 0 and −20,−40 kPa(see Figs.3–7).Fig.3(a)shows that in reactor B(with internals)the promotion on tar production is evident when lowering the pressure from atmospheric one to−20 and−40 kPa.The absolute tar yield increased by nearly 1.0 wt%from 0 kPa to−20 kPa and finally the yield reached 10.23 wt%at−40 kPa.Variation with pressure on the production distribution,as shown in Fig.3(b),was similar for both reactors A(without internals)and B.Nonetheless,the reactor B enabled obviously higher yields of char,tar and water but lower gas yield,indicating the lower severity of secondary reactions in the reactor B mounted with internals.The data in reactor A(Fig.3(b))would imply that the water formed in pyrolysis more or less reacted with char and tar to have thus its higher gas production but lower water yield.
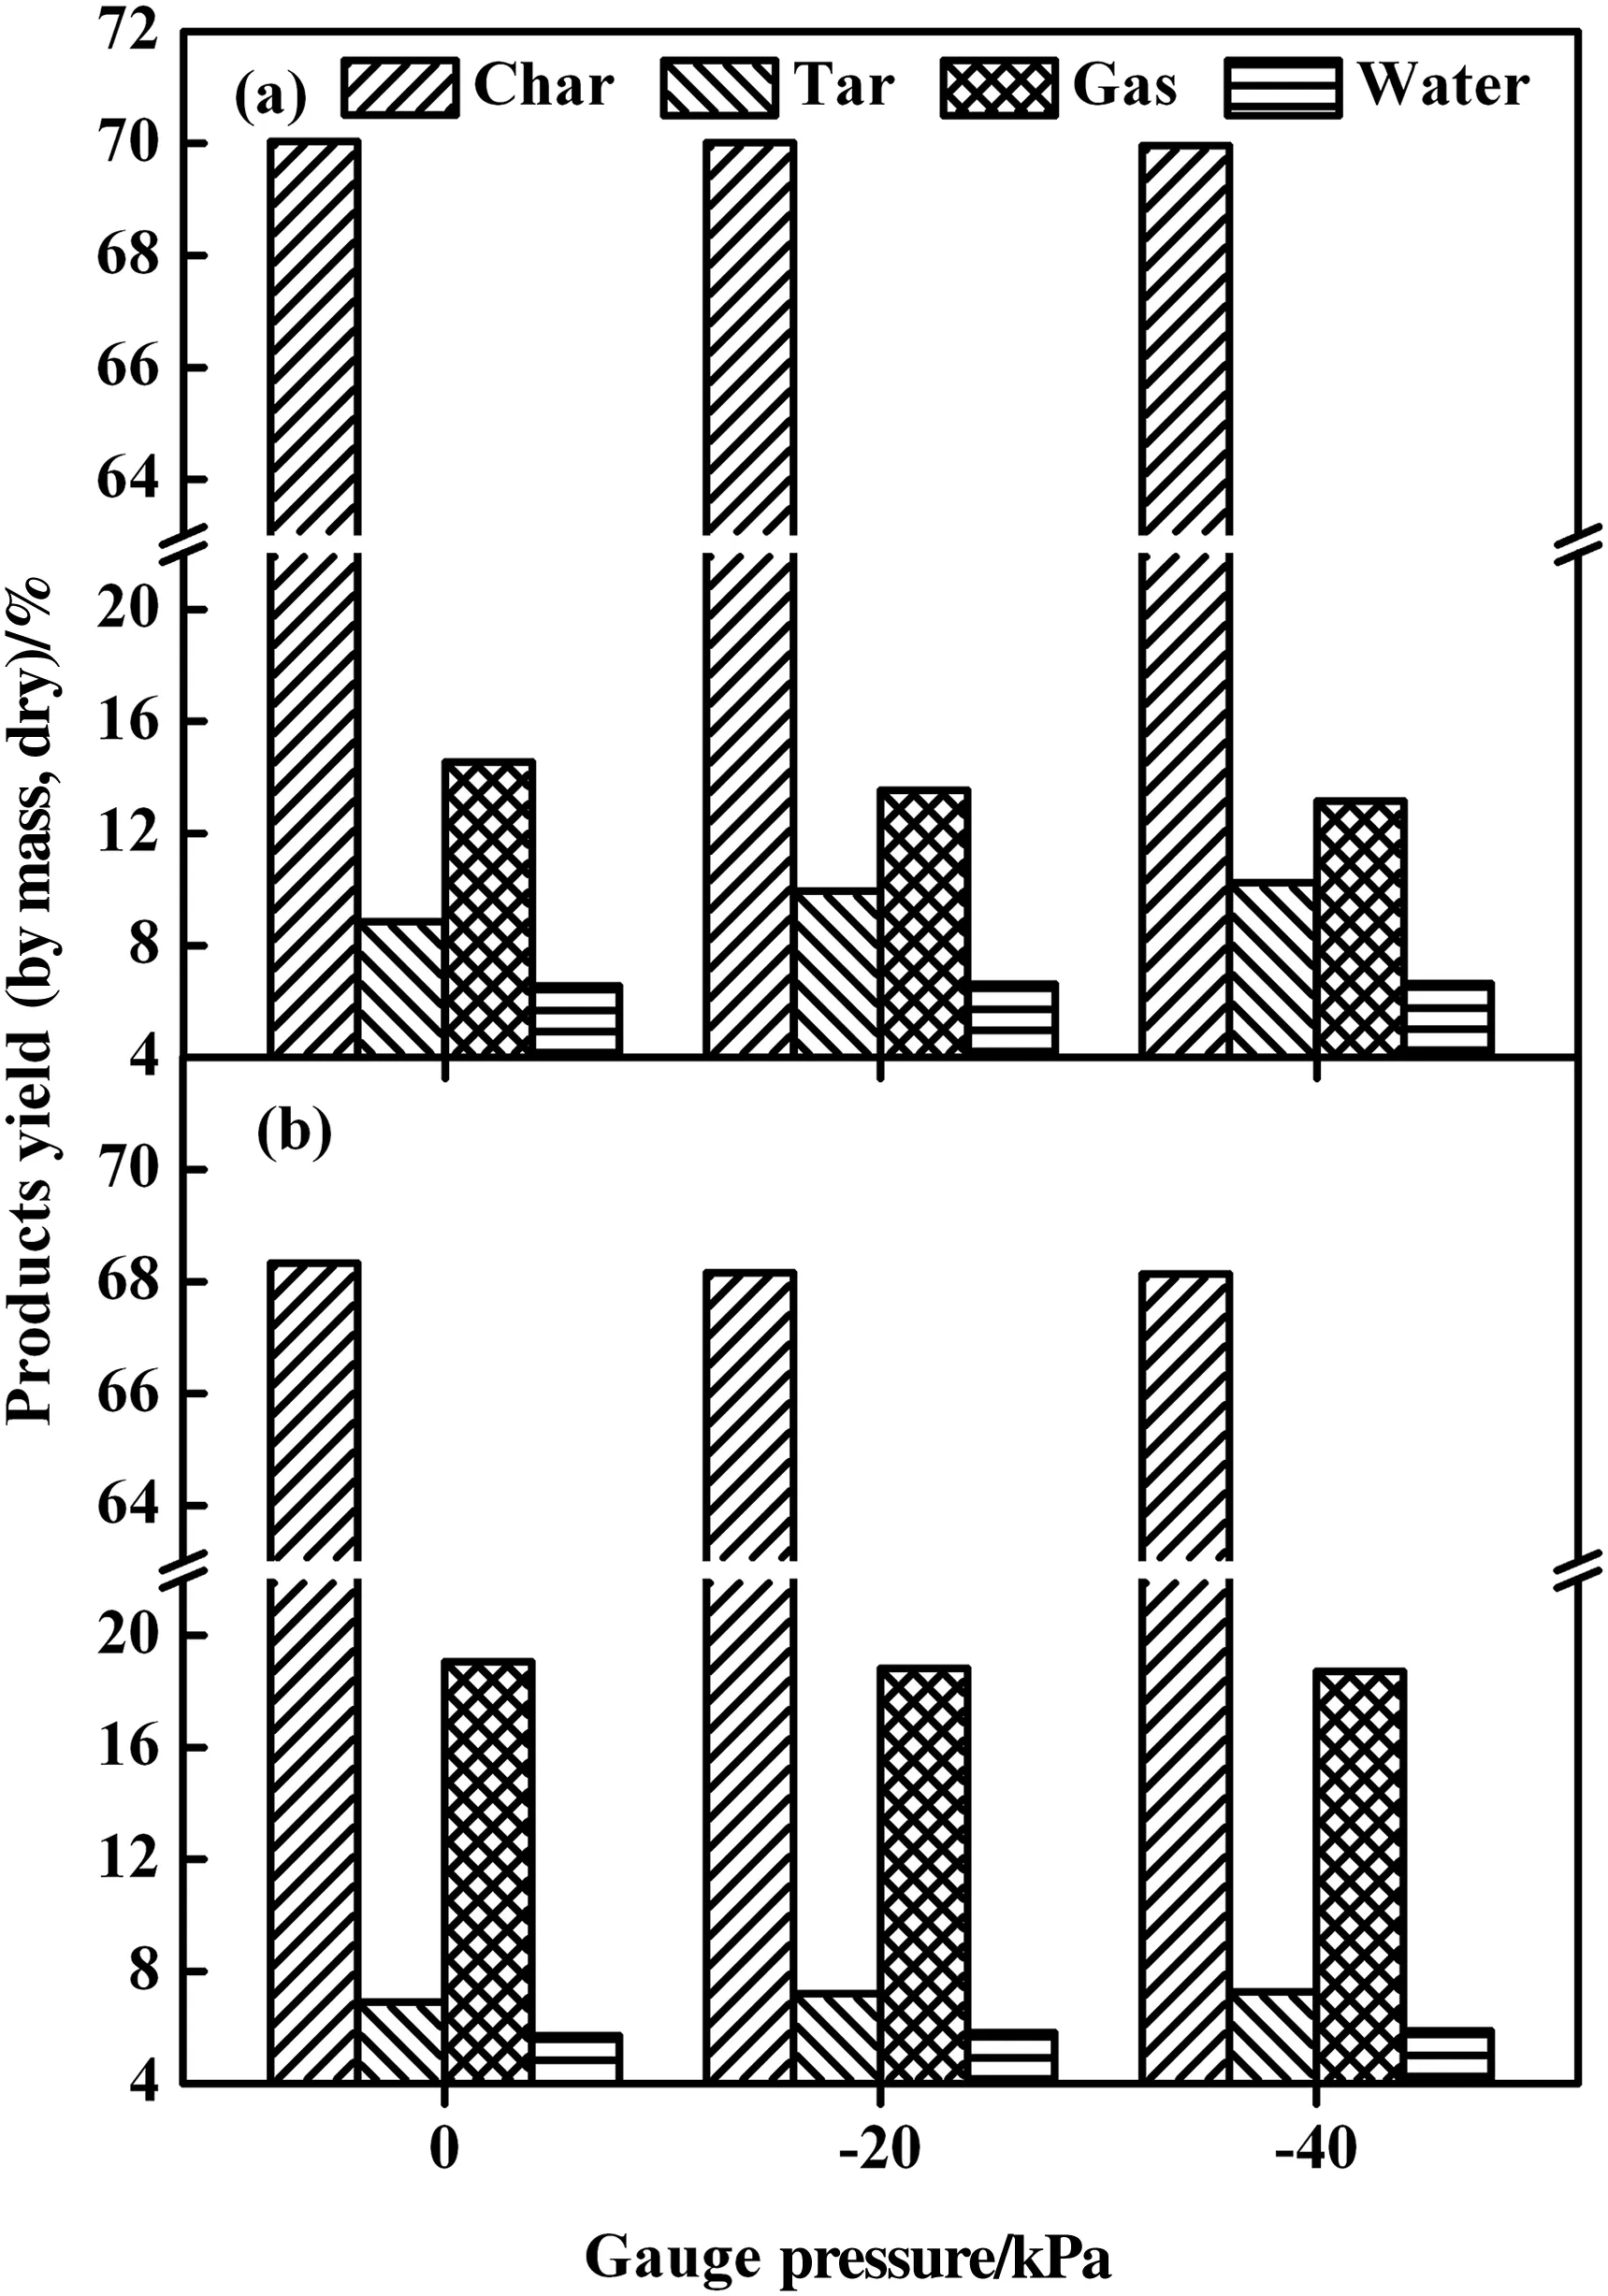
Fig.3.Synergy effect on products yield from reduced pressure((a)using internals;(b)without internals).

Fig.4.Synergetic effect on tar yield from reducing pressure and mounting internals(Aand B:reactors without and with internals,1 and 2:atmospheric pressure and−40 kPa,and b.p.:boiling point).

Fig.5.Composition of tar from reactors with and without internals under reduced pressures(A and B:reactors without and with internals,and 1 and 2:atmospheric pressure and−40 kPa).
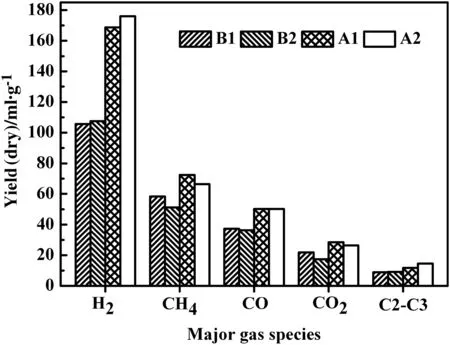
Fig.6.Yields of major gas species for pyrolysis in reactors with and without internals under reduced pressures(A and B:reactors without and with internals,and 1 and 2:atmospheric pressure and−40 kPa).
Comparing tests A1 and B1 at atmospheric pressure shown in Fig.4,the taryield in the reactor with internals(type B)was much higher than that in the reactor without internals(type A),which was 8.85 wt%and 6.90 wt%for B and A,respectively.This verifies again that the adopted internals greatly promoted tar production[30,32–34].The yields of lightoiland heavy oil both increased,demonstrating higher tar production and higher tar quality for coal pyrolysis in the reactor B with internals.Previous studies have proven that the internals greatly suppress secondary reactions of volatiles to facilitate tar production in terms of high yield and high quality[30,32].In the reactor without internals(type A),reducing its gauge pressure from 0 kPa(A1)to−40 kPa(A2)only slightly increased the tar yield from 6.90 wt%to 7.28 wt%.For tests B1 and B2,there was an obvious increase in tar yield when reducing operating pressure.The tar yield elevated from 8.85 wt%to 10.23 wt%or was with 15.59%relative increase due to the reduction of pressure from 0 kPa(B1)to−40 kPa(B2).The increased tar yield at reduced pressure(−40 kPa)was largely due to the formation of more heavy oil whose yield varied from 4.54 wt%to 5.69 wt%.
Thus,reducing pressure induced more obvious effect on pyrolysis in the reactor with particularly designed internals.This shows a combined or synergetic effect from using internals and reducing pressure on pyrolysis tar production.Indeed,a big increase by 3.33 wt%in absolute tar yield(6.90 wt%to 10.23 wt%)was observed for the test B2 comparing to that for A1.The obtained highest tar yield of 10.23 wt%is even higher than the Gray–King assay yield of 9.94 wt%.There should be synergetic action because reducing pressure facilitated the effects from using internals that enhance heating to coal and promote desired flow of primary product in the reactor(i.e.,from high temperature to low temperature).It could be seen from Fig.4 that the light oil yield in the run B1 and B2 are respectively 4.64 wt%and 4.54 wt%,which is higher than 3.67 wt%for A1 and 3.85 wt%for A2.These show essentially the suppression of secondary reactions occurring to primary volatiles,thus improving tar yield both in light oil and the total.
The result of a detailed analysis for tar by GC–MS is shown in Fig.5.The contents of aliphatics and phenols from reactor B were higher than those from reactor A,whereas the content of aromatics was reverse.This verifies again the low severity of secondary reactions in the reactor with internals(e.g.,cracking of aliphatics).After lowering the reaction pressure from 0 to−40 kPa in reactor B(with internals),it increased the content of aliphatics from 23.93%to 26.85%but decreased that of phenols from 30.42%to 27.56%.Thus,coal pyrolysis in the reactor with internals under reduced pressure facilitates the tar product with high aliphatics via its suppressing secondary reactions.For reactor A,the same pressure change caused the contents of aromatics and phenols to increase from 44.97%to 47.44%and from 22.78%to 25.32%,while it decreased the aliphatics content from 16.50%to 14.23%.In this reactor the formed pyrolysis volatiles flow from low-temperature center to high-temperature annulus,and lowering pressure further facilitated this flow of primary volatiles.Hayashiet al.[21]reported that there was a significant increase in the content of PAHs(polycyclic aromatics hydrocarbons)when primary pyrolysis product flows through a high temperature zone.
Fig.6 shows that the pyrolysis gas yields in reactor A(without internals)were higher than those in reactor B(with internals)due to the higher severity of secondary reactions in reactor A.For reactor A,its obviously high contents of H2and CH4should be attributed to its aliphatics cracking and aromatics dehydrogenation,while the slightly higher CO and CO2contents are mainly due to decomposition of oxygen-containing compounds.Reducing pressure caused slight increase in H2content but decrease in CH4and CO2contents.The ratio of alkene to alkane gas was about 1.1 for reactor A,much higher than that for reactor B(about 0.4).This further proves that secondary reactions are severer in reactor A but greatly reduced by using internals in reactor B.The influence of pressure on pyrolysis gas composition did not have big difference for reactors A and B.
Fig.7 demonstrates the realized heating rate to coalin reactors A and B under operating gauge pressures of 0 and−40 kPa.The time required to reach 550°C at central bed was shortened by half in reactor B comparing with that in reactor A.Reducing pressure decreased the heating rate to coal in reactor A but enhanced this heating in reactor B.The central gas collecting pipe regulated the flow direction of pyrolysis volatiles from reactor wall to center,and the heat carried by volatiles simultaneously contributed to the heating to coal.Reducing pressure strengthened such a gas flow to increase its induced heating to coal in reactor B.On the contrary,the flow of pyrolysis product in reactor A was from bed center to wall(low temperature to high temperature),and the enhanced flow thus retarded the heating to the coal at bed center.This also shows why reducing pressure had different effects for reactors A and B.

Fig.7.(a)Heating curve of coal bed layer under different operation conditions and(b)Flow pattern inside different reactors(Figure(b)from Ref.[30]),here A and B:reactors without and with internals,and 1 and 2:atmospheric pressure and−40 kPa.
3.2.Pressure in fl uence varying with temperature
Pyrolysis under different pressures was further performed in small fixed bed(Fig.2)to understand the effect of reducing pressure at different temperatures.As shown in Fig.8,the realized tar yield at 600°C was 8.44 wt%and 8.83 wt%at atmospheric pressure and a gauge pressure of−70 kPa,respectively.Thus,reducing pressure at this low pyrolysis temperature did not significantly promote tar generation.This limited effect of varying pressure should be due to the low degree secondary reactions at 600 °C.Raising temperature to 650 °C,the effect of reducing pressure on tar production turned to be obvious,raising tar yield from 5.96 wt%to 7.56 wt%corresponding to the gauge pressure decrease from 0 to−40 kPa.Nonetheless,the tar yield was almost a constant when further reducing pressure to−70 kPa.The higher pyrolysis temperature accelerated decomposition of organic matters in coal and speeded up volatile release.Hence,secondary reactions become severer at 650 °C than at 600 °C.For 700 °C,the tar yield slightly increased for reducing pressure to−40 kPa but an obvious increase for further to−70 kPa.At even higher temperature(i.e.,800°C),the tar yield increased from 4.87 wt%at 0 kPa to 6.02 wt%at−70 kPa.For coal pyrolysis the higher heating rate produce more volatiles and create a high concentration of volatile vapor in the reactor to provide more opportunities for reactions between volatiles and solid particles.Thus,there exists a kind of matching between volatile release rate and reaction pressure in determining the effect of varying pressure on tar yield.
The ultimate analysis of tar in Table 2 indicates that when pressure was reduced from 0 to−70 kPa its carbon content increased from 79.51 wt%to 81.92 wt%at 600°C,whereas its hydrogen content decreased gradually from 8.16 wt%to 7.03 wt%.Thus,the atomic H/C ratio of tar correspondingly decreased from 1.22 to 1.02.At 700°C the carbon weight content of tar decreased from 85.00 wt%to 82.84 wt%and its hydrogen content increased from 5.38 wt%to 6.38 wt%,thus increasing the atomic H/C ratio from 0.75 to 0.92.The variations of carbon and hydrogen contents in tar at 800°C were not much with varying gauge pressure so that its atomic H/C ratio was almost the same as 0.78.The H/C ratio of tar decreased with increasing pyrolysis temperature from 600 °C to 800 °C for the sake that more aliphatic compounds cracked and more aromatics were produced.The severity of secondary reactions at low temperature(i.e.,600°C)is low,and aromatics with mono-benzene rings or small ring systems can be produced and evaporated to occur mild secondary reactions[35].Reducing pressure facilitated evaporation of volatiles,especially tar precursors[26].Thus,the decreased H/C ratio with reducing pressure at 600°C should be primarily due to the increase in aromatics in tar.On the other hand,the increase in atomic H/C ratio at 700°C is directly due to the increase of aliphatics in tarcaused by reducing pressure and its suppression of secondary reactions,as will be shown further in Fig.12.
As shown in Fig.9,increasing pyrolysis temperature decreased the contents of aliphatics and phenols but greatly increased aromatics content in tar.For the ordinary pyrolysis at 0 kPa shown in Fig.9(a),almost all aliphatics in tar were cracked to produce gas at temperatures of 700 °C and 800 °C.Moreover,most of phenols were removed by thermal cracking at 800°C.Reducing pressure increased aliphatics in tar by shortening the residence time of volatiles in reactor and suppressing their secondary reactions.With reducing pressure from 0 to−70 kPa,the contents of aliphatics increased from 28.77%to 36.23%and from 0%to 17.15%at 600 and 700°C,respectively.Furthermore,high content of phenols was obtained under the gauge pressure of−70 kPa at700°C.Aromatics were the major compounds in tar at800°C by occupying 70%content,indicating the occurrence of serious secondary reactions to volatiles at this temperature.

Fig.8.Effect of reducing pressure on tar yield at varied pyrolysis temperatures.
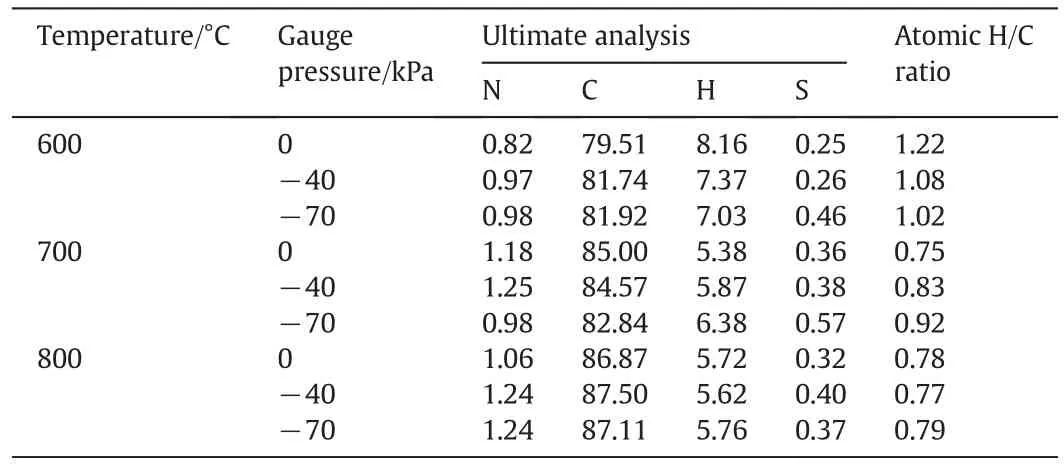
Table 2Ultimate analysis of tar from pyrolysis under different conditions

Fig.9.GC–MS composition of tar from pyrolysis at different temperatures and pressures of 0 and−70 kPa.
With respect to Raman analysis spectra of char exemplified in Fig.10,the information of position,width and ratio of intensities of the D(defect)and G(graphite)bands in 800–2000 cm−1were recorded to cover the first-order bands.These overlapping bands were split into five typical Lorentz bands by Origin 8.5 Multiple Peak Fit[36].The D1 band at about 1350 cm−1denotes large aromatics(A1gsymmetry)containing six or more fused benzene rings or disordered graphite structure[37].At 1620 cm−1,it is the D2 band involving in graphene layer[38].The D3 band at 1500 cm−1corresponds to small ring systems with less than six aromatic rings[39].The D4 band around 1200 cm−1represents the mixed sp2–sp3 bond forming at the periphery of crystallites or the C--C and C=C stretching vibrations of polyene-like structure[40].Finally,the Gband at1580 cm−1is attributed to the stretching vibration of ideal graphite lattice(E2gsymmetry)in aromatic layers of graphite crystallite[40].
Fig.10 presents the ratios of area for D1 band to G band and also for D1 band to D3 band obtained from curve fitting of Raman spectra for char obtained at different pyrolysis temperatures and pressures.The split peaks of Raman spectra for char from 650°C were added as an inset plot to illustrate the curve fitting result.The ratio ID1/IGdecreases with increasing graphitization maturation to indicate quantitatively the disordered carbon structure in char.One can see from Fig.10(a)that under atmospheric pressureID1/IGratio increased with raising pyrolysis temperature and reached a maximum at about 700°C.Then,the ratio slightly decreased until 800°C,in consistent with the result of Liet al.[41].Under reduced pressures,theID1/IGratios were higher than that under atmospheric pressure,and their difference was enlarged at higher temperatures.It implies that reducing pressure promoted the disordered extent of carbon structure by releasing larger molecules to form large fused-aromatics or net structure of fused aromatic rings in char.

Fig.10.Variation of I D1/I G and I D3/I D1 ratios with pyrolysis temperature under different pressures.
The ratioID3/ID1indicates the relative content of small aromatic rings(less than six benzene rings)against large fused aromatics(six or more benzene rings)[42–44].In Fig.10(b)thisID3/ID1ratio decreases with increasing temperature to indicate the fewer small-aromatic rings at high temperatures,as similarly reported in the literature[41,43,44].Like flash distillation,reducing pressure would indeed evaporate and export compounds of small aromatic rings than of large ones.Hence,it is easily understood that the ratio ID3/ID1at 600°C decreased from 0.66 for a gauge pressure 0 kPa to 0.38 for−40 kPa,and further to 0.34 for−70 kPa.However,for chars from temperatures above 650 °C such a difference due to reducing pressure was greatly diminished,possibly because the small aromatic rings are similarly released from charatsuch high temperatures under all the tested pressures.The result suggests that small aromatic structures are prone to be removed by thermal decomposition or tend to form rather large and stable ring structures at high temperatures and low pressures.
3.3.Justi fi cation of suppressed secondary reactions
In the tested small fixed bed reactor the highesttar yield appeared at about 600°C,and low tar yield was obtained at high pyrolysis temperature(e.g.,800°C)that leads to severe secondary reactions of pyrolysis volatiles[5].Fig.11 shows the product distribution of coal pyrolysis in the small reactor at700°C at different pressures.The taryield greatly increased from 5.63 wt%to 7.70 wt%,by 36.77%relatively,while the char yield decreased from 75.91 wt%to 72.36 wt%when the gauge pressure decreased from 0 to−70 kPa.The increased tar yield well matched the decrease of char yield,indicating that the increased tar product was attributed to the suppressed volatile cracking and coking reactions.The tar yield increase was not significant(only 0.59 wt%)when reducing pressure from 0 to−40 kPa but reached 1.49 wt%from−40 to−70 kPa.At−40 kPa the release of volatiles in pyrolysis may not well match secondary reactions.The rather lower pressure of−70 kPa would promote volatile release and reduce secondary reactions.Reducing pressure can also shorten residence time of pyrolysis volatiles in reactor to suppress secondary reactions.

Fig.11.Distribution of pyrolysis product at 700°C but different pressures(b.p.:boiling point).
In Fig.11 the gas yield increased slightly from 10.77 wt%to 12.01 wt%with reducing pressure from 0 to−40 kPa,and then remained to be a constant with the further lower pressure.The gas yield increase can be explained by the more released volatiles under reduced pressure[16,26].Indeed,reduced pressure surely promotes evaporation and diffusion of volatiles to make them easily escape.Although the gas yield did not vary obviously from−40 to−70 kPa,there was an evident reduction in methane yield.Thus,secondary reactions would occur at high levels under−40 kPa but much more suppressed by reducing pressure to−70 kPa.
Fig.12 presents the characterization results for tar using simulated distillation GC and GC–MS.In Fig.12(a)there was no aliphatics detected in tarofatmospheric pyrolysis at700°C but the aliphatics contents were 1.43%and 17.15%at−40 kPa and−70 kPa,respectively.The content of aromatics decreased from 59.20%to 28.52%with reducing the pressure from 0 to−70 kPa,while that of phenols firstly kept constant and then increased evidently.By secondary cracking and coking of pyrolysis volatiles,it can increase the content of aromatics through carbon structure condensation and transformation reactions.Reducing pressure would greatly suppress cracking and transformation of aliphatics and phenols.The content of heteroatom compounds in tar from reduced-pressure pyrolysis was higher,showing also the suppressed cracking or hydrocracking reactions to volatiles.Fig.12(b)shows that the content of heavy oil(b.p≥350°C)increased with reducing pressure but that of light oil(b.p.< 350 °C)decreased from 37.87%to 29.64%.In terms of Fig.11,the yield of heavy oil increased from3.50 wt%at 0 kPa to 4.52 wt%at−40 kPa,and further to 5.42 wt%at−70 kPa.Against this the yield of light oil decreased from 2.13 wt%at 0 kPa to 1.70 wt%at−40 kPa,and to a tiny content at−70 kPa.Consequently,reducing pressure definitely inhibit the occurrence of secondary reactions by intensifying the release and escape of heavy oil compounds.

Fig.12.Variation of composition given by(a)GC–MS and(b)Simulated distillation GC for tar from pyrolysis at a temperature of 700°C but different reduced pressures(b.p.:boiling point).
Table 3 shows the proximate and ultimate analyses of char from pyrolysis at different pressures.The carbon content increased slightly from 91.43 wt%at 0 kPa to 91.82 wt%at−70 kPa,while the content of hydrogen slightly decreased to cause a slight decrease in the atomic H/C ratio of char.The contents of N and S did not much vary with the pyrolysis pressure.Oxygen content in tar exhibited a decreasing tendency with reducing pressure,thus reducing pressure promoted dehydrogenation of char.Proximate analysis shown further that the fixed carbon content of char obviously decreased from 95.54 wt%to 93.66 wt%against the pressure variation from 0 to−70 kPa.The result complies with the demonstration in Figs.11 and 12.Overall,coal pyrolysis under reduced pressure promoted the release of volatiles and suppressed secondary reactions on char surface.These cause high volatile production under reduced pressure,but Table 3 shows that the char from low-pressure pyrolysis has slightly higher remaining volatile content.It is because that under reduced pressure there is also higher,such as about 5 wt%,volatile content in the same high-volatile bituminous coal[23]so that more volatile is possibly remained in the char of low-pressure pyrolysis.

Table 3Proximate and ultimate analyses ofchar obtained from pyrolysis at700°C(wt%,described as follows)
Fig.13 shows the yields of major gas species from pyrolysis at700°C at different pressures.The hydrogen yield monotonously increased from67.05 ml·g−1to 81.59 ml·g−1with decreasing the gauge pressure from 0 to−70 kPa,which may alter decomposition mode of coal molecules based on hydrogen donation[45].There are possibly high concentrations active reactants escaping from bond constraints,which also participate in secondary reactions.The methane yield gradually decreased from 62.05 ml·g−1at 0 kPa to 56.29 ml·g−1at−70 kPa.Methane should be hard to crack and form soot at 700°C[20],and the slightly lower methane production under vacuum condition thus may be due to the higher hydrogen production[46].The yield of CO only slightly increased with lowering pressure,while the CO2yield gradually increased from 5.16 ml·g−1at 0 kPa to 6.03 ml·g−1at−40 kPa,and further to 9.61 ml·g−1at−70 kPa.Atreduced pressure,more carboxyls should have been removed than at atmospheric pressure[15],complying with the decreased oxygen content in char shown in Table 3.The yield of hydrocarbons C2–C3 increased with decreasing gauge pressure from0 to−40 kPa,and further constantly remained at−70 kPa.Reducing pressure caused quicker volatile release and suppressed secondary reactions to facilitate thus the formation of hydrocarbons,especially light species.
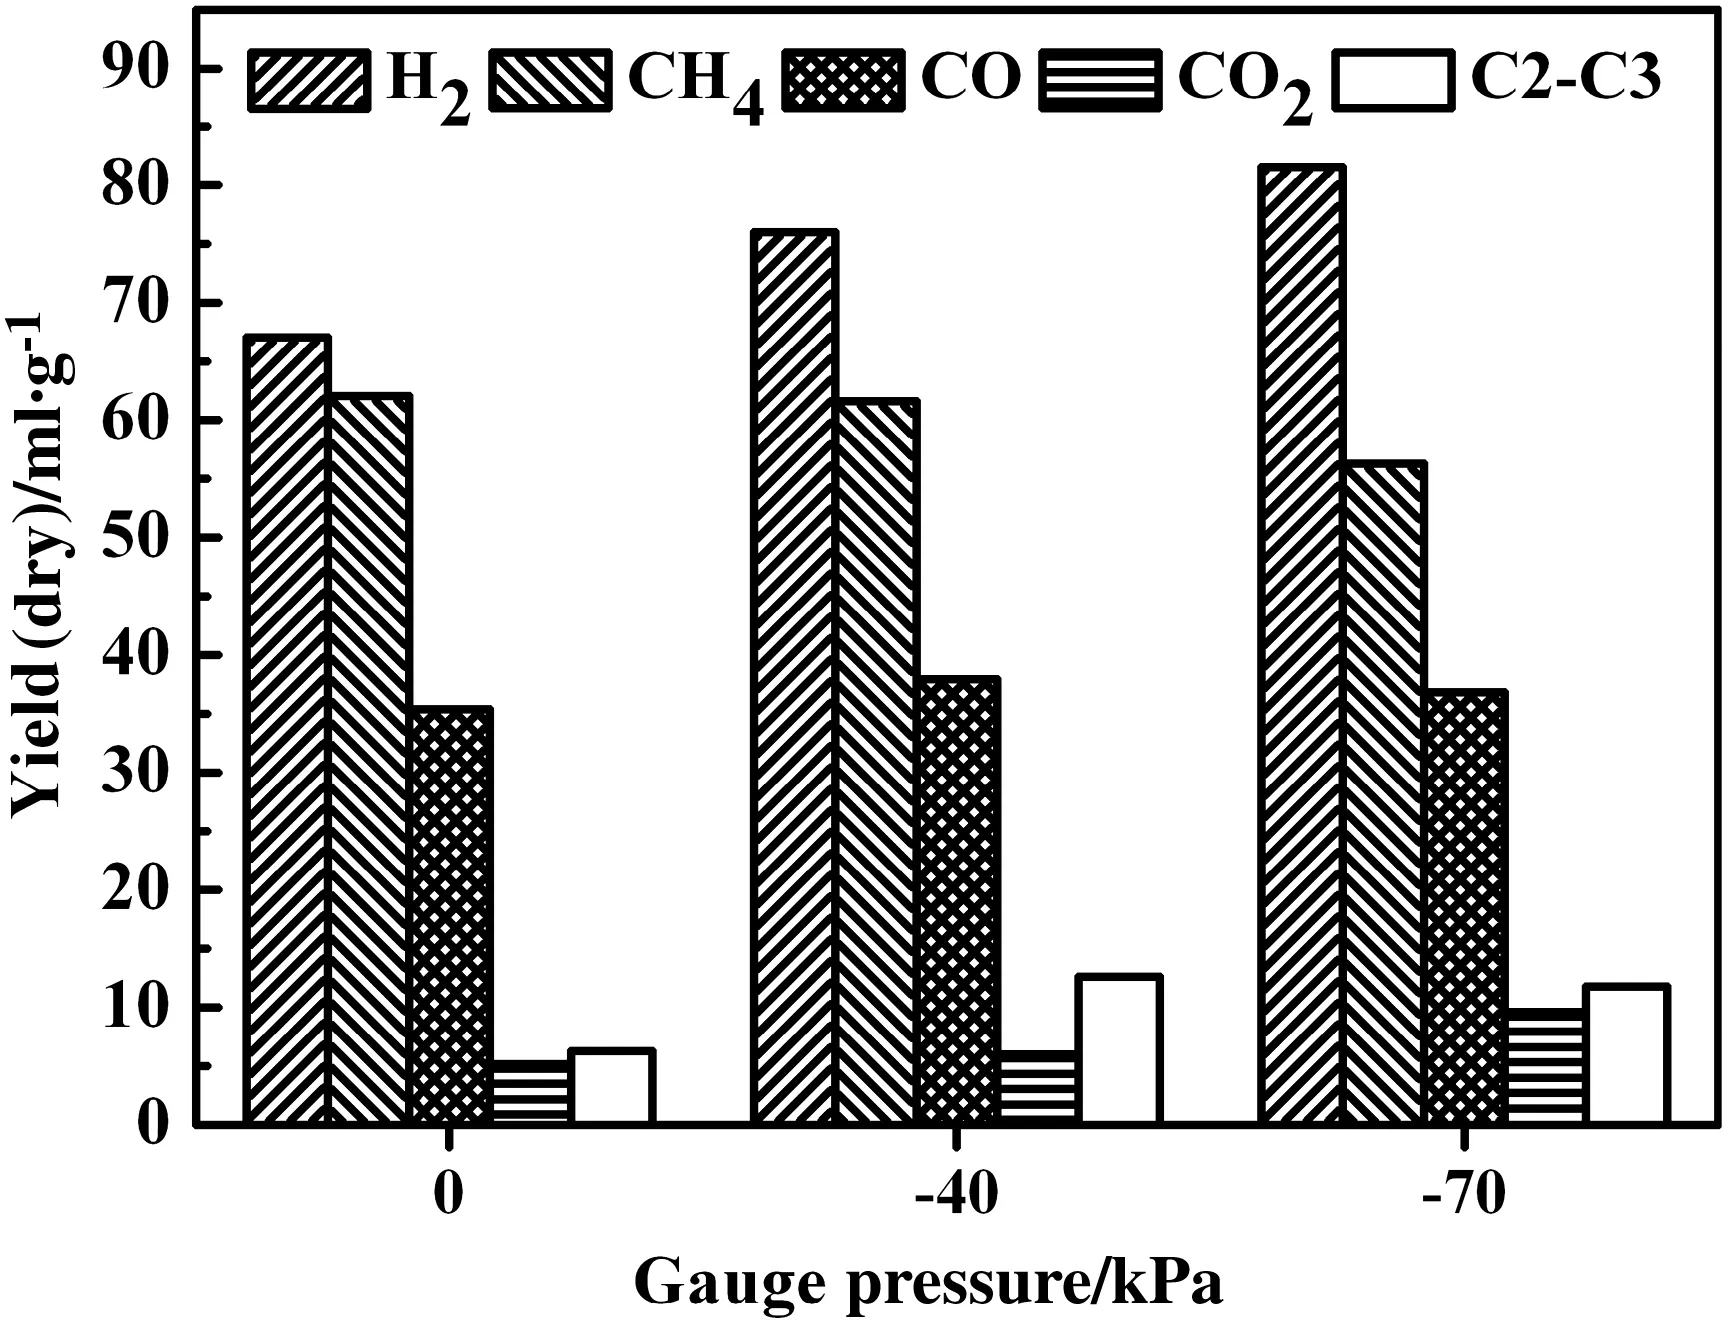
Fig.13.Yields of major gas species for pyrolysis at 700°C but different reduced pressures.
4.Conclusions
Reducing operating pressure from 0 to−40 kPa in a bench-scale fixed bed reactor with particular internals(type B,1200 g coal sample)increased tar yield from 8.85 wt%to 10.23 wt%,and the latter is also higher than 9.94 wt%of the Gray–King assay yield.The tar yield variation was from 6.90 wt%to 7.28 wt%for the same pressure reduction and in the same reactor but without internals.Therefore,there is definitely synergetic effect on coal pyrolysis between reducing pressure and mounting the particularly designed internals.Their major effect on pyrolysis is analyzed to be the suppression of secondary reactions such as cracking and coking occurring to volatiles in the reactor.This was further validated by detailed pyrolysis tests in a small fixed bed treating 20 g coals ample under different temperatures and reduced pressures.It was shown that the effect of reducing pressure on tar production and quality is related to the release rate of volatiles determined by reaction temperature exclusively.Consequently,the work clarified actually the feasible ways for improving yield and quality of coal tar in fixed bed pyrolysis.
[1]C.R.Tian,China's oil&gas imports and exports in 2014,China Oil Gas23(3)(2015)57–67.
[2]X.F.Bai,Discussion on utilization and development of improving quality technology of lignite and low rank bituminous coal in China,Coal Qual.Technol.6(2010)9–11(in Chinese).
[3]D.X.Zhang,Fundamental and Application of Coal to Oil Technologies,Shanghai Science and Technology Press,Shanghai,2013(in Chinese).
[4]J.Hayashi,K.Nakagawa,K.Kusakabe,S.Morooka,M.Yumura,Change in molecular structure of flash pyrolysis tar by secondary reaction in a fluidized bed reactor,Fuel Process.Technol.30(3)(1992)237–248.
[5]W.C.Xu,A.Tomita,The effects of temperature and residence time on the secondary reactions of volatiles from coal pyrolysis,Fuel Process.Technol.21(1)(1989)25–37.
[6]H.P.Yang,H.P.Chen,F.D.Ju,R.Yan,S.H.Zhang,In fluence of pressure on coal pyrolysis and char gasification,Energy Fuel21(6)(2007)3165–3170.
[7]R.Kandiyoti,A.A.Herod,K.D.Bartle,Solid Fuels and Heavy Hydrocarbon Liquids:Thermal Characterisation and Analysis,Elsevier Science,London,2006.
[8]M.R.Khan,A literature survey and an experimental study of coal devolatilization at mild and severe conditions:influences of heating rate,temperature,and reactor type on products yield and composition,Fuel68(12)(1989)1522–1531.
[9]P.J.Wang,J.Li,J.H.Liu,S.W.Zhu,H.Q.Hu,Analysis of coal tar derived from pyrolysis at different atmospheres,Fuel104(2)(2013)14–21.
[10]Y.K.Lu,L.P.Chang,K.C.Xie,Effects of coal structure on its pyrolysis characteristics under N2 and Ar atmosphere,Energy Sources23(8)(2001)717–725.
[11]D.Zeng,S.T.Hu,A.N.Sayre,H.Sarv,On the rank-dependence of coal tar secondary reactions,Proc.Combust.Inst.33(2)(2011)1707–1714.
[12]D.B.Anthony,J.B.Howard,H.C.Hottel,H.P.Meissner,Rapid devolatilization of pulverized coal,Symp.Combust.15(1975)1303–1317.
[13]C.Roy,B.D.C.Kalkreuth,Vacuum pyrolysis of prince-mine coal,Nova-Scotia,Canada,Fuel64(12)(1985)1662–1666.
[14]T.P.Grif fin,Intrapartical Secondary Reactions of Tar during Bituminous Coal Pyrolysis(Ph.D.Thesis)Massachusetts Institute of Technology,US,1989.
[15]M.A.Serio,Secondary Reactions of Tar in Coal Pyrolysis(Ph.D.Thesis)Massachusetts Institute of Technology,US,1984.
[16]M.A.Serio,D.G.Hamblen,J.R.Markham,P.R.Solomon,Kinetics of volatile product evolution in coal pyrolysis:Experiment and theory,Energy Fuel1(2)(1987)138–152.
[17]P.Gilot,B.R.Stanmore,A theoretical study of the mechanism of intraparticle mass transport of volatiles during pyrolysis of nonsoftening coal.Application to secondary tar reactions,Energy Fuel9(1)(1995)126–135.
[18]T.S.Pather,W.A.Al-Masry,The influence of bed depth on secondary reactions during slow pyrolysis of coal,J.Anal.Appl.Pyrolysis37(1)(1996)83–94.
[19]M.A.Serio,W.A.Peters,J.B.Howard,Kinetics of vapor-phase secondary reactions of prompt coal pyrolysis tar,Ind.Eng.Chem.Res.26(9)(1987)1831–1838.
[20]M.A.Serio,J.B.Howard,W.A.Peters,K.Sawada,Global kinetics of primary and secondary reactions in hydrocarbon gas evolution from coal pyrolysis,Am.Chem.J.(U.S.)29(1984)2.
[21]J.Hayashi,T.Kawakami,T.Taniguchi,K.Kusakabe,S.Morooka,M.Yumura,Control of molecular composition of tar by secondary reaction in fluidized-bed pyrolysis of a subbituminous coal,Energy Fuel7(1)(1993)57–66.
[22]G.R.Gavalas,M.Oka,Characterization of the heavy products of coal pyrolysis,Fuel57(5)(1978)285–288.
[23]E.M.Suuberg,Rapid Pyrolysis and Hydropyrolysis ofCoal(Ph.D.Thesis)Massachusetts Institute of Technology,US,1978.
[24]P.E.Unger,E.M.Suuberg,Molecular weight distributions of tars produced by flash pyrolysis of coals,Fuel63(5)(1984)606–611.
[25]S.Niksa,W.B.Russel,D.A.Saville,Time-resolved weight loss kinetics for the rapid devolatilization of a bituminous coal,Symp.Combust.19(1)(1982)1151–1157.
[26]C.Z.Li,K.D.Bartle,R.Kandiyoti,Vacuum pyrolysis of Maceral concentrates in a wiremesh reactor,Fuel72(11)(1993)1459–1468.
[27]C.Roy,M.Hébert,W.Kalkreuth,A.E.Schwerdtfeger,Conversion characteristics of Canadian coals subjected to vacuum pyrolysis treatment,Fuel77(3)(1998)197–208.
[28]T.Hirajima,E.W.Chan,S.G.Whiteway,Vacuum and atmospheric-pressure TGA on an eastern Canadian coal,Fuel65(6)(1986)844–848.
[29]D.G.Lai,Y.Shi,S.L.Geng,Z.H.Chen,S.Q.Gao,J.H.Zhan,G.W.Xu,Secondary reactions in oil shale pyrolysis by solid heat carrier in a moving bed with internals,Fuel173(2016)138–145.
[30]C.Zhang,R.C.Wu,G.W.Xu,Coalpyrolysis for high-quality tar in a fixed-bed pyrolyzer enhanced with internals,Energy Fuel28(1)(2014)236–244.
[31]S.Siramard,L.X.Lin,C.Zhang,D.G.Lai,S.Cheng,G.W.Xu,Oil shale pyrolysis in indirectly heated fixed bed with internals under reduced pressure,Fuel Process.Technol.148(2016)248–255.
[32]C.Zhang,R.C.Wu,E.F.Hu,S.Y.Liu,G.W.Xu,Coal pyrolysis for high-quality tar and gas in 100 kg fixed bed enhanced with internals,Energy Fuel28(2014)7294–7302.
[33]L.X.Lin,C.Zhang,H.J.Li,D.G.Lai,G.W.Xu,Pyrolysis in indirectly heated fixed bed with internals:the first application to oil shale,Fuel Process.Technol.138(2015)147–155.
[34]D.G.Lai,Z.H.Chen,Y.Shi,L.X.Lin,J.H.Zhan,S.Q.Gao,G.W.Xu,Pyrolysis of oil shale by solid heat carrier in an innovative moving bed with internals,Fuel159(2015)943–951.
[35]M.Vahrman,R.Watts,The smaller molecules obtainable from coal and their significance:Part 6.Hydrocarbons from coal heated in thin layers,Fuel51(3)(1972)235–241.
[36]B.Wang,L.S.Sun,S.Su,J.Xiang,S.Hu,H.Fei,Char structural evolution during pyrolysis and its influence on combustion reactivity in air and oxy-fuel conditions,Energy Fuel26(3)(2012).
[37]R.Azargohar,S.Nanda,J.A.Kozinski,A.K.Dalai,R.Sutarto,Effects of temperature on the physicochemical characteristics of fast pyrolysis bio-chars derived from Canadian waste biomass,Fuel125(2014)90–100.
[38]O.Beyssac,B.Goffé,J.P.Petitet,E.Froigneux,M.Moreau,J.N.Rouzaud,On the characterization of disordered and heterogeneous carbonaceous materials by Raman spectroscopy,Spectrochim.Acta A Mol.Biomol.Spectrosc.59(10)(2003)2267–2276.
[39]A.Cuesta,P.Dhamelincourt,J.Laureyns,A.Martínez-Alonso,J.Tascón,Raman microprobe studies on carbon materials,Carbon32(8)(1994)1523–1532.
[40]S.Y.Wu,S.Huang,L.Y.Ji,Y.Q.Wu,J.S.Gao,Structure characteristics and gasification activity of residual carbon from entrained- flow coal gasification slag,Fuel122(2014)67–75.
[41]X.J.Li,J.Hayashi,C.Z.Li,FT-Raman spectroscopic study of the evolution of char structure during the pyrolysis of a Victorian brown coal,Fuel85(12–13)(2006)1700–1707.
[42]H.L.Tay,S.Kajitani,S.Zhang,C.Z.Li,Effects of gasifying agent on the evolution of char structure during the gasification of Victorian brown coal,Fuel103(1)(2013)22–28.
[43]M.J.Wang,D.G.Roberts,M.A.Kochanek,D.J.Harris,L.P.Chang,C.Z.Li,Raman spectroscopic investigations into links between intrinsic reactivity and char chemical structure,Energy Fuel28(1)(2013)285–290.
[44]X.Guo,H.L.Tay,S.Zhang,C.Z.Li,Changes in char structure during the gasification of a Victorian Brown coal in steam and oxygen at 800°C,Energy Fuel22(6)(2008)4034–4038.
[45]B.Juettner,H.C.Howard,Pyrolysis of coal—Thermal decomposition and distillation of a coal in high vacuum,Ind.Eng.Chem.26(1934)1115–1118.
[46]M.Makino,Y.Toda,Factors affecting methane evolution on pyrolysis of coal under pressure,Fuel58(3)(1979)231–234.
杂志排行
Chinese Journal of Chemical Engineering的其它文章
- Corrosion performance of Al–Al2O3 cold sprayed coatings on mild carbon steel pipe under thermal insulation☆
- Modelling of adsorption of textile dyes over multi-walled carbon nanotubes:Equilibrium and kinetic
- Integrated ozone–photo–Fenton process for the removal of pollutant from industrial wastewater☆
- Multi-objective regulation in autohydrolysis process of corn stover by liquid hot water pretreatment
- Development of a new cleaner production process for cassava ethanol☆
- Preparation of cross-linked enzyme aggregates of nitrile hydratase ES-NHT-118 from E.coli by macromolecular cross-linking agent☆