A novel model for multi-plant mixed heavy crude oils refinery planning
2017-05-28XiaoqiaoHuangYangdongHuLijuanSongYuzhenZhangDongkuiChen
Xiaoqiao Huang ,Yangdong Hu *,Lijuan Song ,3,Yuzhen Zhang ,Dongkui Chen
1 College of Chemical Engineering,China University of Petroleum(East China),Qingdao,266100,China
2 College of Chemistry and Chemical Engineering,Ocean University of China,Qingdao 266100,China
3 Liaoning Key Laboratory of Petrochemical Engineering,Liaoning Shihua University,Fushun 113001,China
4 PetroChina Qinhuangdao Fuel Oil Asphalt Co.,Ltd,Qinhuangdao 066000,China
1.Introduction
Process modeling is the basis for refinery optimizing planning,which includes two types of models:rigorous and empirical models[1].In rigorous methods,crude oil is divided into dozens of pseudo components[2].Each pseudo-component is considered as a pure component.The CDU is modeled thereafter by solving material equations,phase equilibrium equations,normalization equations and enthalpy balance equations.Although accurate results for processing units can be obtained by using rigorous models,their complexity and tedious calculations prevent them from being regularly applied in refinery planning[3,4].
Empirical methods include fixed yield method,Watkins method,Lin Shixiong method,swing-cut model,etc.In fixed yield method,yields and properties of CDU fractions are considered as constant[5,6].The total production is the combination of each fraction at identical temperature range.In Watkins and Lin Shixiong methods,empirical correlations are employed to establish both mass and energy balances for the CDU[7,8].Depending on the true boiling point data(TBP)of crude oil,operating modes and product ASTM data,the lower and upper bounds for the TBP cut points can be estimated.In swing-cut model,several swing cuts are defined between two adjacent fractions,i.e.,gross overhead(GO)and heavy naphtha(HN).A swing cut can be moved to its adjacent heavier or lighter distillate,which is determined by different operating modes[9,10].Zhanget al.highlighted the conventional swing-cut model considering the existence of fractions with the same qualities swinging between adjacent cuts using a volume ratio on crude-oil feed[11].Liet al.determined the upper and lower bounds for the yields based on different operational modes in the distillation tower[12].Menezeset al.required corresponding light and heavy swing-cuts with appropriately varying qualities to better predict quantities and qualities for the distilled products[13].
In Watkins and swing-cut models,product American Society for Testing Materials(ASTM)boiling ranges should be converted into TBP boiling ranges,while the latter are always overlapping in the case of two adjacent CDU fractions.The TBP cut-point is therefore defined as the mid-point of the TBP overlapping temperatures.Procedures of these methods are as shown in Fig.1.Typically,association graphs or empirical data are required to complete this process,causing complex and inaccurate operations.In addition,utilization of the initial boiling point and the end point respectively to represent the nature of the product is considered to be inaccurate as well.
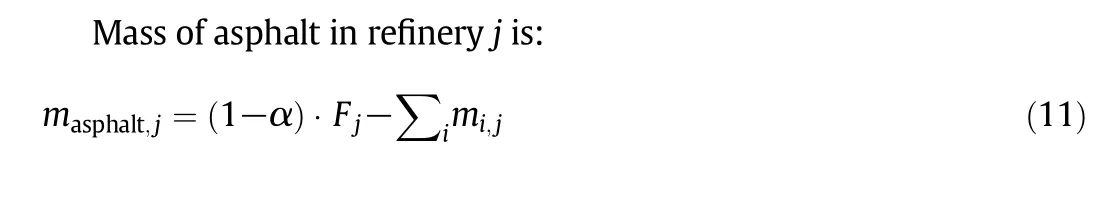
The main product of heavy crude oil refining is asphalt,which accounts for approx.60%of the total production.Both cutting point and cutting range of light fractions vary greatly with light oil.Differ from the light oil refining,the quality control of the vacuum residuum(asphalt),represented by penetration and ductility,is essentially required.However,both penetration and ductility are difficult in connection with other physical properties.In this paper,based on the method adopted in production,the asphalt quality is dominated by controlling the total yield.At the same ratio of crude oil,both the total yield and the product distribution vary with different atmospheric,vacuum equipment parameters and operating parameters.It is therefore necessary to establish a new model for multi-plant mixed heavy crude oil refinery.
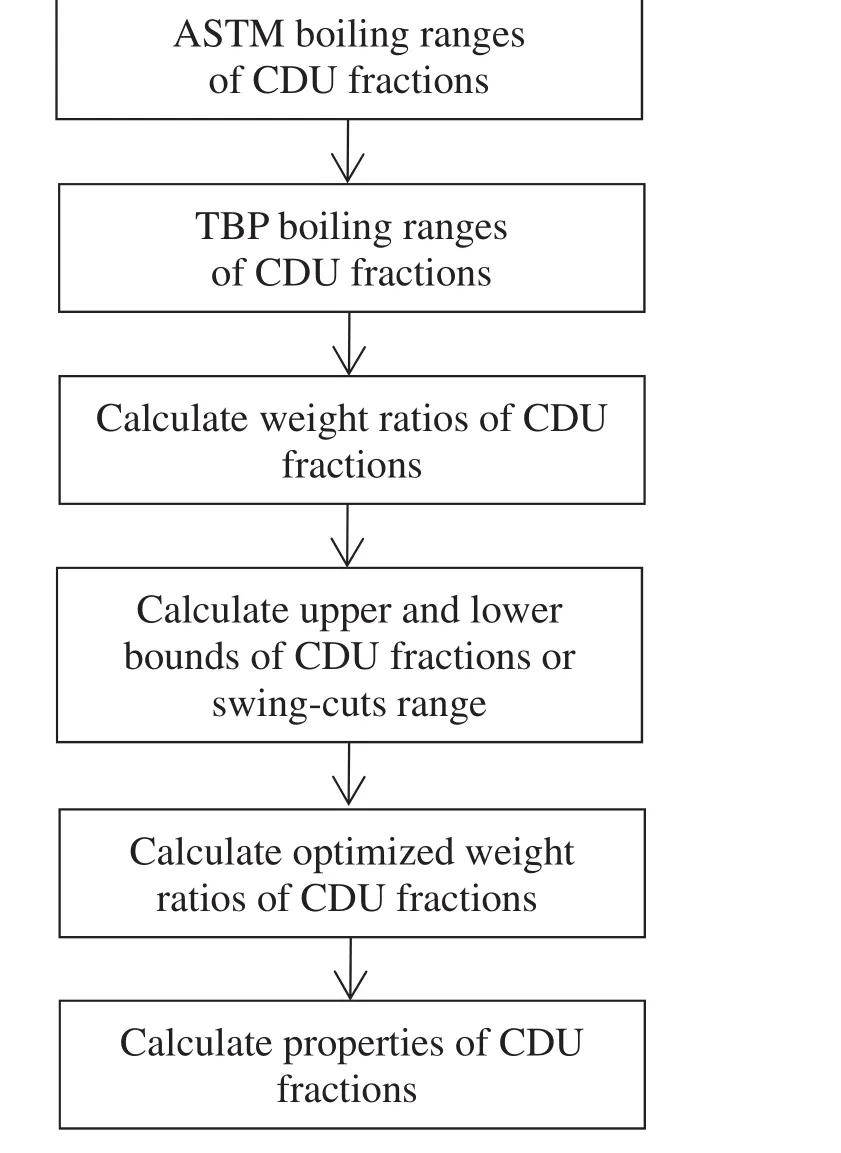
Fig.1.Procedure for Re finery process models by Watkins and swing-cut models.
2.Multi-re finery Planning Model
Based on the characteristics of heavy crude oil refinery,a novel model for mixed heavy crude refinery and multi-plant planning is proposed(Fig.2).Detailed steps of model procedure are given as follows:
(1).The relationship of each refinery between total yield and mixing ratio is determined by plant and simulated data.As the residue of vacuum distillation,asphalt is the main product of heavy crude oil refinery,whereas the quality of which is difficult to be directly predicted.Based on production experience,a simple and practical approach is derived by controlling the total light fraction yield to control the quality of asphalt.The total yield includes all light fractions yields of atmospheric and vacuum distillation,and the relationship of which between different mixing ratios is obtained by regression analysis of the plant data.In case of an insufficient plant data,rigorous simulation data is expected to be a good supplementary.In light oil refining,step 1 can be omitted if there is no quality requirement for the vacuum residue.
(2).As long as both initial value of mixing ratio and TBP boiling ranges are given,yields of CDU fractions can be calculated by TBP fitted curves,while properties can be calculated by property fitted curves.The cutting temperature and cumulative yield of each crude oil can be obtained by crude oil evaluation data.For mixing oil refinery,the final yield of a product can be expressed by a sum of the yield of each crude,in combination with mixing ratio.The yield of the last light fraction can be derived by a difference of the total yield and other light oil products yield.The properties of narrow fractions can also be obtained from the crude oil evaluation data.However,a light product might be composed of multiple or part of narrow component.In this case,calculation of the property of a certain product is possible only by converting narrow component data into the relationship between the cumulative property and the cumulative yield.
(3).Determining whether the product properties conform to the requirements.If not,adjust the TBP boiling ranges of CDU fractions.Combining with the economic model and constraint equations,optimized mass of CDU fractions can be obtained.
(4).Adjusting mixing ratio of crude oils to get the optimal value.
To demonstrate the process of modeling,a refining company which consists of four local refineries,i.e.,A,B,C and D,is used as an example.The main crudes are Merey crude oil(MR)and Boscan crude oil(BSK)with density of 0.9561 g·cm−3(20 °C)and 0.9974 g·cm−3(20 °C),respectively.Fractions with temperature greater than 500°C are accounted for 48.89 wt%and 64.32 wt%,respectively.The main products are heavy traffic paving petroleum asphalt and modified asphalt[14].Light CDU fractions are light gasoline(LG),heavy gasoline(HG),light distillate(LD),heavy distillate(HD)and diesel oil(DO).The mixing ratio is mole ratio or mass ratio of MR and BSK.But in this paper,to facilitate calculation and expression,mass fraction of MR is used as the mixing ratio.
2.1.Determination of total yield curve
Simulation of the CDU was performed by implementing the pseudo component method in process simulation software,Aspen.For petroleum refining,the most commonly used property model is BK-10.By inputting sort and quantity of crude oil,TBP,API data,equipment and operating parameters of atmospheric,vacuum tower,atmospheric,vacuum furnace and the amount of each side product,the temperature pro file of atmospheric/vacuum tower and product composition are obtained.Giving a ratio of MR and BSK as 7:3,both yield and product distribution of each refinery are listed in Table 1.
As shown in Table 1,despite an identical mixing ratio being applied,the total yield and the product distribution of each refinery are different.Therefore,the plant equipment and operating parameters on the influence of the refining process must be considered.Different process models are hence required for multi-re finery planning.
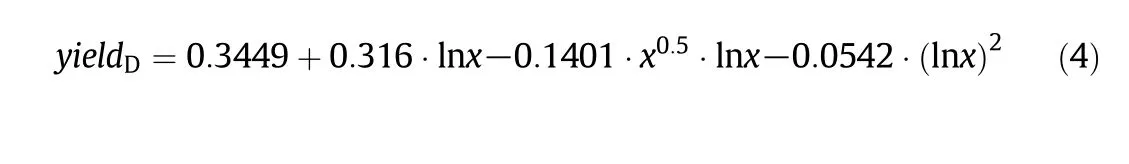
By varying the input composition of crude oil,the relations between total distillation yield and the amount of product at different mixing ratios were obtained.The relations between total yield and mixing ratio were derived from these simulation data,given by Eqs.(1)–(4)and Fig.3.
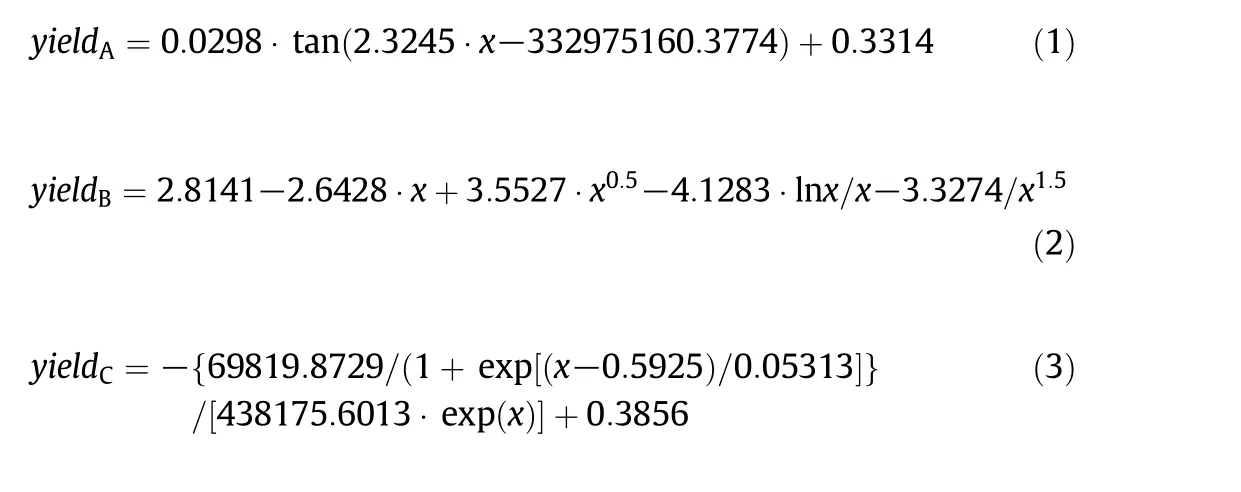
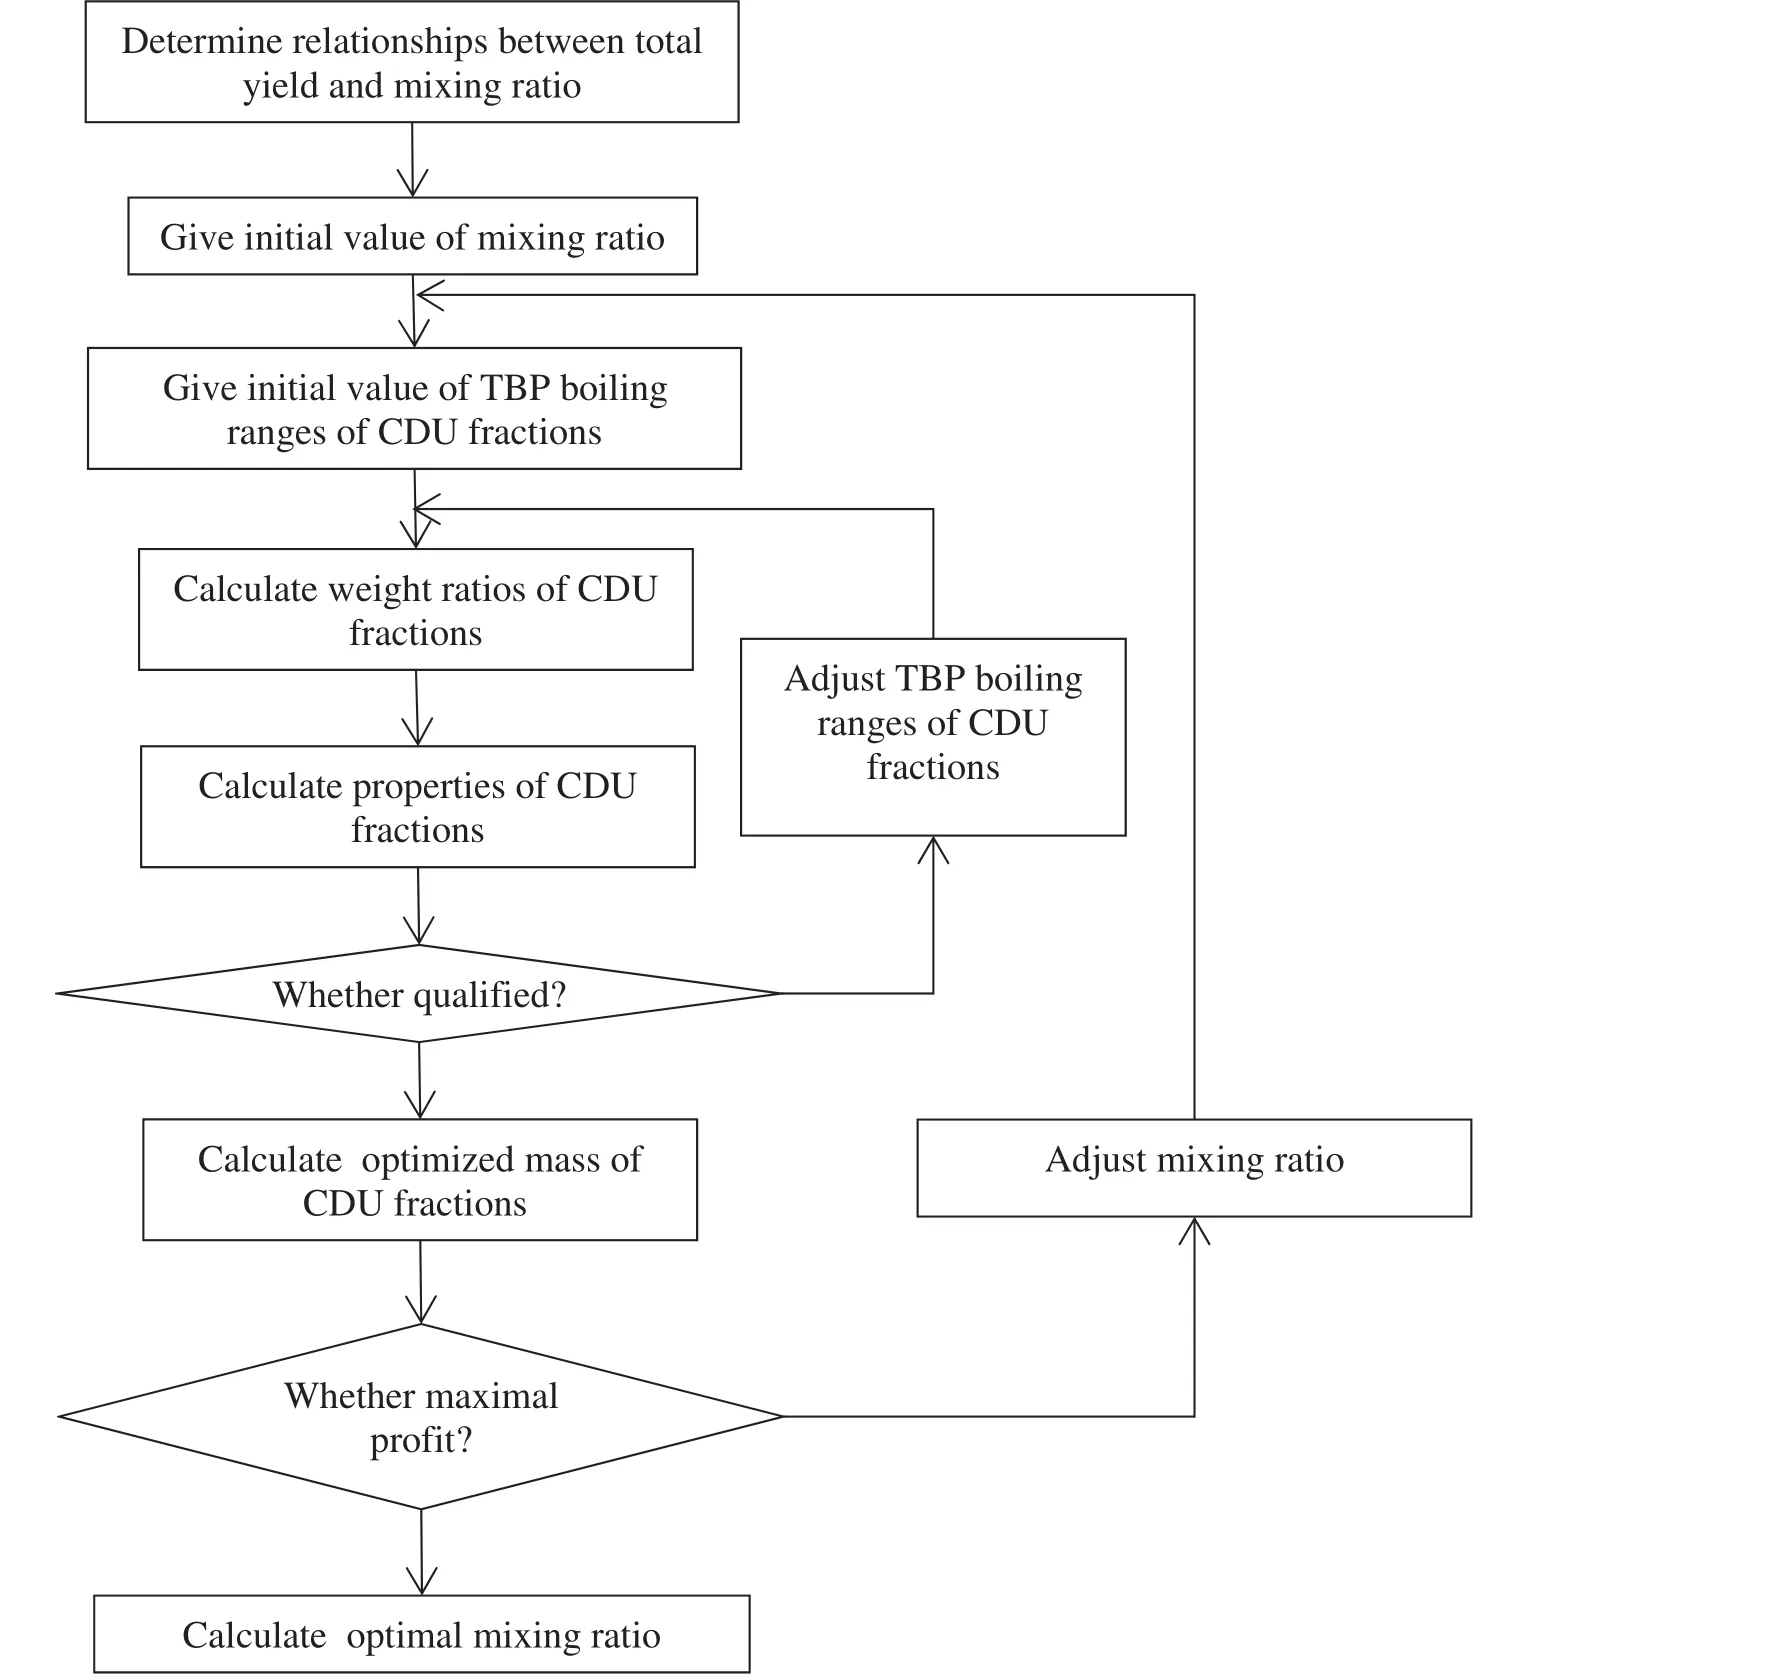
Fig.2.Procedures for modeling heavy crude refinery optimized planning.
2.2.Calculate CDU fractions' distribution
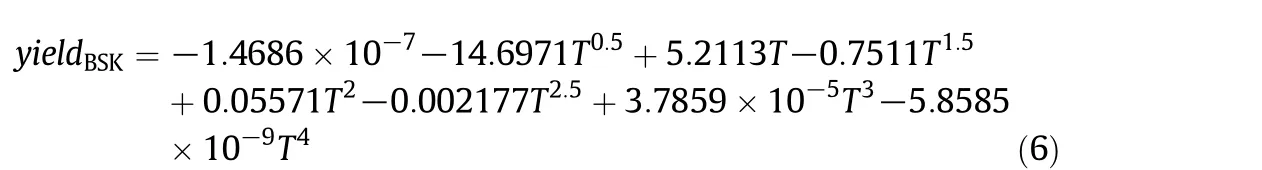
The TBP data of crude oil can be experimentally obtained.Using the data fitting method,accumulative yield and cutting temperature mathematical Eqs.(5),(6)are derived.Curves of accumulated yield over TBP of MR and BSK are shown in Fig.4.
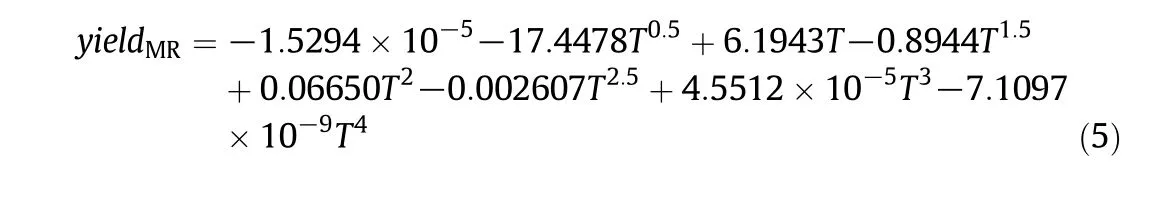
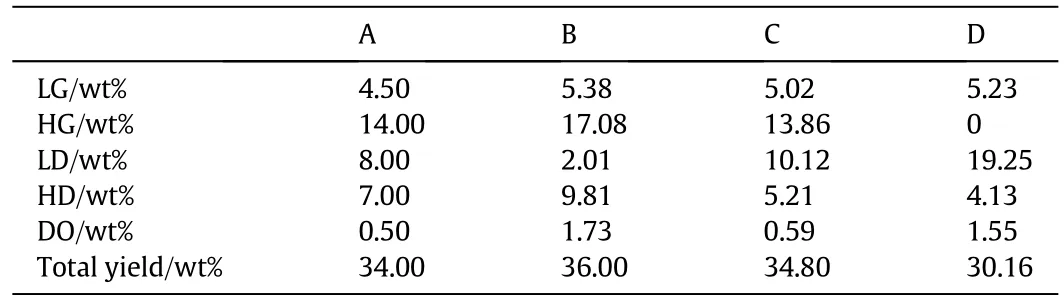
Table 1When MR:BSK=7:3,yield and product distribution of each refinery
Accumulative yield of crude oilkundercutting temperatureTican be expressed as follows:

When two or more property similar crude oils are mixed,the mixture yield can be approximated by additive calculation.Yield of CDU fractioniis:

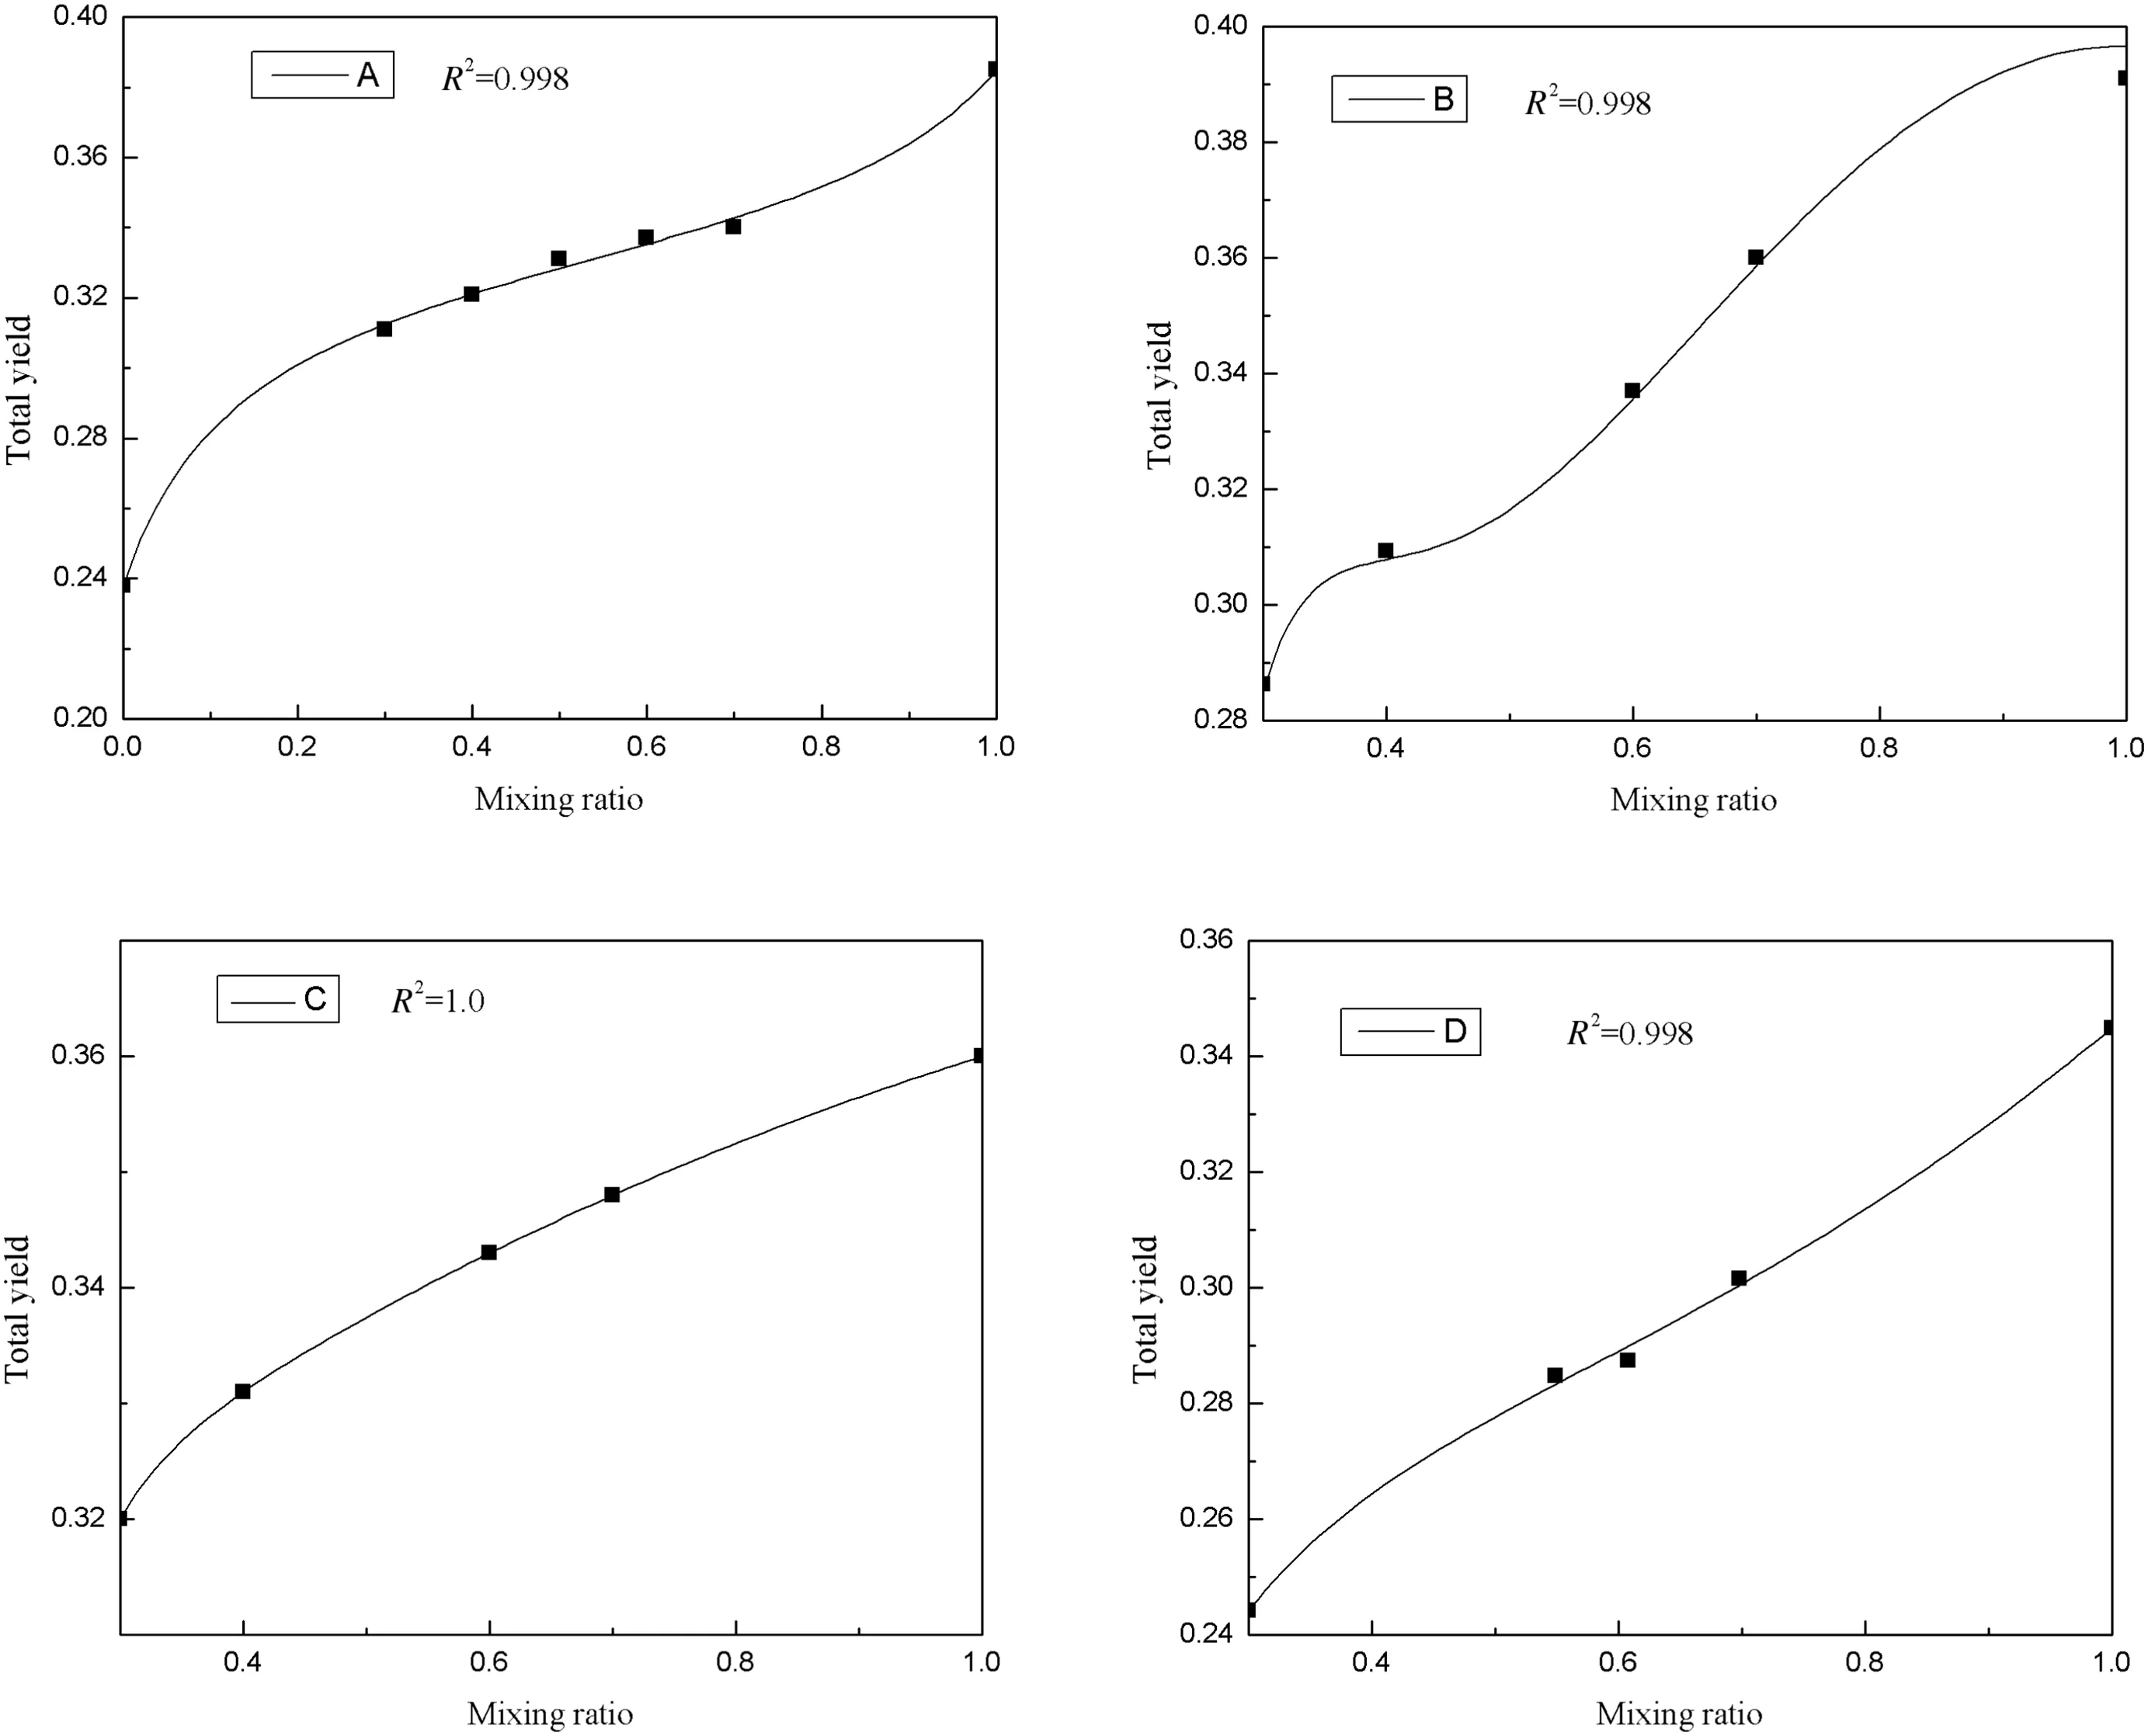
Fig.3.Relationships between total yield and mixing ratio for each refinery.
2.3.Calculate properties of CDU fractions
Cutting temperatures of CDU fractions are determined by the constraints of product properties.In the process of heavy oil refining,density is considered the most important control indicator.Hence in this paper,the constraint of density is used to determine the appropriate cutting temperature.The density of CDU fractions can be calculated by the density of narrow fractions.Both density of narrow fractions and experimentally obtained yield are shown in Table 2.
Firstly,the density of narrow fractions is converted into the density of cumulative fractions:
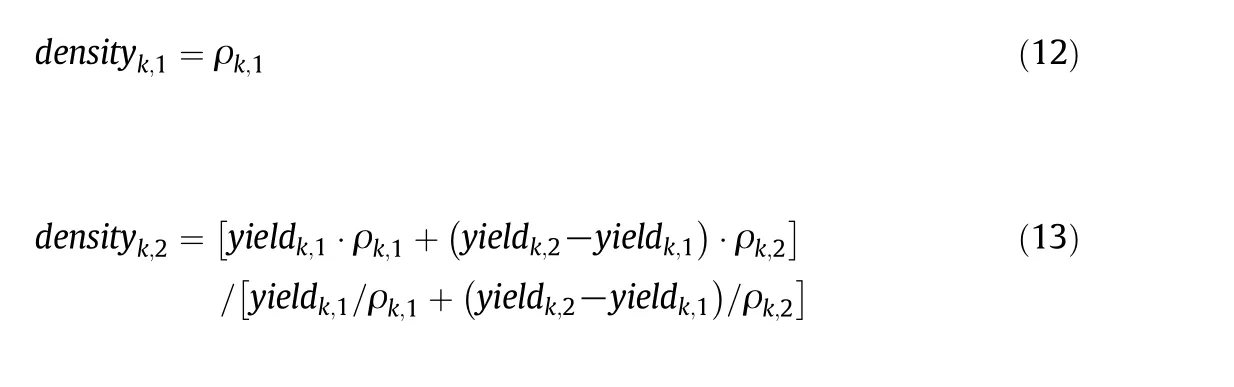
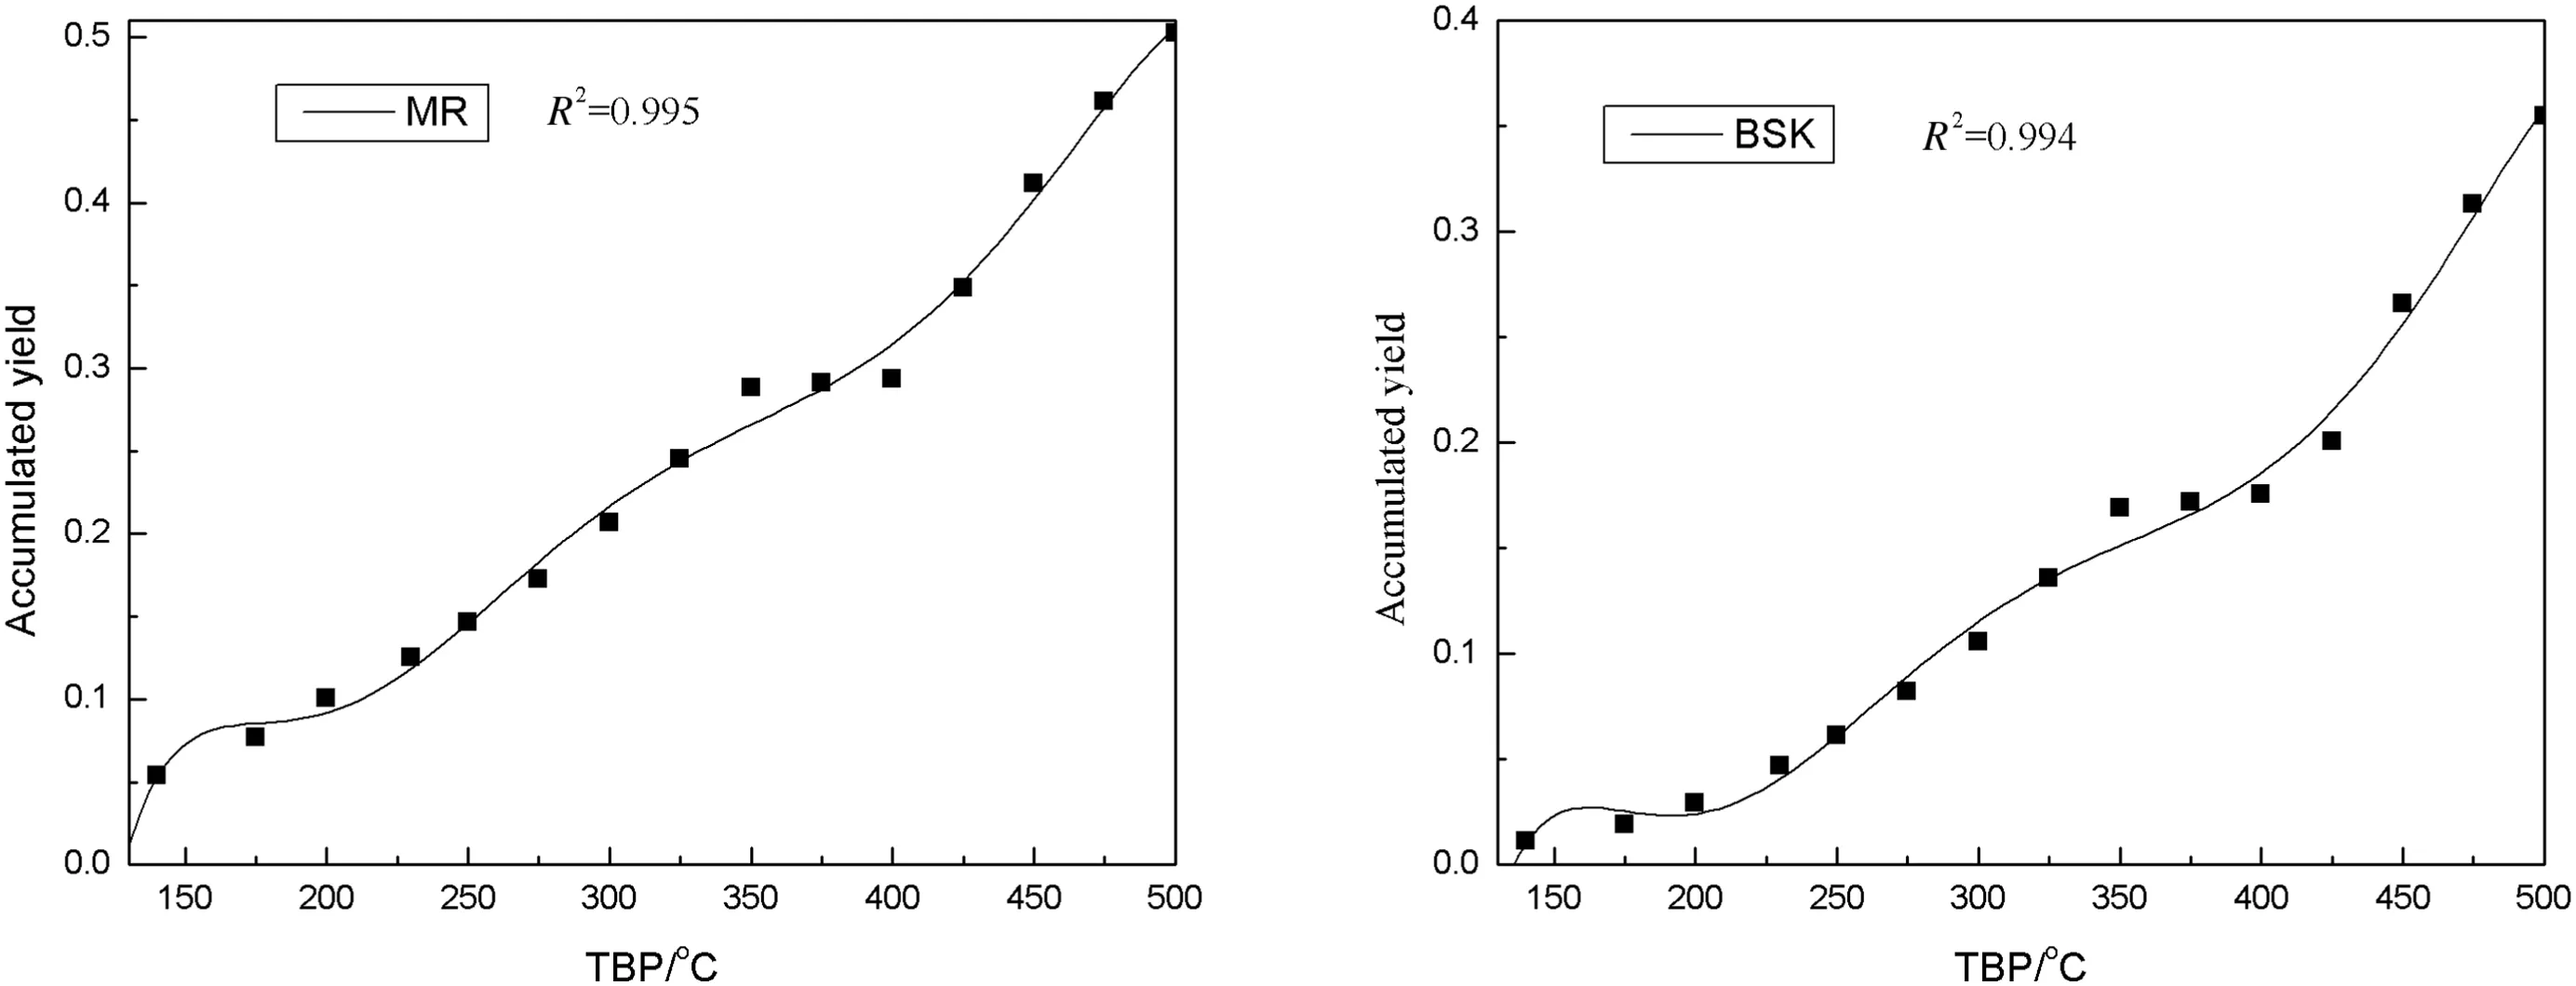
Fig.4.MR and BSK relationships between accumulated yield and cutting temperature.
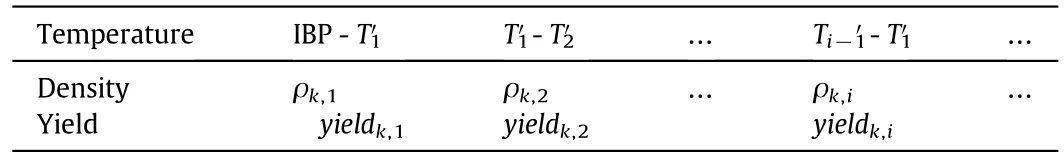
Table 2Narrow fractions' density and yield
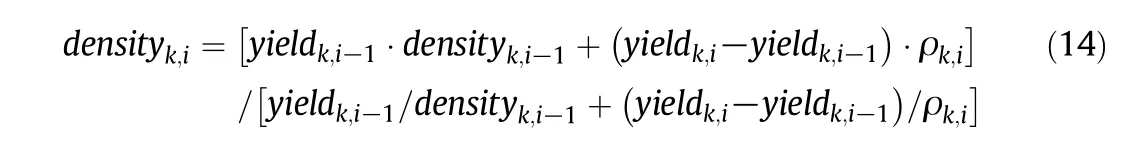
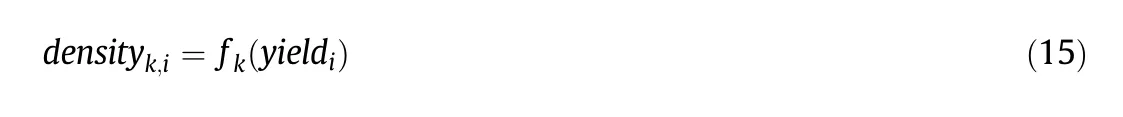
The relation between cumulative yield and density is obtained by data fitting:
When the cutting temperature is Ti−1-Ti,the corresponding cumulative yield and density isyieldk′,i−1-yieldk′,i,densityk′,i−1-densityk′,i,the density of this fraction is:
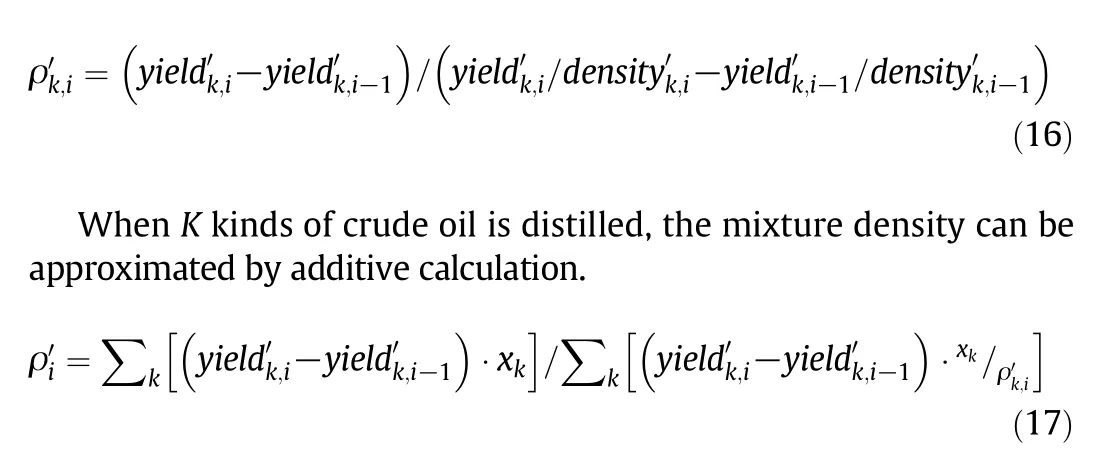
Combined with the corresponding mixing rule,the other properties can also be calculated by properties of narrow fractions.
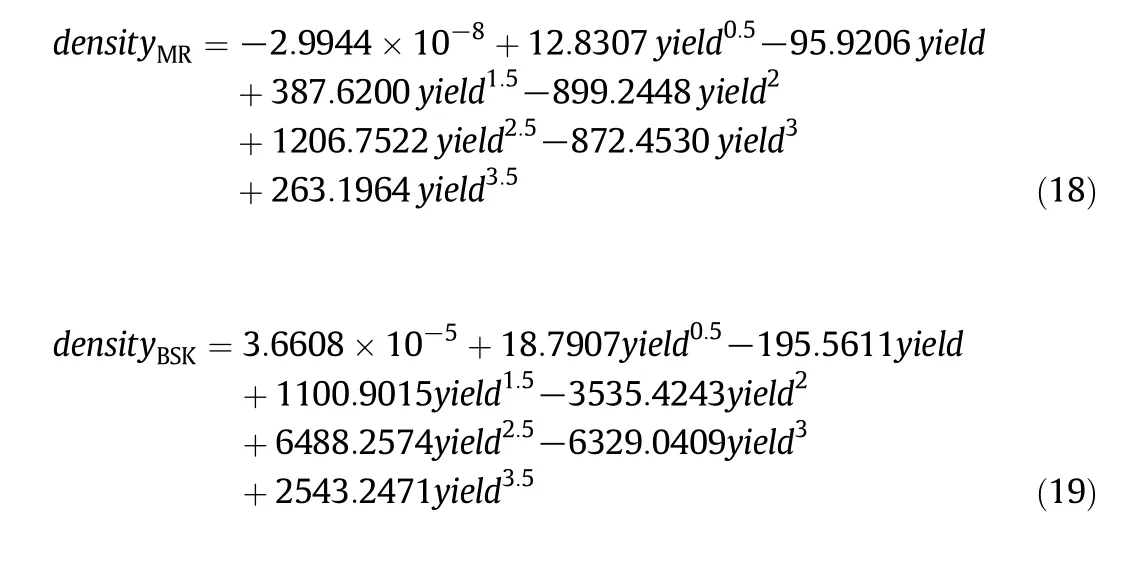
The density regression equations of MR and BSK are listed in Eqs.(18),(19),while fitting curves are shown in Fig.5.
2.4.Objective function,economic model and constraints
To maximize the total pro fit,constraints of crude oil purchases,feed transfer,mass balance,product quality,and capacity are considered.The objective function is given as follows:
Objective function:

Economic model includes sales revenue,raw material purchase costs,transport costs,operating costs and taxes.
Sales revenue:
2.5.Constraints
Constraints of feed transfer and process capacity are expressed as follows;other constraints can refer to the corresponding literature[15]:
2.5.1.Feed transfer constraints
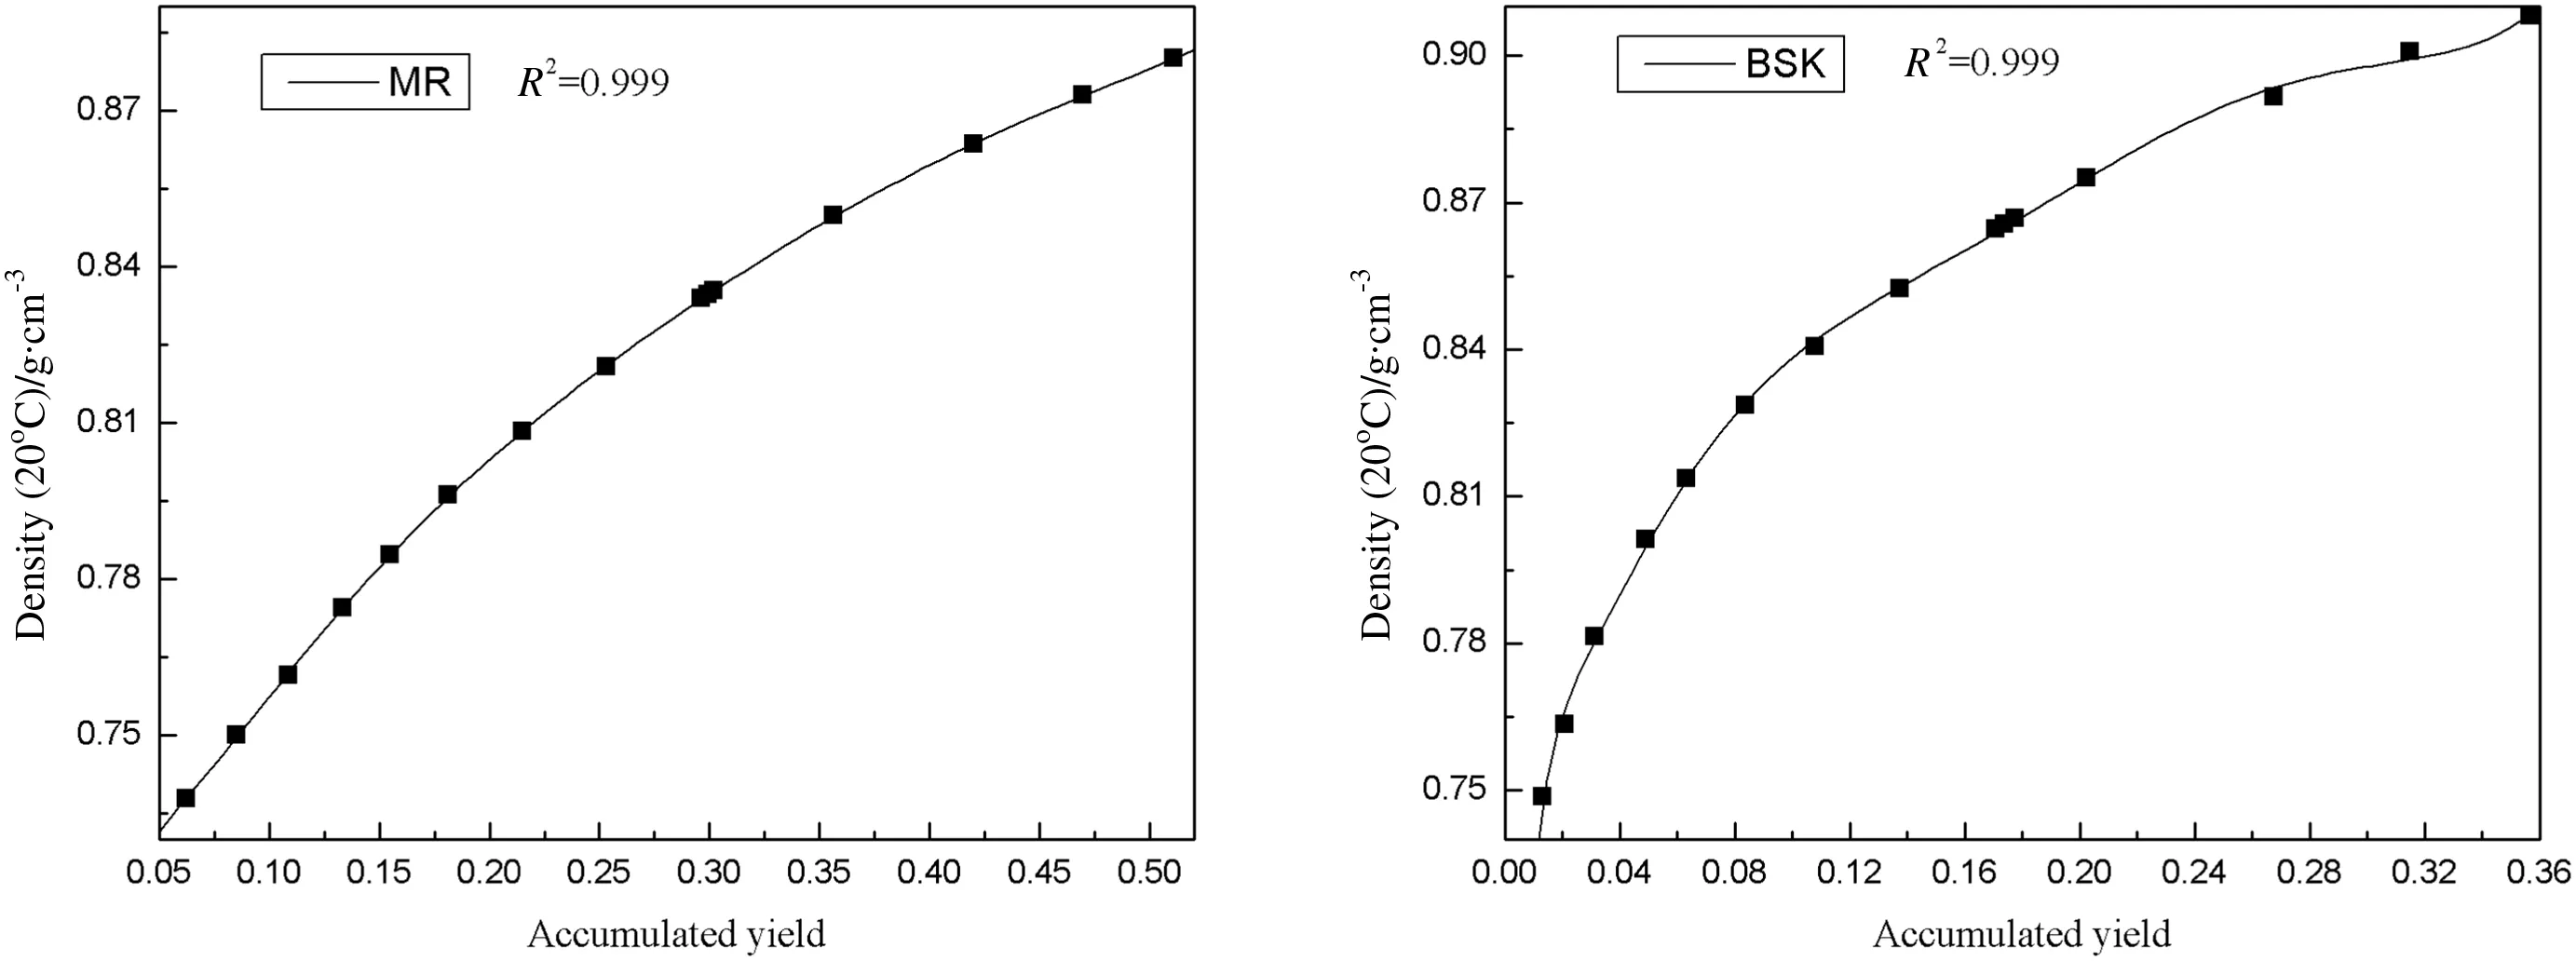
Fig.5.Density fitting curve of MR and BSK.
The viscosity of mixed oil should meet certain requirements to ensure that the crude oil can be normally pumped up by oil pump,which in turn limits the high viscosity oil at a relatively low mixing ratio.For heavy oil mixing,Cragoe viscosity correction model I can be used[16].
where μiis viscosity of crudei,μjkis viscosity of two crude oil with mixing ratio of 1:1.
2.5.2.Process capacity constraints
By changing the mixing ratio of crude oil,the vapor–liquid load of distillation towers varies accordingly.As long as more light oils are applied,the atmospheric tower load increases,whereas the vacuum tower load decreases.In this case,production capacity of equipment is limited and,as a consequence,the load cannot reach the design value.
Lower and upper limits of atmospheric tower vapor load in plantjare:
wherema,i,jis the mass of atmospheric tower distillate and de is over flash degree.
Lower and upper limits of vacuum tower vapor load in plantjare:

wheremv,i,jis the mass of vacuum tower distillate.
The aforementioned mathematical model for the refinery planning is composed of a nonlinear planning model,which can be solved by nonlinear programming(NLP)optimization algorithms.In this paper,the refinery planning model is formulated in 1stOpt 6.0 and solved by differential evolution solver.
3.Case Study
In this section,the accuracies of Watkins method and the method proposed in this paper are compared.Each refinery(plant level)and the entire company(company level)have been optimized.
3.1.Comparison with Watkins method
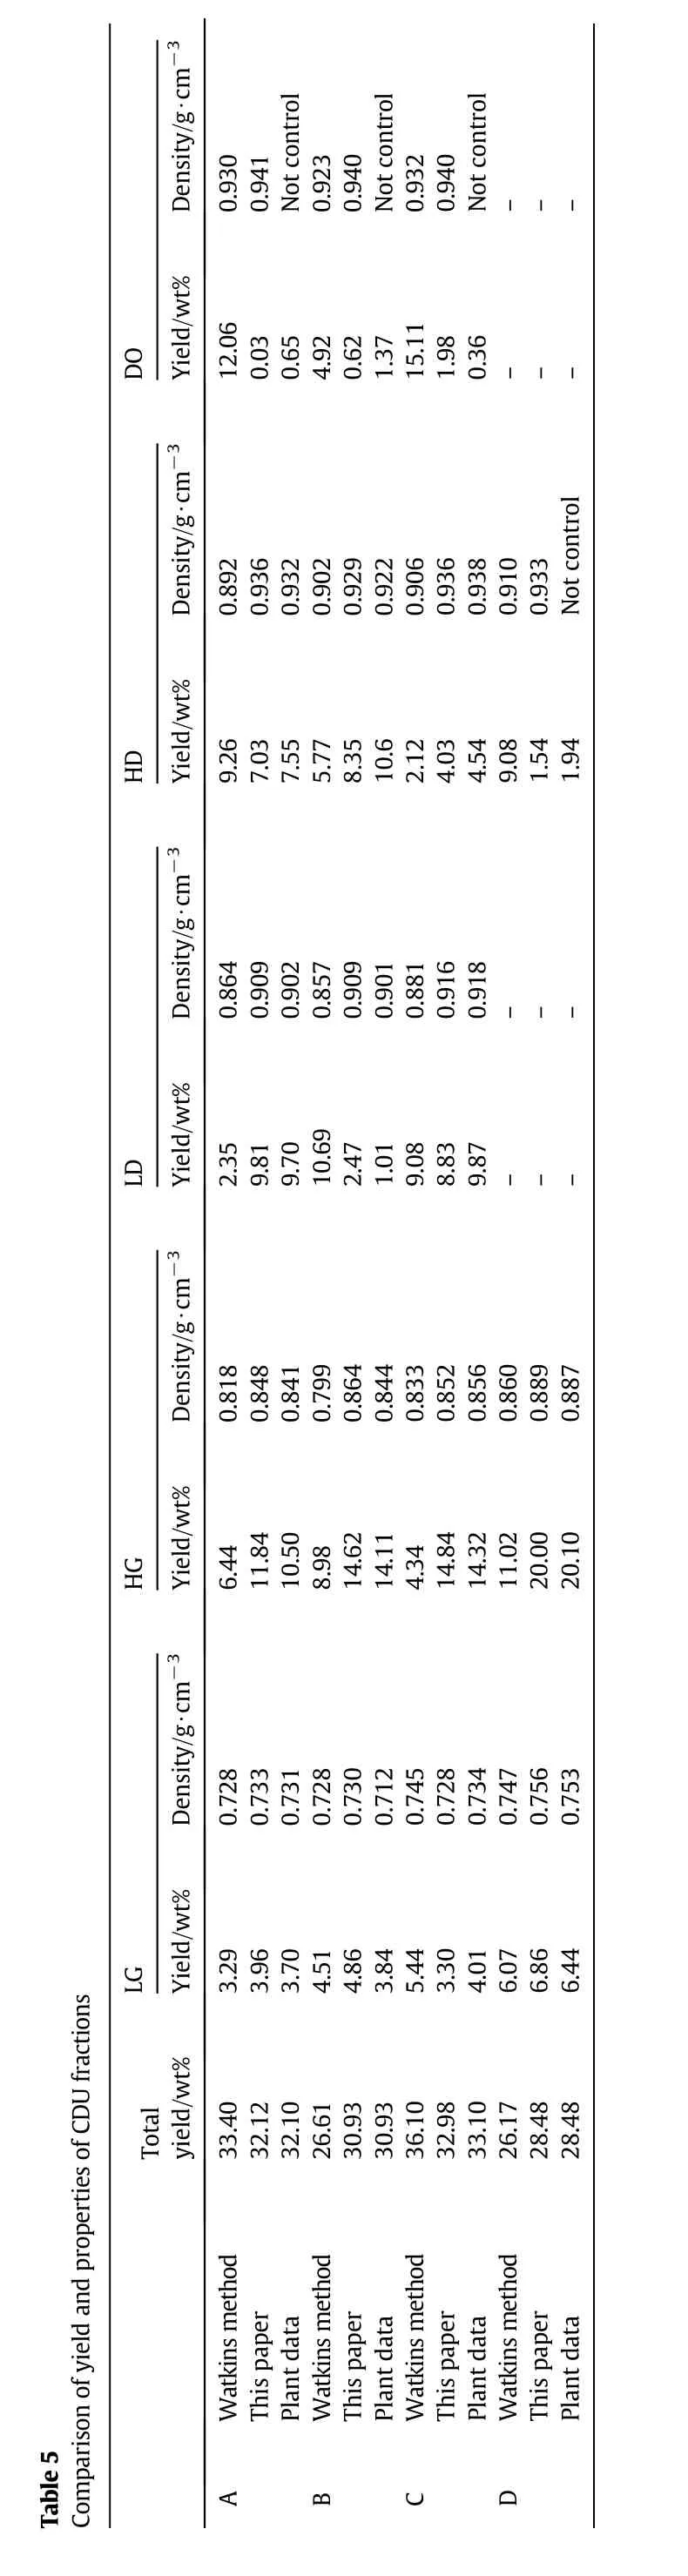
Using Watkins method and the method proposed in this paper,the factory A,B,C and D's product distribution and product density are calculated.MRand BSK mixing ratios of plant A,B and C are 0.4,while plant D is 0.55.Density range of each fraction is shown in Table 3.TBP cutting points calculated by Watkins using product ASTM data are shown in Table 4.The calculation results are shown in Table 5.
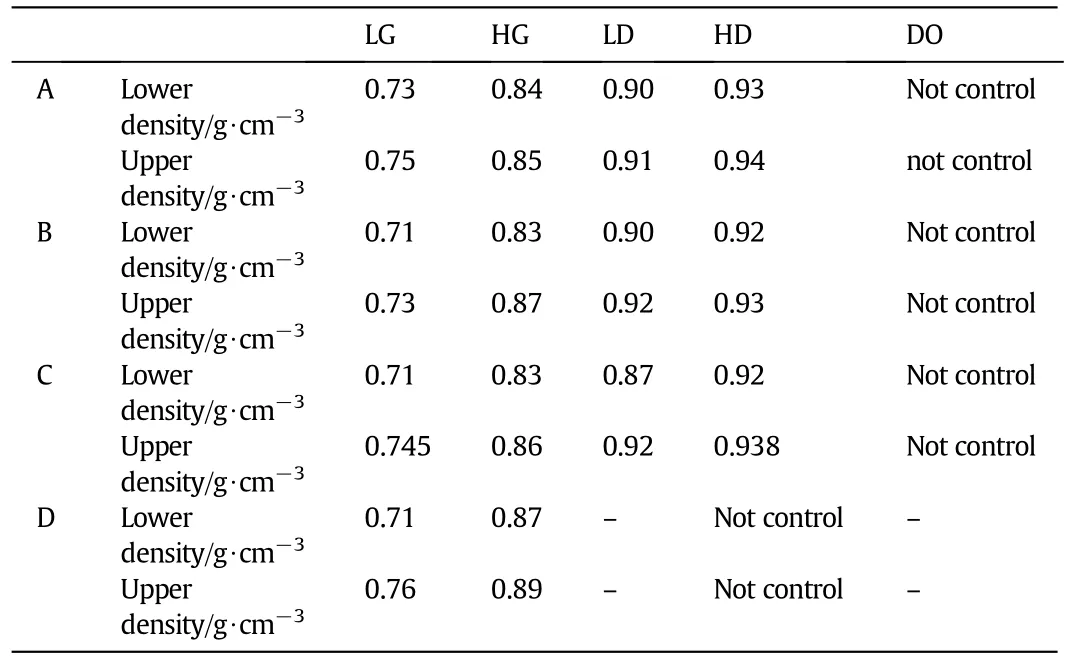
Table 3Density control in production
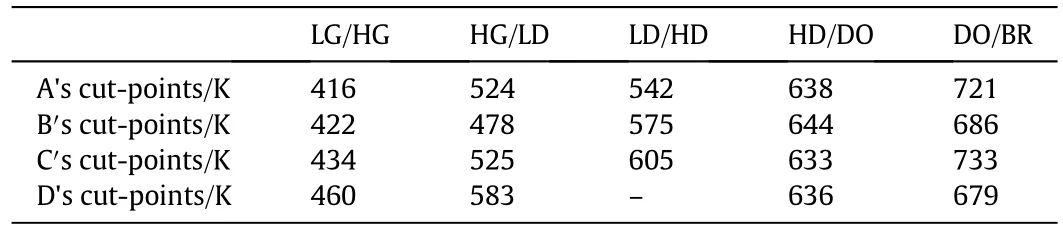
Table 4Calculated cut-points by Watkins
From Table 5,remarkable differences have been found in total yields and product distributions derived by Watkins method comparing to the actual plant data.Besides,most of product densities cannot meet the requirements.By contrast,the results that are obtained by the proposed method in this paper are in excellent agreement with the plant data.Also,yield of each light fraction has been optimized to achieve a maximum benefit.Although the calculated product distributions are not completely the same as compared to the plant data,the densities are still within the range of product index requirements.
3.2.Plant level optimization
Using mixed heavy crude refinery and multi-plant planning model,optimized product distribution and mixing ratio of refinery A,B,C and D were calculated.Material prices,product price,transport and process costs are shown in Table 6.Light fractions' consumer tax is shown in Table 7.Additional tax is 12%.The results are shown in Tables 8–11.
As seen from Tables 8–11,the total yields of different refineries,under different mixing ratio,can be accurately calculated by introducing the new planning model.Based on both product density requirements and the maximum benefit,optimal product distributions are obtained.The lighter fraction will bring more benefits,so their yields are increased and the heavier decreased after the optimization.
The optimized mixing ratio varies with different refinery.When MR ratio is high,more light oil can be distilled at high MR ratio,whereas raw material costs are relatively increased.For the increased product benefits that are greater than the raw material costs,the mixing ratio of MR can be improved.The optimal mixing ratio is affected by both product price and tax with changing of the raw materials price.Table 12 indicates the impact of oil price changes on the optimal mixing ratio.
Mixing ratio of MR decreases with increasing of MR price,whereas the rate of change for each plant is different.As can be seen from Fig.3,the relations between total yields and mixing ratio of plant C and D are closed to linear.Therefore,according to the characteristics of linear programming,optimal values can easily reach the endpoint.On the contrary,the total yield curves of A and B are completely nonlinear,causing a moderate change of the mixing ratio with the price.
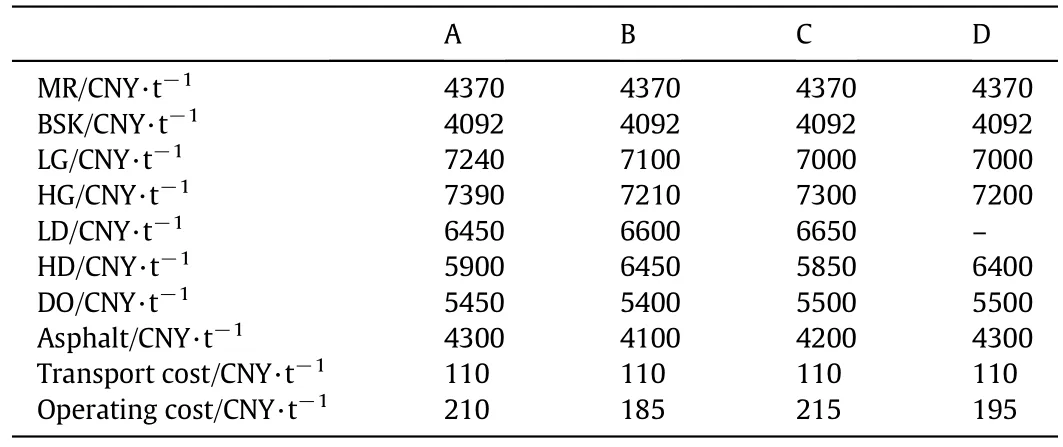
Table 6Economic parameters of plant A,B,C and D
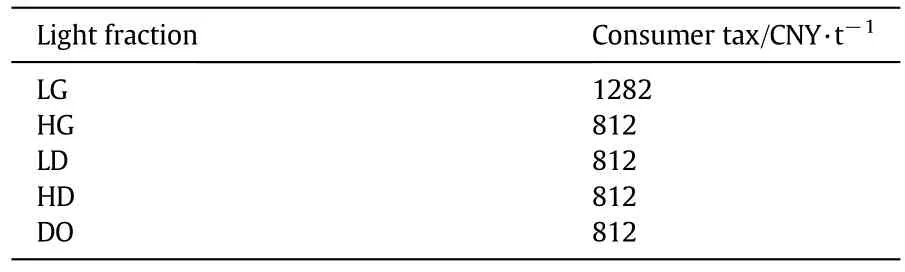
Table 7Light fractions'consumer tax
3.3.Company level optimization
The proposed model also can be used for the entire company planning optimization.According to market demand for asphalt,to make maximum benefit of the entire company,the refinery production tasks need to be optimized.In this case,the asphalt market is divided into four sales regions.Region 1 to 4 is corresponds to refineries A,B,C and D,respectively.Different sales costs are needed for sale to different regions.If it is optimization for each refinery,asphalt can only be sold in the corresponding sales area.But during entire company planning optimization,asphalt can be sold across the region.Table 13 shows the market demands for each sales region.Table 14 shows the selling expenses in each sales region.
Table 15 shows asphalt sales in different region during entire company planning optimization.
As can be seen from the Table 15,re finery A,B and C′s asphalt will be sold in region 4.This is because A,B and C have a better performance,to obtain greater benefits,A,B and C′s production tasks are increased,and D decreased.The comparison of company level and plant level optimization of the refinery planning is shown in Table 16.
As can be seen from Table 16,the company-level optimization can further improve the benefit of crude oil refinery.The total pro fit is increased by 11.6%in this case.
4.Conclusions
?
In this paper,the process of multi-plant mixed heavy crude oil refinery was studied,and a novel nonlinear planning model was proposed.The main conclusions are as follows:
(1).Apart from the effect of product and raw material properties,the influence of CDU equipment and operating parameters should also be taken into account during the crude oil refining process modeling.The same ratio of raw materials,total yield and product distribution are not the same.The process model of different refinery should be established separately.For different refineries,process model should be developed respectively due to different total yields and product distributions at the same raw materials.
(2).In the new model,the total yield was primarily determined based on production and rigorous simulation data.Both yields and properties of light fractions were thereafter calculated by the crude TBP data together with the narrow component property data.Taking maximum economic benefit as objective function,mixing ratio and product distribution were optimized.The proposed model presented higher efficiency and accuracy for heavy oil refining process comparing to the previous models.
(3).Using this model,each refinery and the entire company can be optimized,and the optimal production task,product distribution and mixing ratio can be gotten,which will be very useful for improving the pro fit of refinery.
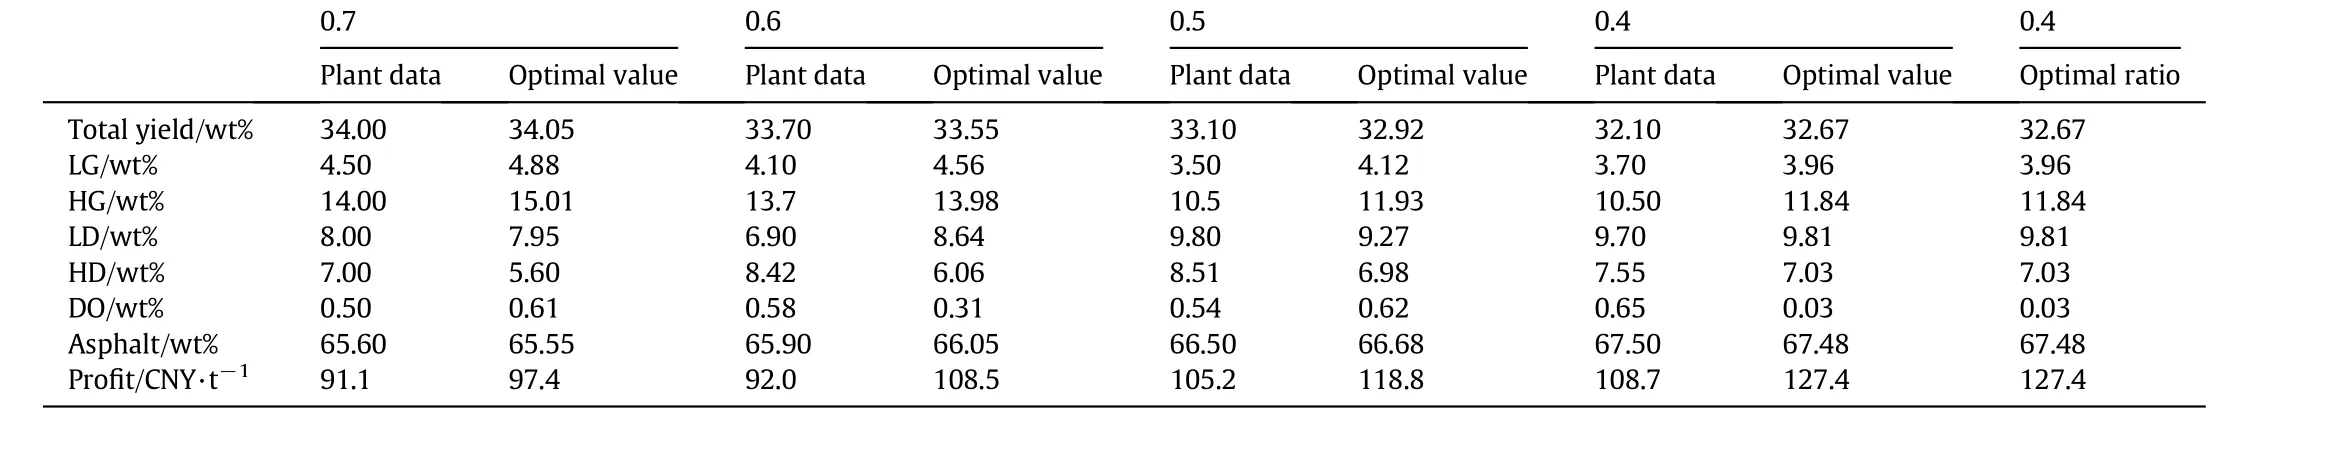
Table 8Comparison of refinery A's plant data and optimal value
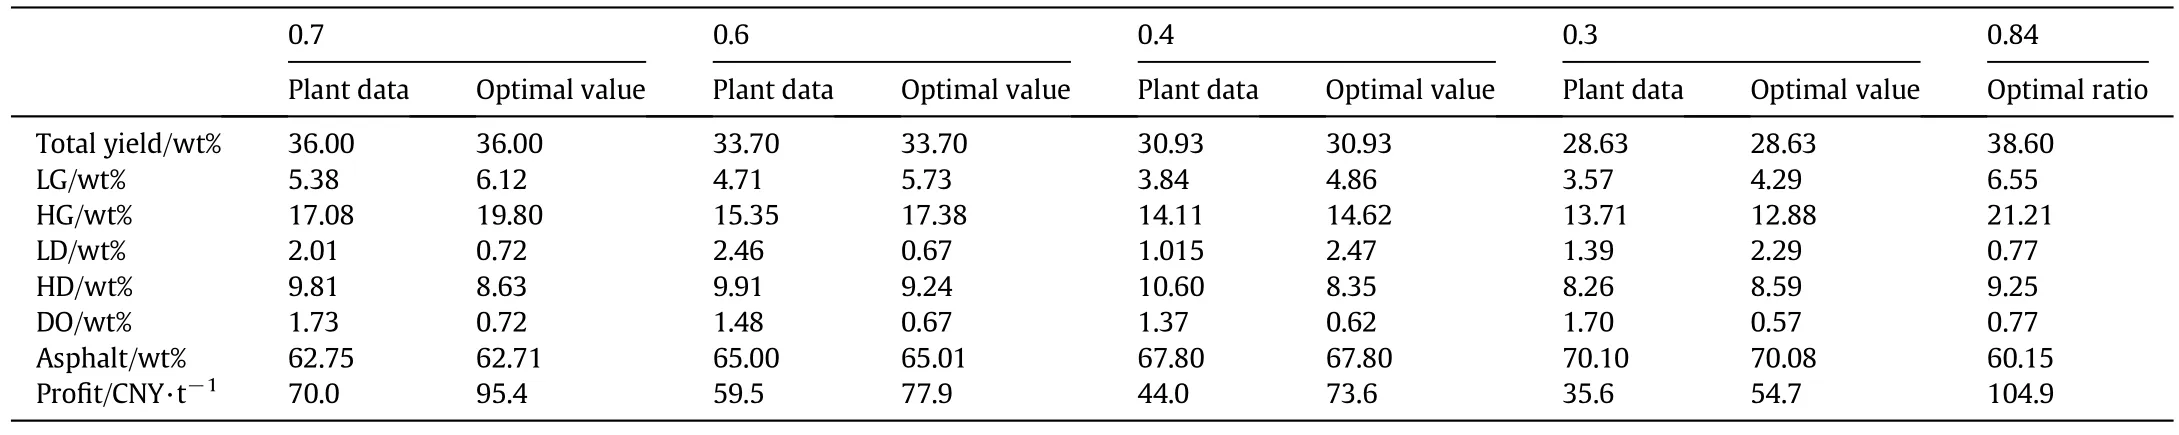
Table 9Comparison of refinery B′s plant data and optimal value
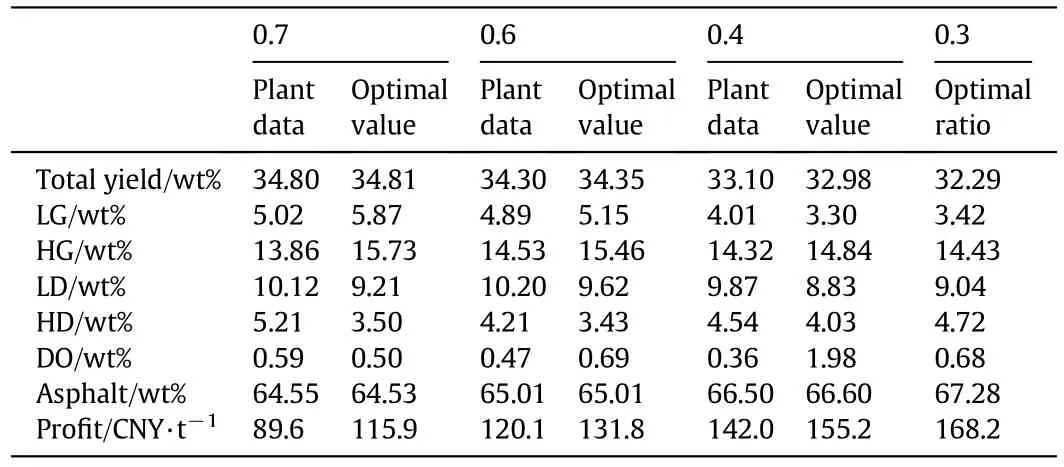
Table 10Comparison of refinery C′s plant data and optimal value
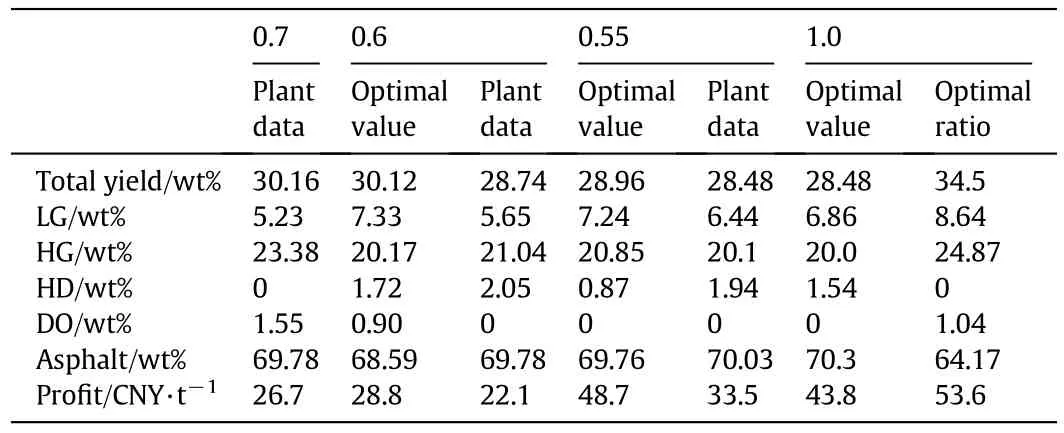
Table 11Comparison of refinery D's plant data and optimal value
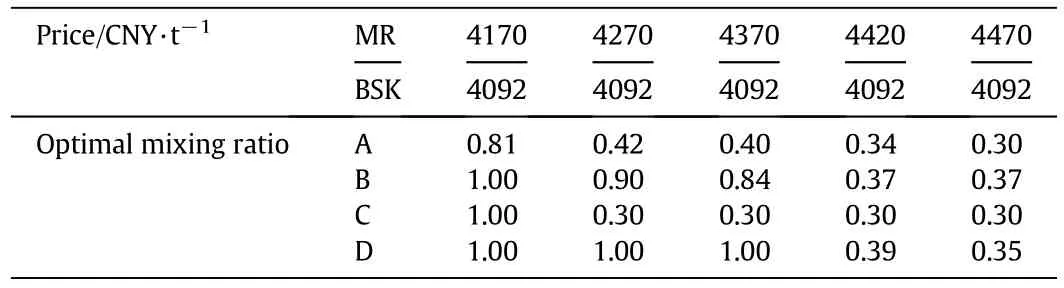
Table 12Impact of oil price changes on the optimal mixing ratio
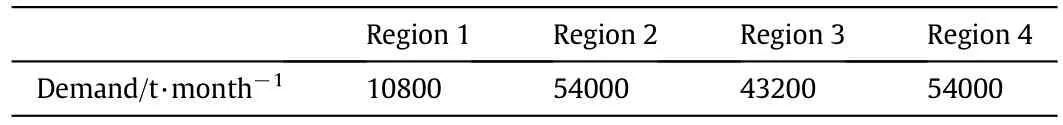
Table 13Asphalt market demands for each sales region
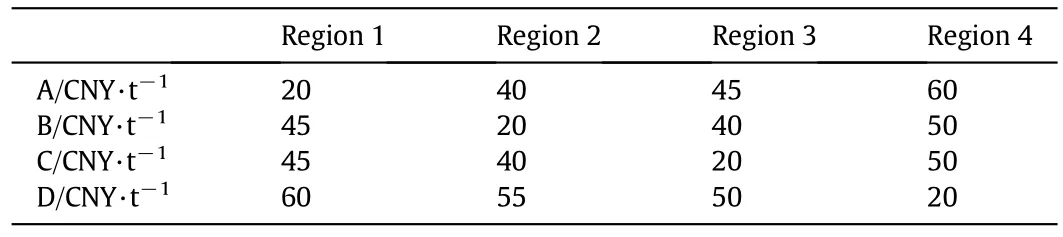
Table 14Selling expenses in each sales region
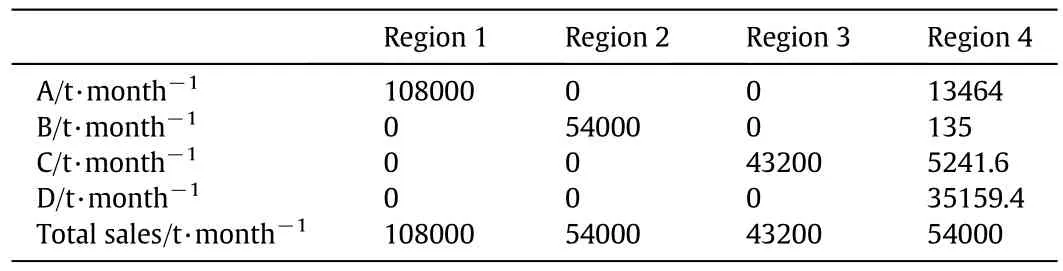
Table 15Asphalt sales in different region
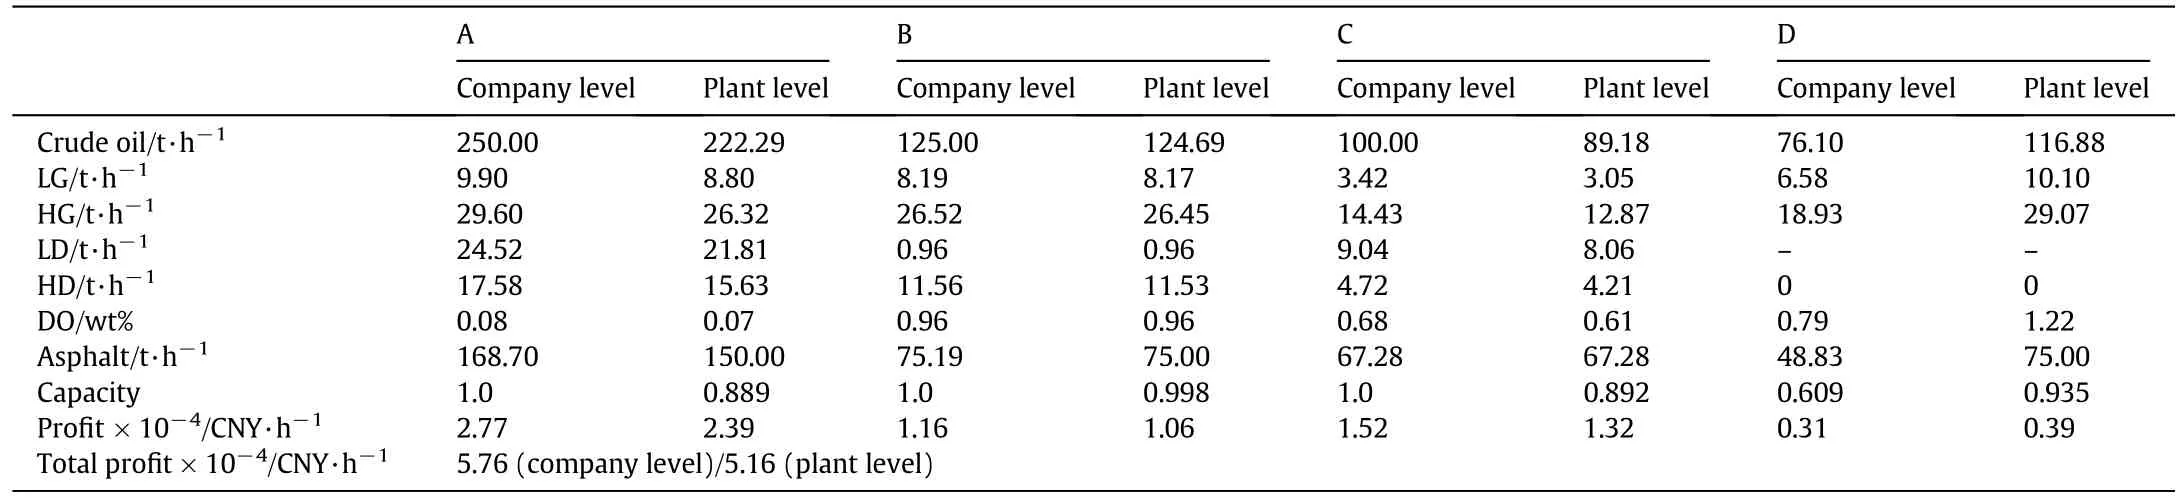
Table 16Comparison of company level and plant level planning optimization
Nomenclature
Cjkparameter in Cragoe viscosity correction model I
cmaterial,jraw material purchase costs of refineryj,CNY·t−1
cprocess,joperating costs of refineryj,CNY·t−1
ctransport,jtransport costs of refineryj,CNY·t−1
de over- flash degree
Ded deduction rate of crude transport cost
densityk,iaccumulative density of crude oilkunder cutting temperatureTi,g·cm−3
Fjcrude oil mass flow rate of refineryj,t·h−1
Liviscosity function of crude oili
Ljkviscosity function of crude oiljandkmixing in 1:1
Lmviscosity function of mixed crude
ma,i,jmass of atmospheric tower distillate,t·h−1
masphalt,jmass of asphalt in refineryj,t·h−1
mi,jmass of CDU fractioniin refineryj,t·h−1
mv,i,jmass of vacuum tower distillate,t·h−1
ppjsales revenue,CNY·t−1
Pro fitjpro fit of refineryj,CNY·t−1
qjtax of refineryj,CNY·t−1
Ticutting temperature of CDU fractioni,K
Ti′cutting temperature of narrow fractioni,K
taxconsumer,iconsumer tax of CDU fractioni,CNY·t−1
taxadditionaladditional tax
Wa,max,jupper limits of refineryjatmospheric tower vapor load,t·h−1
Wa,min,jlower limits of refineryjatmospheric tower vapor load,t·h−1
Wv,max,jupper limits of refineryjvacuum tower vapor load,t·h−1
Wv,min,jlower limits of refineryjvacuum tower vapor load,t·h−1
wa,jvapor load of refineryjatmospheric tower,t·h−1
wv,jvapor load of refineryjvacuum tower,t·h−1
xkmixing ratio of crudek
yieldiyield of CDU fractioni,wt%
yieldk,iaccumulative yield of crude oilkunder cutting temperatureTi,wt%
VAT added-value tax
α processing loss rate
μiviscosity of crudei,Pa·s
μjkviscosity for two crude oil mixing in 1:1,Pa·s
μmviscosity of mixed crude,Pa·s
ρi′fractionidensity,g·cm−3
ρk,idensity of narrow fractionidistilled by crudek,g·cm−3ρk,i′density of fractionidistilled by crudek,g·cm−3
Acknowledgments
The authors would like to acknowledge the help in data collection provided by PetroChina Fuel Oil Company Limited and PetroChina Fuel Oil Company Limited Research Institute.
[1]R.C.Qiu,Study on modeling for product qualities prediction and process optimization of crude oil distillation system,Ph.D.Thesis,Tianjin University,China,2006.
[2]Aspen Technology,ASPEN PLUS,version 11.1,Aspen Technology Inc.,MA,2001.
[3]A.Barsamian,Fundamentals of supply chain management for refining,IBC Asia oil&gas SCM conference proceedings,2001.
[4]J.C.M.Hartmann,Determine the optimum crude intake level—A case history,Hydrocarb.Process.80(6)(2001)77–84.
[5]R.W.Brooks,F.D.van Walsem,J.Drury,Choosing cut-points to optimize product yields,Hydrocarb.Process.78(11)(1999)53–60.
[6]Z.Jia,M.Ierapetritou,Mixed-integer linear programming model for gasoline blending and distribution scheduling,Ind.Eng.Chem.Res.42(2003)825–835.
[7]R.N.Watkins,Petroleum refinery distillation,Gulf Publishing Company,Houston,1973.
[8]C.M.Xu,C.H.Yang,Petroleum refinery engineering,4th edition Petroleum Industry Press,Beijing,2009.
[9]O.J.Guerra,A.C.Le Roux,Improvements in petroleum refinery planning:1.Formulation of process models,Ind.Eng.Chem.Res.50(2011)13403–13418.
[10]O.J.Guerra,A.C.Le Roux,Improvements in petroleum refinery planning:2.Case studies,Ind.Eng.Chem.Res.50(2011)13419–13426.
[11]J.Zhang,X.X.Zhu,G.P.Towler,A level-by-level debottlenecking approach in refinery operation,Ind.Eng.Chem.Res.40(6)(2001)1528–1540.
[12]W.Li,C.Hui,A.Li,Integrating CDU,FCC and product blending models into refinery planning,Comput.Chem.Eng.29(2005)2010–2028.
[13]C.M.Brenno,F.L.Lincoln,O.L.Whei,A.M.Ricardo,L.P.Fernando,Nonlinear production planning of oil-re finery units for the future fuel market in Brazil:Process design scenario-based model,Ind.Eng.Chem.Res.53(2014)4352–4365.
[14]Q.Z.Deng,Y.Z.Zhang,X.Q.Huang,Production of AH-50 heavy traffic asphalt by distillation of crude oils,Pet.Asph.26(6)(2012)47–50(in Chinese).
[15]J.M.Pinto,M.Joly,L.F.Moro,Planning and scheduling models for refinery operations,Comput.Chem.Eng.24(9–10)(2000)2259–2276.
[16]S.P.Ai,D.Q.Zhang,Evaluation of mixed crude oil viscosity model,Oil-Gasfield Surf.Eng.29(1)(2010)7–8(in Chinese).
杂志排行
Chinese Journal of Chemical Engineering的其它文章
- Structural insights of mechanically induced aluminum-doped hydroxyapatite nanoparticles by Rietveld refinement☆
- Structural evolution of chars from biomass components pyrolysis in a xenon lamp radiation reactor☆
- TiO2–SA–Arg nanoparticles stabilized Pickering emulsion for photocatalytic degradation of nitrobenzene in a rotating annular reactor
- Assessing the kinetic model of hydro-distillation and chemical composition of Aquilaria malaccensis leaves essential oil
- Effects of temperature and phosphoric acid addition on the solubility of iron phosphate dihydrate in aqueous solutions☆
- A self-tuning control method for Wiener nonlinear systems and its application to process control problems☆