Microstructures of carbon nanoscrolls characterized by polarized micro-Raman spectroscopy
2017-01-07CarotenutoLongoCamerlingoDeNicolaPepe
G. Carotenuto, A. Longo, C. Camerlingo, S. De Nicola, G.P. Pepe,3
(1.CNR-IPCB, Inst. for Polymers, Composites and Biomaterials. National Research Council,Viale Kennedy,54. Mostra d’Oltremare Pad.20-80125 Naples, Italy;2.CNR-SPIN, Inst. for Superconductors, oxides and other innovative materials and devices,National Research Council, C. Univ. M.S. Angelo, Via Cinthia,80126 Naples, Italy.3.Dipartimento Scienze Fisiche, University of Naples Federico II, Via Cinthia,80126 Naples, Italy)
Microstructures of carbon nanoscrolls characterized by polarized micro-Raman spectroscopy
G. Carotenuto1, A. Longo1, C. Camerlingo2, S. De Nicola2, G.P. Pepe2,3
(1.CNR-IPCB,Inst.forPolymers,CompositesandBiomaterials.NationalResearchCouncil,VialeKennedy,54.Mostrad’OltremarePad.20-80125Naples,Italy;2.CNR-SPIN,Inst.forSuperconductors,oxidesandotherinnovativematerialsanddevices,NationalResearchCouncil,C.Univ.M.S.Angelo,ViaCinthia,80126Naples,Italy.3.DipartimentoScienzeFisiche,UniversityofNaplesFedericoII,ViaCinthia,80126Naples,Italy)
Carbon nanoscrolls (CNSs) are produced by rolling up the graphite layer in graphene nanoplatelets on a nanofibrous bi-axially oriented polypropylene surface by a shear-friction mechanism. Microstructures of the CNSs are characterized by optical and scanning electron microscopy, transmission electron microscopy, Fourier transform infrared spectroscopy and micro-Raman spectroscopy. Results indicate that the CNSs have a long tubular and fusiform structure with a hollow core surrounded by few graphene layers. The orientation of the graphite lattice with respect to the scroll axis is accurately determined from the split of the vibrational G mode by polarized micro-Raman spectroscopy. Morphological changes produced by the rolling are also described.
Carbon nanoscrolls; Shear stress; Bi-axially oriented polypropylene; GNP; Micro-Raman spectroscopy
1 Introduction
Carbon nanoscrolls (CNSs) are novel carbon nanomaterials that have many useful graphene properties without the disadvantages of stacking phenomena that are observed with graphene. Already in 1960, Bacon[1]described a graphite whisker in which a graphene sheet is rolled into a scroll. However, the scrolled structures have been available in a high purity and large quantities only recently. These carbon nanostructures are generated by wrapping a graphene sheet into a helical structure[2-9]. Because of the scroll topology their properties differ from those of either single or multi-walled carbon nanotubes. In contrast to carbon nanotubes, CNSs contain interlayer galleries. CNSs offer a number of useful physical characteristics (e.g., very high specific surface area, and electrical-thermal conductivity) adequate for applications in different technological fields like, for examples, biomedical (drug-delivery, image contrast agents, hyperthermie, et al.)[10], electrical (high-porous electrodes) and hydrogen storage applications[11-13]. A variety of synthetic approaches have been widely explored to produce large amounts of carbon nanoscrolls and to realize their applications[14-29]. Lithography had been used to synthesize wide ribbons from graphene sheets, but the quality was limited by the lithographic resolution[14]. Chemical and sonochemical methods have been developed to produce narrow carbon nanoscrolls, but with a low yield[15-22]. Nanoscrolls have also been produced by unzipping carbon nanotubes, but the resultant quality and yield also need to be improved[23-25]. Scrolled structures have been obtained by direct rolling up of the graphene monolayers by ball milling[26]. Little amount and low quality CNSs were obtained at the end of the graphite grinding process, and the diameter of these scrolls was quite large (ca. 400 nm)[27]. Tunable carbon nanoscrolls were produced by using Fe3O4nanoparticles as the catalyst precursor based on a chemical vapor deposition method[28]. Recently, we have developed a simple approach for the production of CNSs[29]. This method is based on the application of shear-friction forces to convert graphite nanoplatelets to carbon nanoscrolls using a biaxially oriented polypropylene (BOPP) surface. An important aspect for the assessment of the technique is the morphological investigation of these produced rolled structures. One of the most commonly used techniques to characterize carbon related materials is Raman spectroscopy. It plays a very important role in acquiring information not only on morphological properties but also on physical, chemical properties of graphene and graphene based structures[30, 31]. Herein we report on a polarized micro-Raman spectroscopic technique, which allows to determine the chirality, hence the crystal orientation of the graphite lattice with respect to the scroll axis of the structures produced by the micromechanical method. The technique allows to obtain both qualitative and quantitative information of the graphite lattice orientation by using the split of the vibrational G mode.
2 Experimental
2.1 Methods
An alcoholic (ethanol, Sigma-Aldrich 99.9%) dispersion of nanographite (graphite nanoplatelets, GNP), was slowly rubbed against on the surface of a BOPP (Manucor S.p.a., film thickness = 40 μm) film using a low-density polyethylene (LDPE) piece. The alcoholic suspension was allowed to dry during the rubbing down process. After drying the concentrated liquid suspension was removed from the BOPP film by pouring pure ethanol on it. The resulting black suspension contained a large amount of nanoscrolls. Nanoscrolls were separated from the un-rolled and/or partially rolled graphene-based material by sedimentation in ethanol since their Stokes coefficient value is significantly higher than that for graphene sheets. The high roughness of the BOPP due to the nano-fibers on BOPP surface is able to induce a rolling up process in the graphene sheet. Indeed, the dimension of the nano-fibers is 4.20 Å[32], which is comparable to the graphite interlayer spacing (3.35 Å), thus leading to enhanced mechanical grip between the two sliding surface. The mechanism involved in the CNS formation is schematically depicted in Fig. 1.
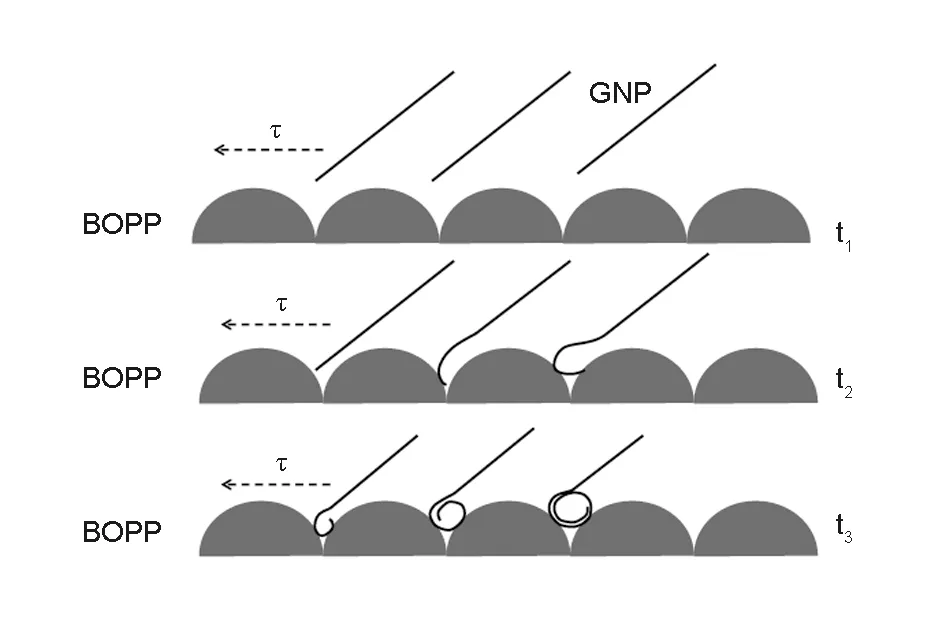
Fig. 1 Scheme of the micromechanical method used transform GNPs to carbon nanoscrolls.
The displayed time sequence (from top to bottom) illustrates the formation of a rolled nanostructure. The sliding and separation of graphene sheets take place under the weak shear forces acting along the BOPP surface. GNP and CNSs were morphologically characterized by SEM (a FEI quanta 200 FEg equipped whit an Oxford Inca Energy system 250) and TEM (a FEI Tecnai G2 Spirit TWIN whit LaB6 source). The powder containing CNSs was diluted in ethanol (98.8%) and sonicated for 10 minutes. A drop of the liquid was placed on a microscope glass and left in air until the solvent was completely evaporated. Single CNS was identified by optical microscope and analysed by micro-Raman spectroscopy (μ-RS). For the measurements a Jobin-Yvon system from Horiba ISA was used, with a TriAx 180 monochromator, equipped with a liquid nitrogen-cooled charge-coupled detector. The grating of 1 800 grooves/mm allows a final spectral resolution of 4 cm-1. The spectra were recorded in air at room temperature using a 17 mW He-Ne laser source (wavelength 632.8 nm). The spectrum accumulation time was 300 s. The laser light was focused to a 2 μm spot size on the samples through an Olympus confocal microscope with a 100 × optical objective. The laser light beam was polarized along a fixed direction (Y-axis) by a polarizing polymer filter. The same filter was used for polarize the Raman signal. By rotating the sample under the microscope objective by an angleφabout the optical axis (Z-axis), μ-RS was performed at different incidence anglesφof the polarized light with respect to the CNS orientation. The CNS axis was aligned to the Y-axis forφ= 90°. In order to determine the basic vibrational modes that contribute to the Raman signal, the spectra were analyzed in terms of convoluted Lorentzian functions by using a best-fit peak-fitting routine of a GRAMS/AI (2001, Thermo Electron) program, which is based on the Levenberg-Marquardt nonlinear least-square method. Peaks constituting the spectrum were manually selected in order to define the starting conditions for the best-fit procedure. The best-fit was then performed to determine convolution peaks with an optimized intensity, position and width. Its performance was evaluated by means of the χ2parameter. Fourier Transform Infrared (FT-IR) spectroscopy of the CNS samples was performed in the mid infrared range of energy (4 000- 400 cm-1). A FT/IR-6000 spectrometer from JASCO Inc (USA) has been used in transmission mode. An ethanol solution of CNS was dropped on the surface of a thin (thinner than 1 mm) fresh prepared pellet of KBr and left in dry air until the solvent was completely evaporated. The FT-IR spectrum was acquired in transmission mode on a surface area of about 5 mm2. A 100 scan acquisition process has been used with a spectral resolution of 1 cm-1.
3 Results and discussion
The nano-fibrous structure of the BOPP film surface was analyzed by atomic force microscopy (AFM) as shown in Fig. 2a. It can be seen that the BOPP surface is made of nanosized polypropylene fibers capable of inducing the opening of the graphite nanocrystal edges, thus causing a scrolling-up process under the effect of the applied shear stress.
Fig. 2b shows the morphology of the GNP precursor. Flat graphite nano-platelets with sharp edges can be clearly seen. The average size and thickness of the GNP precursor was of a few microns and ca. 20 nm, respectively. After the mechanical treatment the material morphology was completely modified. SEM and TEM analysis of the scrolled structures are shown in Fig. 3. Fig. 3a shows a large amount of tubular structures produced by the rolling-up of carbon sheets. They appear to be distributed all over the examined surface in presence of nanoplatelets of varying size and orientation. The reaction yield was about 14%. The produced CNSs are structurally made of continuous graphene sheets rolled up into a hollow tubular form of length ranging from 0.5 to 2.5 μm and diameter ca. 100 nm.

Fig. 2 (a) AFM image of the BOPP film nanoporous surface and (b) SEM micrograph of the GNP precursor.
The produced CNSs have been characterized by FT-IR and micro-Raman spectroscopy. Fig. 4 shows the typical FT-IR spectrum of the CNSs and assignment of the main modes. The presence of hydroxyl groups is evinced by the weak absorption peak at 1 630 cm-1and 3 360 cm-1. The enlarged spectrum in the 2 700- 3 100 cm-1range, where two prominent absorption peaks are featured at 2 849 cm-1and 2 921 cm-1is given in the inset. These modes are generally associat-ed to CH2vibrational modes and are typically obs-erved in FT-IR spectra of carbon nanotubes[35, 36]. Micro-Raman spectroscopy (μ-RS) is widely used as fast, powerful and nondestructive method for characterizing sp3carbon system and can provide information on defects of the structure. Result of the (μ-RS) scattering measurements carried out on an insulated single CNS fabricated by the shear-friction method is shown in Fig. 5 (plot (a) ).

Fig. 3 (a,b) SEM micrographs and (c, d) TEM images of CNSs.

Fig. 4 FT-IR spectrum of CNSs. The inset shows the enlarged spectrum in the 2 700- 3 100 cm-1 range.
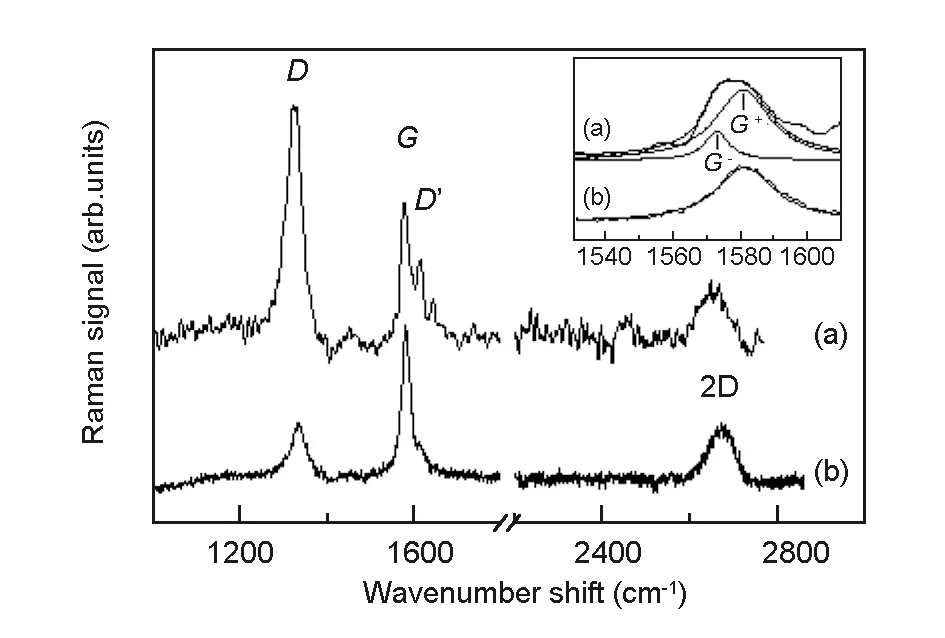
Fig. 5 (a) Raman spectra of a single CNS. Both the excitation light and the Raman signal were polarized along a fixed direction (y-axis) φ=-10° rotated with respect to the strain (x-axis) direction. The spectrum measured from unstrained flat graphene platelets is reported in (b) for comparison. Details of the G mode for both (a) and (b) spectra are reported in the inset, and fitted by Lorentzian functions.
The spectrum was recorded under ambient conditions using a 632.8 nm laser source. The laser light was focused to a 2 μm spot size on the samples under a low power irradiation to avoid additional heating effect during the measurement. In order to bring out effects related to the lattice orientation of graphene foil in the CNS, both the excitation light and Raman signal were polarized along a fixed direction (y-axis) while the sample was positioned under the microscope objective at an angleφabout the optical axis (z-axis) of the incident light (Y//Y configuration). In the case of Fig. 5, the sample was rotated by an angleφ=-10° with respect to thex-axis, normal to the polarization direction. The CNS axis was aligned to they-axis forφ=90°. The spectrum exhibits sharp features at 1 583 cm-1(Gband), 1 332 cm-1(Dband) and 1 617 cm-1(D′band), typical of disordered graphene[37]and of carbon nanoscrolls[21, 38, 39]. The Raman spectrum of graphene flat platelets has been measured in unpolarized configuration with experimental conditions similar to those used for CNSs and it is reported in Fig. 5 (plot (b)) for comparison. Peak positions are preserved but their relative intensity and shape change significantly. Some similarities occur also in the Raman spectra of CNTs, even if effects of resonantly electronic excited modes affect significantly theGpeak by adding a broad and intense component at 1 550 cm-1strongly dependent on the CNT chirality[40]. In general, theGpeak is assigned to the double degeneratedE2gphonon mode at the Brillouin-zone center while theDpeak is originated by a double resonance process involving phonons near K points and its intensity strongly depends on the disorder degree and on defects[41]. The relatively high intensity of theDandD′modes indicates the presence of disorder that may originate from defects and edges of graphene planes, presumably attributable to the considerable length of rolls. A further broad peak, the 2Dmode, is observed at about 2 650 cm-1. This peak is the second order of theDmode, but, differently from this one, it does not require the presence of disorder for its activation. The center of this mode depends on the graphene layer number, and moves to high wavenumbers when this number increases (blue shift)[42]. In our case, the 2Dmode is centered at about 2 645 cm-1, close to the value expected for graphene monolayer, and it indicates that the sample considered is constituted by a limited number of layers (lower than 5), in good agreement with morphological observations. The 2DRaman peak is expected to follow polarization features ofA1mode because overtone always contains anA1symmetry character[43, 44]. In the polarization configuration used the 2Dsignal is expected to be constant withφ, and its intensity has been used for normalizing the spectra. Similarly, theGmode intensity should not change with polarization because it corresponds to phonons withE2gsymmetry. However, theE2gsymmetry is lowered when graphene is stretched out of equilibrium and strain is induced. This is also the case of CNSs and carbon nanotubes because the curvature of the graphene foil induces a deformation of the C—C bonds that are expected to be lengthened and softened in the direction perpendicular to the axis of curvature. The un-axial strain induces a split of theGmode into two componentsG-andG+with different energies, corresponding to a fixed orientation of the vibration with respect to the strain axis[45]. This energy split is clearly observed in the CNS. When theGpeak is analyzed in terms of convolution of Lorentzian functions, two different components have been evinced (plot (a) in the inset of Fig. 5) centered at 1 573 cm-1and 1 581 cm-1, and assigned to theG-andG+mode respectively. In the case of unstrained graphene platelets (plot (b) in the inset of Fig. 5) theGmode peak can be satisfactorily fitted by a single Lorentzian function. The lower energy subbandG-is generated by phonons directed longitudinally to the strain axis,whileG+is related to phonon mode transverse to the strain axis. In the case of the CNS, the strainx-axis is directed perpendicular to the main axis of the CNS. The intensity of the two subbands depends on the rotation angleφand on the lattice orientation of the graphene sheet with respect to the CNS axis. We assume a reference system with thex-axis directed along the direction of the strain and they-axis along the direction of the CNS and callφSthe angle between they-axis and thex-axis of graphene lattice.
In the reference system of CNS shown schematically in Fig. 6a, the Raman matrices R+and R-for the two degeneratedE2gmodes can be rewritten as:
(1)
(2)
wheref-andf+are constants depending on the specific Raman scattering cross section. For the considered Y//Y polarization configuration (Fig. 6b), the intensitiesIG-andIG+of theG-andG+modes depend on anglesφandφSaccording to the following simple relations:
(3)
(4)
whereI0G-andI0G+are constants. A set ofμ-RS measurements was performed for different polarization angles on a single CNS, at angles valuesφ= -40°, -20°, 0°, 20°, 40°, 50°, 60°, 80°, 90°. The Raman response in the wavenumber range of 1 525 cm-1and 1 625 cm-1depends on the polarization angleφas shown in Fig. 7. TheGmode peak of the spectra has been analyzed in terms of convolution of Lorentzian functions, by means of a best fitting procedure.G-andG+components have been identified for each angleφ. The peak areas ofG-andG+mode normalized to the peak area of 2Dmode, are reported in Fig. 8. TheGmode intensity measurements of the normalized peak are fitted by the angular intensity distribution given by Eqs. (3) and (4). The fit procedure givesφS=9.6° and it allows to determine the axis orientation of the graphene sheet with respect to the direction normal of the CNS axis.
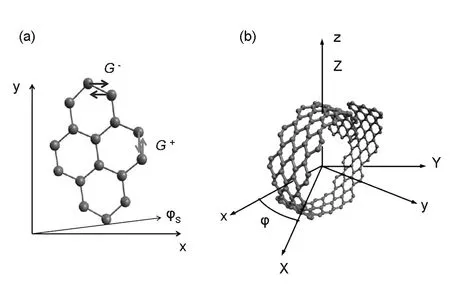
Fig. 6 (a) Schematic view of graphene with strain directed along x-axis direction. (b) Coordinate systems adopted: both excitation and signal beams are directed along thez- (Z-) axis direction, and they are polarized in the plane Y-Z.

Fig. 7 Raman spectra of an insulated CNS in the wavenumber range of G mode. Both the excitation light and the Raman signal were polarized along a fixed direction (y-axis) while the sample was rotated by an angle φ with respect to the X-axis direction.

Fig. 8 Dependence on the angle φ of the peak area of the Raman mode G- (a) and G+ (b). The data are fitted by Eq.3 and Eq.4 respectively, for the fit parameter value φS=-9.6°.
4 Conclusions
Theoretical and experimental investigations have shown that carbon nanoscrolls are nanostructures, which offer a number of advantages compared to planar graphene and are of potential interest in many applications. A convenient method for the massive production of carbon nanoscrolls is based on the shear-friction mechanism using a nanofibrous BOPP surface to transform the graphite nano-platelets to carbon nanoscrolls through rolling up the graphite layer. TEM studies have shown that the fabricated CNSs have a long tubular and fusiform structure with a hollow core surrounded by few layers of graphene. We have used micro-Raman spectroscopy to investigate the morphological changes undergone by the rolled structure. Micro-Raman analysis have allowed an accurate determination of the orientation of the graphite lattice with respect to the scroll axis from the angular distribution of the intensities of the G subbands.
[1] Bacon R. Growth, structure, and properties of graphite whiskers [J]. Journal of Applied Physics, 1960, 31(2): 283-290.
[2] Braga S F, Coluci V R, Legoas S B et al. Structure and dynamics of carbon nanoscrolls [J]. Nano Letters, 2004, 4(5): 881-884.
[3] Shi X, Pugno N M, Gao H. Mechanics of carbon nanoscrolls: A review [J]. Acta Mechanica Solida Sinica, 2010, 23(6): 484-497.
[4] Xu Z, Buehler M J. Geometry controls conformation of graphene sheets: Membranes, ribbons, and scrolls [J]. ACS Nano, 2010, 4(5): 3869-3876.
[5] Chuvilin A L, Kuznetsov V L, Obraztsov A N. Chiral carbon nanoscrolls with a polygonal cross-section [J]. Carbon, 2009, 47(13): 3099-3105.
[6] Chivilikhin S A, Popov I Y. Formation and evolution of nanoscroll ensembles based on layered-structure compounds [J]. Doklady Physics, 2009, 54(11): 491-493.
[7] Shi X, Pugno N M, Gao H. Constitutive behavior of pressurized carbon nanoscrolls [J]. International Journal of Fracture, 2011, 171: 163-168.
[8] Xia D, Xue Q, Xie J, et al. Fabrication of carbon nanoscrolls from monolayer graphene [J]. Small, 2010, 6(18): 2010-2019.
[9] Li T S, Lin M F. Quantum transport in carbon nanoscrolls [J]. Physics Letters A, 2012, 376(4): 515-520.
[10] Lacerda L, Bianco A, Prato M, et al. Carbon nanotubes as nanomedicines: From toxicology to pharmacology [J]. Advanced Drug Delivery Reviews, 2006, 58(14): 1460-1470.
[11] Mpourmpakis G, Tylianakis E, Froudakis G E. Carbon nanoscrolls: A promising material for hydrogen storage [J]. Nano Letters, 2007, 7(7): 1893-1897.
[12] Coluci V R, Braga S F, Baughman R H, et al. Prediction of the hydrogen storage capacity of carbon nanoscrolls [J]. Physical Review B, 2007, 75(12): 125404.
[13] Braga S F, Coluci V R, Baughman R H, et al. Hydrogen storage in carbon nanoscrolls: An atomistic molecular dynamics study [J]. Chemical Physics Letters, 2007, 441(1-3): 78-82.
[14] Tapasztó L, Dobrik G, Lambin P, et al. Tailoring the atomic structure of graphene nanoribbons by scanning tunnelling microscope lithography [J]. Nature Nanotechnology, 2008, 3(7): 397-401.
[15] Datta S S, Strachan D R, Khamis S M, et al. Crystallographic etching of few-layer graphene [J]. Nano Letters, 2008, 8(7): 1912-1915.
[16] Campos L C, Manfrinato V R, Sanchez-Yamagishi J D, et al. Anisotropic etching and nanoribbon formation in single-layer graphene [J]. Nano Letters, 2009, 9(7): 2600-2604.
[17] Li X, Wang X, Zhang L, et al. Chemically derived, ultrasmooth graphene nanoribbon semiconductors [J]. Science, 2008, 319(5867): 1229-1232.
[18] Wu Z S, Ren W, Gao L, et al. Efficient synthesis of graphene nanoribbons sonochemically cut from graphene sheets [J]. Nano Research, 2010, 3(1): 16-22.
[19] Viculis L M, Mack J J, Kaner R B. A chemical route to carbon nanoscrolls [J]. Science, 2003, 299(5611): 1361.
[20] Xie X, Ju L, Feng X, et al. Controlled fabrication of high-quality carbon nanoscrolls from monolayer graphene [J]. Nano Letters, 2009, 9(7): 2565-2570.
[21] Zheng J, Liu H, Wu B, et al. Production of high-quality carbon nanoscrolls with microwave spark assistance in liquid nitrogen [J]. Advanced Materials, 2011, 23(21): 2460-2463.
[22] Savoskin M V, Mochalin V N, Yaroshenko A P, et al. Carbon nanoscrolls produced from acceptor-type graphite intercalation compounds [J]. Carbon, 2007, 45(14): 2797-2800.
[23] Kosynkin D V, Higginbotham A L, Sinitskii A, et al. Longitudinal unzipping of carbon nanotubes to form graphene nanoribbons [J]. Nature, 2009, 458(7240): 872876.
[24] Jiao L, Zhang L, Wang X et al. Narrow graphene nanoribbons from carbon nanotubes [J]. Nature, 2009, 458(7240): 87780.
[25] Zhang Z, Sun Z, Yao J, et al. Transforming carbon nanotube devices into nanoribbon devices [J]. Journal of the American Chemical Society, 2009, 131(37): 1346013463.
[26] Li J L, Peng Q , Bai G Z, et al. Carbon scrolls produced by high Energy ball milling of graphite [J]. Carbon, 2005, 43(13): 2830-2833.
[27] Spreadborough J. The frictional behavior of graphite [J]. Wear, 1962, 5(1): 18-30.
[28] Chen X L, Li Li, Sun X M et al. A novel synthesis of graphene nanoscrolls with tunable dimension at a large scale [J]. Nanotechnology, 2012, 23(5): 055603.
[29] Carotenuto G, Longo A, De Nicola S, et al. A simple mechanical technique to obtain carbon nanoscrolls from graphite nanoplatelets [J]. Nanoscale Research Letters, 2013, 8: 403.
[30] Dresselhaus M S, Eklund P C. Phonons in carbon nanotubes [J]. Advances in Physics, 2000, 49(6): 705-814.
[31] Reich S, Thomsen C. Raman spectroscopy of graphite [J]. Philosophical Transactions of the Royal Society Ser A, 2004, 362(1824): 2271-2288.
[32] Nie H Y, Walzak M J, McIntyre N S. Atomic force microscopy study of biaxially-oriented polypropylene films [J]. Journal of Materials Engineering and Performance, 2004, 13(4): 451-460.
[33] Wang X, Yang D P, Huang G, et al. Rolling up graphene oxide sheets into micro/nanoscrolls by nanoparticle aggregation [J]. Journal of Materials Chemistry, 2012, 22(34): 17441-17444.
[34] Carotenuto G, De Nicola S, Palomba M, et al. Mechanical properties of low-density polyethylene filled by graphite nanoplatelets [J]. Nanotechnology, 2012, 23(48): 485705.
[35] Kim U J, Liu X M, Furtado C A, et al. Infrared-active vibrational modes of single-walled carbon nanotubes [J]. Physical Review Letters, 2005, 95(15): 157402.
[36] Kim U J, Furtado C A, Liu X et al. Raman and IR spectroscopy of chemically processed single-walled carbon nanotubes [J]. Journal of the American Chemical Society, 2005, 127(44): 15437-15445.
[37] Martins Ferreira E H, Moutinho M V O, Stavale F, et al. Evolution of the Raman spectra from single, few, and many-layer graphene with increasing disorder [J]. Physical Review B, 2010, 82(12): 125429.
[38] Roy D, Angeles-Tactay E, Brown R J C, et al. Synthesis and Raman spectroscopic characterization of carbon nanoscrolls [J]. Chemical Physics Letters, 2008, 465(4-6): 254-257.
[39] Zhou H Q, Qiu C Y, Yang H C, et al. Raman spectra and temperature-dependent Raman scattering of carbon nanoscrolls [J]. Chemical Physics Letters, 2011, 501(4-6): 475-479.
[40] Duesberg G S, Loa I, Burghard M, et al. Polarized raman spectroscopy on isolated single-wall carbon nanotubes [J]. Physical Review Letters, 2000, 85(25): 5436.
[41] Nemanich R J, Solin S A. First- and second-order Raman scattering from finite-size crystal of graphite [J]. Physical Review B, 1979, 20(2): 392-401.
[42] Ferrari A C, Meyer J C, Scardaci V, et al. Raman spectrum of graphene and graphene layers [J]. Physical Review Letters, 2006, 97(18): 187401.
[43] Yoon D, Moon H, Son Y W et al. Strong polarization dependence of double-resonant Raman intensity in graphene [J]. Nano Letters, 2008, 8(12): 4270-4274.
[44] Sahoo S, Palai R, Katiyar S. Polarized Raman scattering in monolayer, bilayer, and suspended bilayer graphene [J]. Journal of Applied Physics, 2011, 110(4): 044320.
[45] Mohiuddin T M G, Lombardo A, Nair R R, et al. Uniaxial strain in graphene by Raman spectroscopy: G peak splitting, Grüneisen parameters, and sample orientation [J]. Physical Review B, 2009, 79(20): 205433.
1007-8827(2016)06-0621-07
炭纳米卷的极性微-拉曼光谱研究
G. Carotenuto1, A. Longo1, C. Camerlingo2, S. De Nicola2, G.P. Pepe2,3
(1.CNR-IPCB,Inst.forPolymers,CompositesandBiomaterials.NationalResearchCouncil,VialeKennedy, 54.Mostrad’OltremarePad. 20-80125Naples,Italy;2.CNR-SPIN,Inst.forSuperconductors,oxidesandotherinnovativematerialsanddevices,NationalResearchCouncil,C.Univ.M.S.Angelo,ViaCinthia,80126Naples,Italy;3.DipartimentoScienzeFisiche,UniversityofNaplesFedericoII,ViaCinthia,80126Naples,Italy)
采用剪切-摩擦机理,通过卷曲将双轴取向聚丙烯纤维表面转变成石墨纳米片,从而制备出炭纳米卷。通过光学和扫描电镜、透射电镜和红外光谱仪等手段对炭纳米卷的形貌进行分析。微-拉曼测试表征了卷曲结构的形貌变化。从振动的G模式分裂可知,石墨片取向度与卷曲轴有关。
炭纳米卷; 剪切应力; 双轴取向聚丙烯; 石墨纳米片; 微-拉曼光谱
TQ127.1+1
A
C. Camerlingo. E-mail: carlo.camerlingo@spin.cnr.it
C. Camerlingo. E-mail: carlo.camerlingo@spin.cnr.it
10.1016/S1872-5805(16)60036-7
English edition available online ScienceDirect ( http:www.sciencedirect.comsciencejournal18725805 ).
