微灌石英砂过滤器反冲洗数值模拟验证与流场分析
2016-12-19李景海翟国亮黄修桥冯俊杰
李景海,翟国亮,黄修桥※,冯俊杰,刘 杨
(1. 中国农业科学院农田灌溉研究所/河南省节水农业重点实验室,新乡 453002;2. 安阳市水资源管理委员会办公室,安阳 455000)
微灌石英砂过滤器反冲洗数值模拟验证与流场分析
李景海1,2,翟国亮1,黄修桥1※,冯俊杰1,刘 杨1
(1. 中国农业科学院农田灌溉研究所/河南省节水农业重点实验室,新乡 453002;2. 安阳市水资源管理委员会办公室,安阳 455000)
微灌石英砂滤层的反冲洗,是实现滤料再生的有效途径,为了对反冲洗过程流场进行分析,并确定合理的反冲洗速度。该文建立了石英砂过滤器几何模型并进行了网格划分,采用Eulerian模型作为石英砂滤层反冲洗数值模拟模型,分别对石英砂当量粒径为1.06、1.2和1.5 mm的3种滤层的反冲洗过程进行了瞬态模拟,并将滤层整体压降和整体密度的模拟结果与试验结果进行对比,结果显示,整体压降的最大模拟误差为7.03%,整体密度的最大模拟误差为1.93%,说明数值模拟准确可信。在此基础上,分析了石英砂滤层反冲洗过程压降的波动规律、压降均值和压降标准偏差随反冲洗速度的变化趋势;并分析了滤层密度的分布规律、密度均值和密度标准偏差随反冲洗速度的变化趋势。根据压降波动的稳定性,结合滤层密度分布的稳定性,确定了石英砂滤层反冲洗强度的合理范围,3种滤层分别为0.0149~0.0212、0.0146~0.0218和0.0191~0.0261 m/s。该研究为石英砂滤层反冲洗过程的机理研究提供了参考,为砂过滤器反冲洗性能参数的确定提供了依据。
灌溉;模型;计算机仿真;石英砂滤层;反冲洗;多相流
0 引言
砂过滤器的反冲洗,是实现砂滤料再生的一个有效途径。不少学者对砂过滤器的反冲洗进行了研究,董文楚[1-2]对碎石英砂特性、反冲洗强度与膨胀率进行了研究,翟国亮等[3-4]对均质石英砂反冲洗参数进行了试验研究,冯俊杰等[5]设计出了水压驱动反冲洗阀,邓忠等[6]对石英砂过滤器在反冲洗条件下,泥沙出水浊度、出水粒径级配随时间的变化规律进行了测定分析。赵红书[7]对堵塞的过滤模型进行了正交反冲洗试验。
试验研究的结果具有直观、可信的特点,但试验研究往往会受到流场扰动、测量精度等因素的限制。随着多相流体动力学理论的不断完善和高性能计算技术的迅猛发展[8],对微灌过滤器进行数值模拟成为现实,不少学者进行了相关研究[9-13],但目前对砂过滤器反冲洗的多相流模拟尚不多见[14]。
在前期研究的基础上[15],本文首先开展了石英砂滤层反冲洗试验,然后建立了石英砂过滤器几何模型并进行了网格划分,采用Eulerian模型对3种粒径的石英砂滤层的反冲洗进行了瞬态数值模拟,并将模拟结果与试验结果进行对比,对比结果说明了数值模拟的可行性。在此基础上,分析了石英砂滤层反冲洗过程压降的波动规律和滤层密度的分布规律,根据压降波动的稳定性,结合滤层密度分布的稳定性,确定了石英砂滤层反冲洗强度的合理范围,以期为石英砂滤层反冲洗过程的机理研究提供参考,为砂过滤器的运行提供技术支撑。
1 微灌石英砂滤层反冲洗试验
试验在中国农业科学院农田灌溉研究所进行。试验用滤料为石英砂,采用粒径范围为1.0~1.18、>1.18~1.4 和>1.4~1.7 mm的3种滤层。经测算,3种滤层当量粒径分别为1.06、1.2和1.5 mm。结合砂过滤器实物,设计并建立了试验用模型装置,如图1所示,主过滤室使用透明有机玻璃管制作,有机玻管内径200 mm、高1 600 mm,在其上每隔100 mm高度打孔,设为测压取料孔,有机玻管上下两端使用特制的封头密封,下端封头安装3个滤帽。石英砂滤料放置于主过滤室内,滤层孔隙率0.44,厚400 mm。试验时,使用水池供水,采用涡轮流量计(LWGY-25)测流量,滤层内部压差采用U型压差计测量。
反冲洗时,利用水泵将清水从反冲洗进水口注入过滤器模型,通过砂过滤器底部滤帽将水流分散并均匀作用于滤料,试验过程中,记录下每一个反冲洗速度对应的滤层膨胀高度、滤层压降。
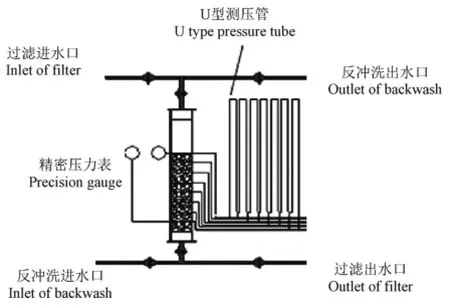
图1 试验装置示意图Fig.1 Schematic diagram of test device
2 石英砂滤层数值模拟
2.1 模拟模型
在微灌石英砂反冲洗过程中,石英砂滤层仅在一定范围内上下波动而不被水流带到过滤器外部,即石英砂只集中在区域的一部分且所占体积分数较大,同时,石英砂与水的两相流是不可压缩的且是有黏性的,基于以上特点,采用Eulerian模型模拟石英砂滤层的反冲洗是比较合适的[16]。
均质石英砂滤层的反冲洗,可以认为是由水与石英砂组成的固液两相流,Eulerian模型[17]中固液两相流连续性方程如下
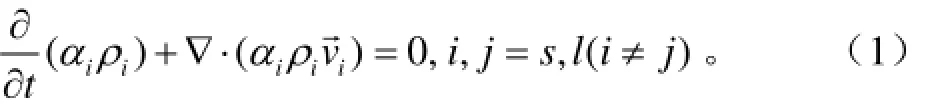
动量方程可表示为
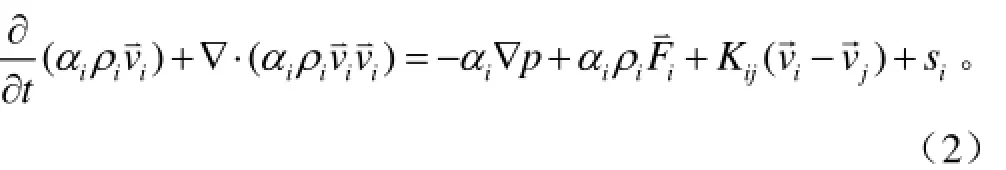
式中αi为相体积分数;ρi为相密度,m3/s;t为时间,s;为相速度,m/s;P为压力项,Pa;
守恒方程需要由固液曳力系数、固相应力相这两种本构方程来实现封闭。曳力系数项可增加到动量守恒方程相间作用系数Kij来计算,固相应力项可增加到源项si中计算。
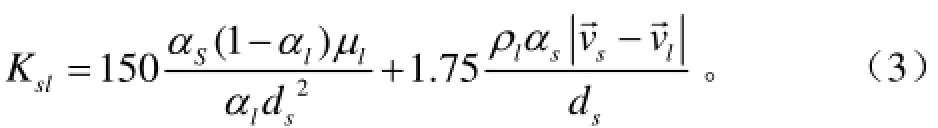
液固交换系数Ksl仅是液相体积分数或固相体积分数的函数,而石英砂与水的混合物中,水的体积分数一般要小于0.8。因而,对于Gidaspow提出的曳力模型[18],当αl≤0.8,适用于石英砂滤层的反冲洗模拟,即石英砂滤层反冲洗模拟的曳力模型为式中μl为流体黏度,Pa·s;ds为颗粒直径,m;其余同上。
水与石英砂两相流固相应力模型为[19]
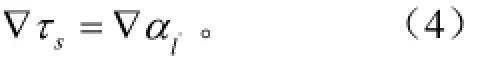
式中τs为固相应力,Pa;αl为液相体积分数。
2.2 模型边界条件及算法设置
采用Gambit软件建立几何模型,过滤器几何模型与细部结构见图2和图3。
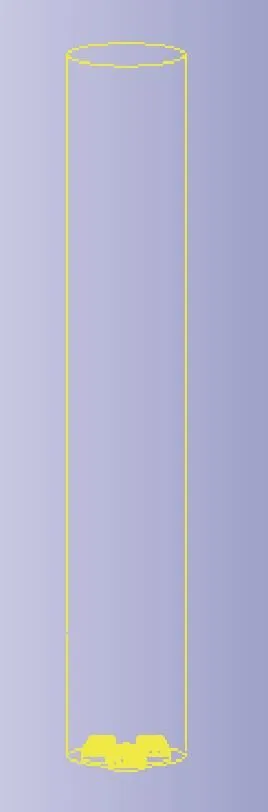
图2 石英砂过滤器数值模拟三维模型Fig.2 3D model of numerical simulation for quartz sand filter
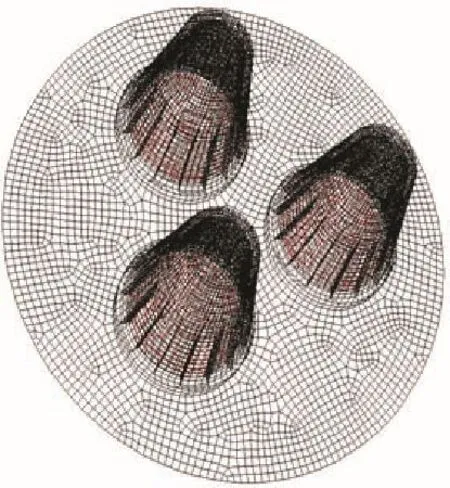
图3 滤帽几何模型Fig.3 Geometry model of filter cap
控制方程采用二阶隐式时间方案,采用瞬态求解器计算。多相流模型采用Eulerian模型,压力速度耦合方程用PC-SIMPLE算法,空间离散化采用基于Green-Gauss的梯度方程,动量、湍动能、湍流耗散率和体积分数方程均采用一阶迎风格式,进口边界条件为velocity-inlet,出口边界条件为pressure-outlet,采用速度进口对流场进行初始化,单位时间步长为0.01 s,单位时间步长最大迭代次数为7。
3 计算结果分析
3.1 滤层压降计算结果分析
3.1.1 滤层压降的试验验证
根据入口的反冲洗流速,由CFD软件计算出滤层的整体压降,绘出滤层整体压降随反冲洗速度的变化关系图并与试验值进行对比(图4)。
由图4可知,当滤层当量粒径为1.06 mm时,滤层压降最大误差为6.25%;当滤层当量粒径为1.2 mm时,滤层压降最大误差为5.64%;当滤层当量粒径为1.5 mm时,滤层压降最大误差为7.03%。对比结果说明,滤层压降试验值与模拟值能够较好地吻合,模拟结果准确可信。
根据图4中曲线的变化趋势可知,在反冲洗速度较小时,滤层压降随反冲洗速度的增大呈线性变化关系。当反冲洗速度达到滤层的最小流化速度后,滤层压降达到最高值,此后,随着反冲洗速度的继续增加,滤层压降基本保持稳定。当量粒径为1.06、1.2和1.5 mm的滤层对应的最小流化速度分别为0.0121、0.0146和0.0160 m/s。
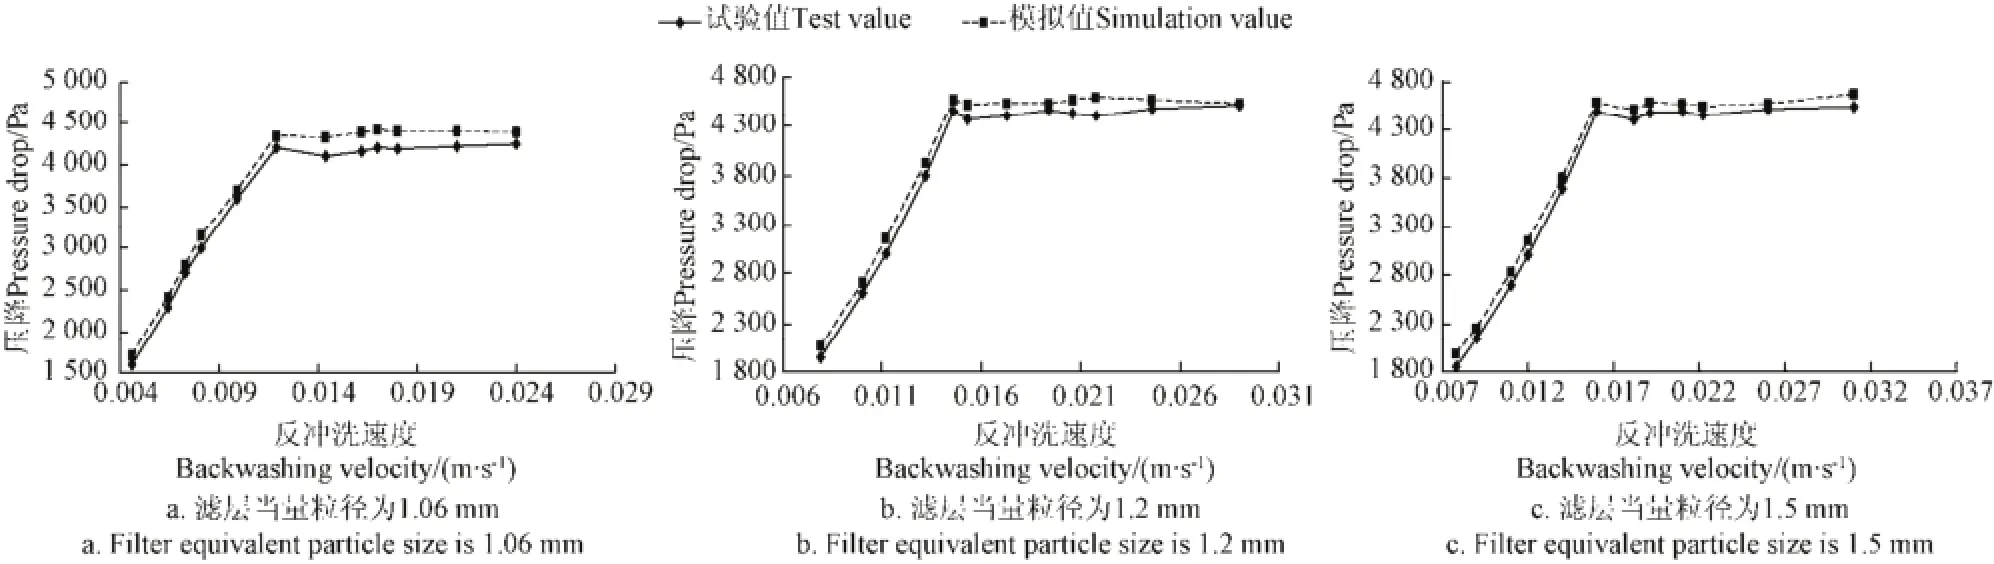
图4 滤层压降随反冲洗速度变化关系图Fig.4 Relation curve of filter layer pressure drop with change of back washing velocity
显然,只有当滤层完全流化后,才能达到较好的反冲洗效果。本文选取滤层完全流化后的5个反冲洗速度,并选取滤层高度H为15、25和35 cm的3个横截面对滤层压降和密度进行分析。对于当量粒径为1.06 mm的滤层,选取的反冲洗速度v分别为:0.0121、0.0149、0.0180、0.0212和0.0240 m/s。对于当量粒径为1.2 mm的滤层,选取的反冲洗速度v分别为:0.0146、0.0196、0.0218、0.0246和0.0291 m/s。对于当量粒径为1.5 mm的滤层,选取反冲洗速度v分别为:0.0160、0.0191、0.0222、0.0261 和0.0310 m/s。
3.1.2 滤层压降的波动规律
滤层压降波动是否稳定,是衡量滤层流化质量的重要标准,对反冲洗效果有直接影响。对于3种滤层,分别绘制3个横截面上,5个反冲洗速度对应的压降随时间的变化关系曲线,如图5~图7。
分析图5、图6和图7可知,当反冲洗水流进入滤层时,滤层开始流化,在流化的初始阶段,滤层各个截面的压降值有一个急剧的大幅波动,并在极短时间内恢复至某一固定值,此后,滤层截面压降不再发生突变,而是随时间在这一固定值附近上下波动,呈现一个比较稳定的状态。同时可以看出,滤层压降随滤层截面高度的增加而增加。造成这种波动现象的原因是,在反冲洗的初期,石英砂滤层处于完全的自然堆积状态,颗粒间孔隙率低,孔隙非常小,水流从滤层底部进入滤层的时候,需要克服较大的滤层阻力才能上升。当水流开始进入滤层时,滤层在短时间内经历了由自然堆积到迅速膨胀的过程,此时,滤层压降达到最大值。石英砂颗粒在强劲水流的冲击下迅速上升,孔隙率迅速增大,反冲洗水流速度则随之减小,被水流携带的颗粒在重力作用下迅速下降,此时滤层压降又达到最小值。经过这个短暂的突变过程后,滤层孔隙率与水流速度逐渐相适应,压降基本保持稳定,并随时间以某一固定值为基准上下波动。
为了分析滤层压降波动的稳定性,对3种滤层,计算3个截面压降的平均值,绘出压降均值随反冲洗速度的变化关系图(图8)。计算3个截面压降的标准偏差,绘出压降标准偏差随反冲洗速度的变化关系图(图9)。
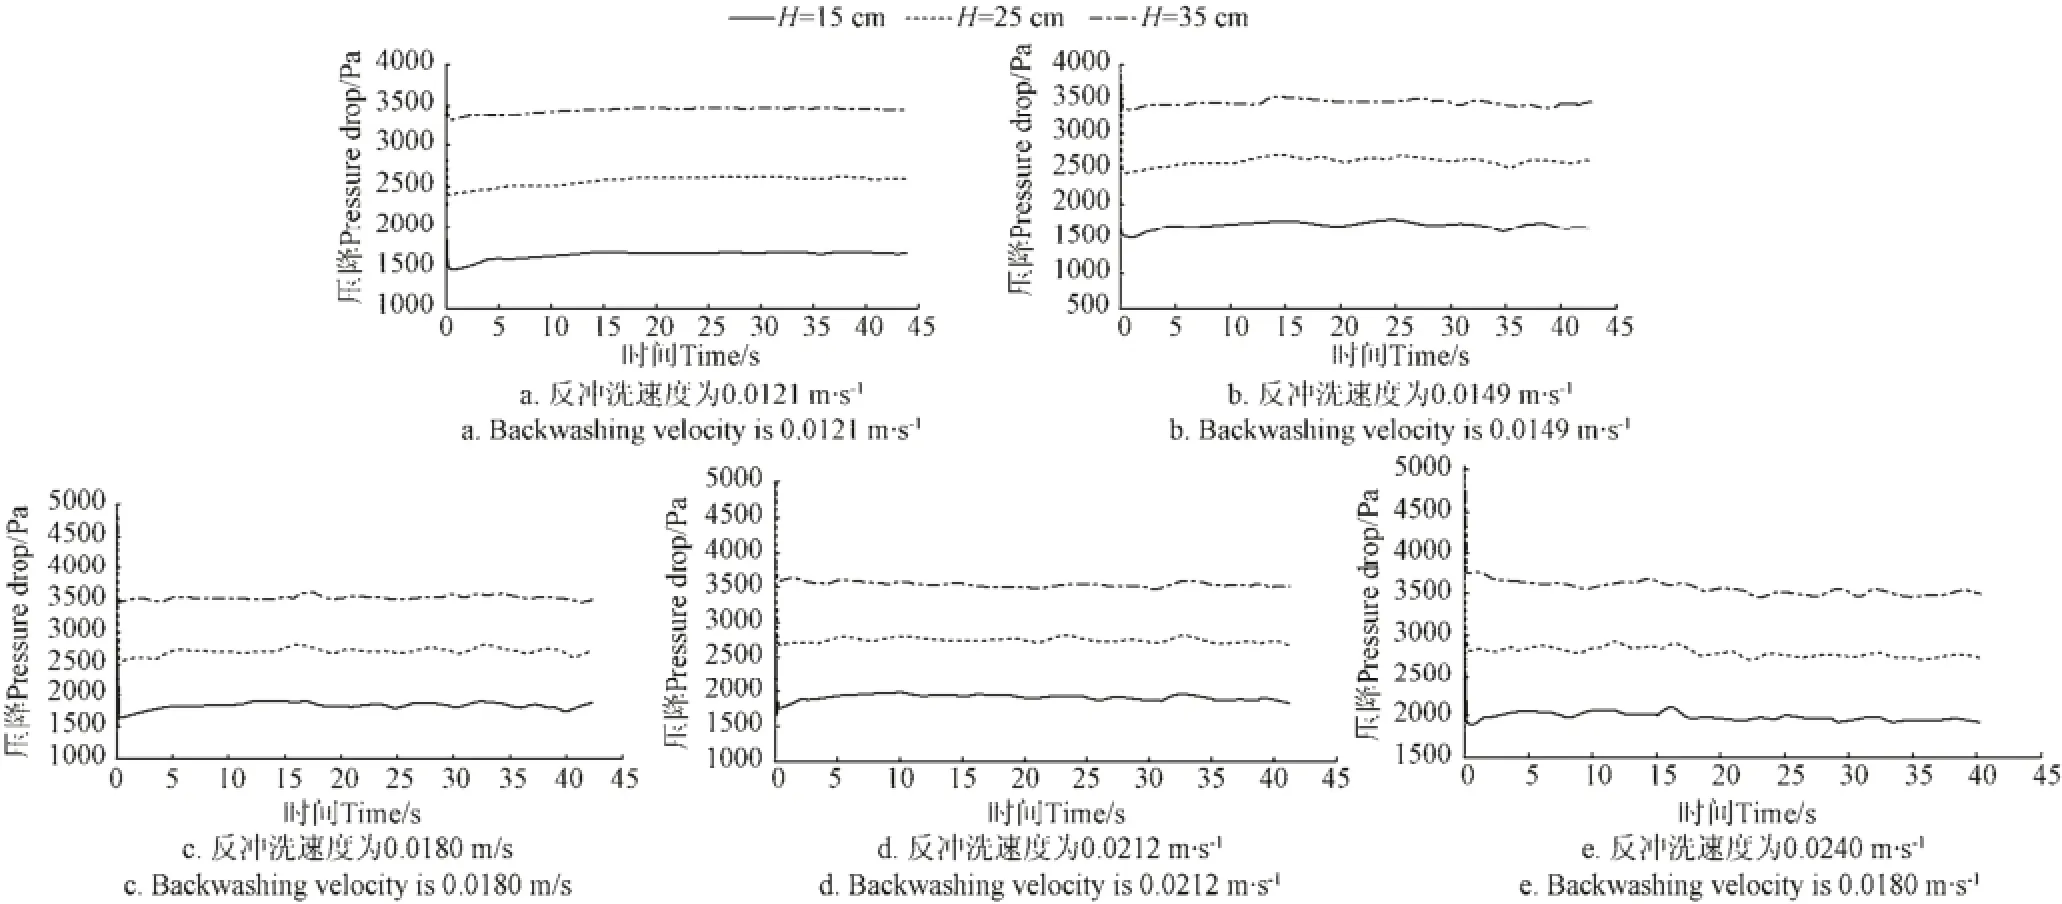
图5 压降随时间变化关系曲线(当量粒径为1.06 mm)Fig.5 Relation curve of pressure-drop and time (Filter equivalent particle size is 1.06 mm)
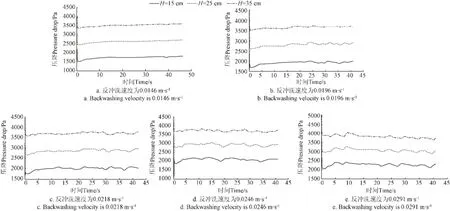
图6 压降随时间变化关系曲线(当量粒径为1.2 mm)Fig.6 Relation curve of pressure-drop and time (Filter equivalent particle size 1.2 mm)
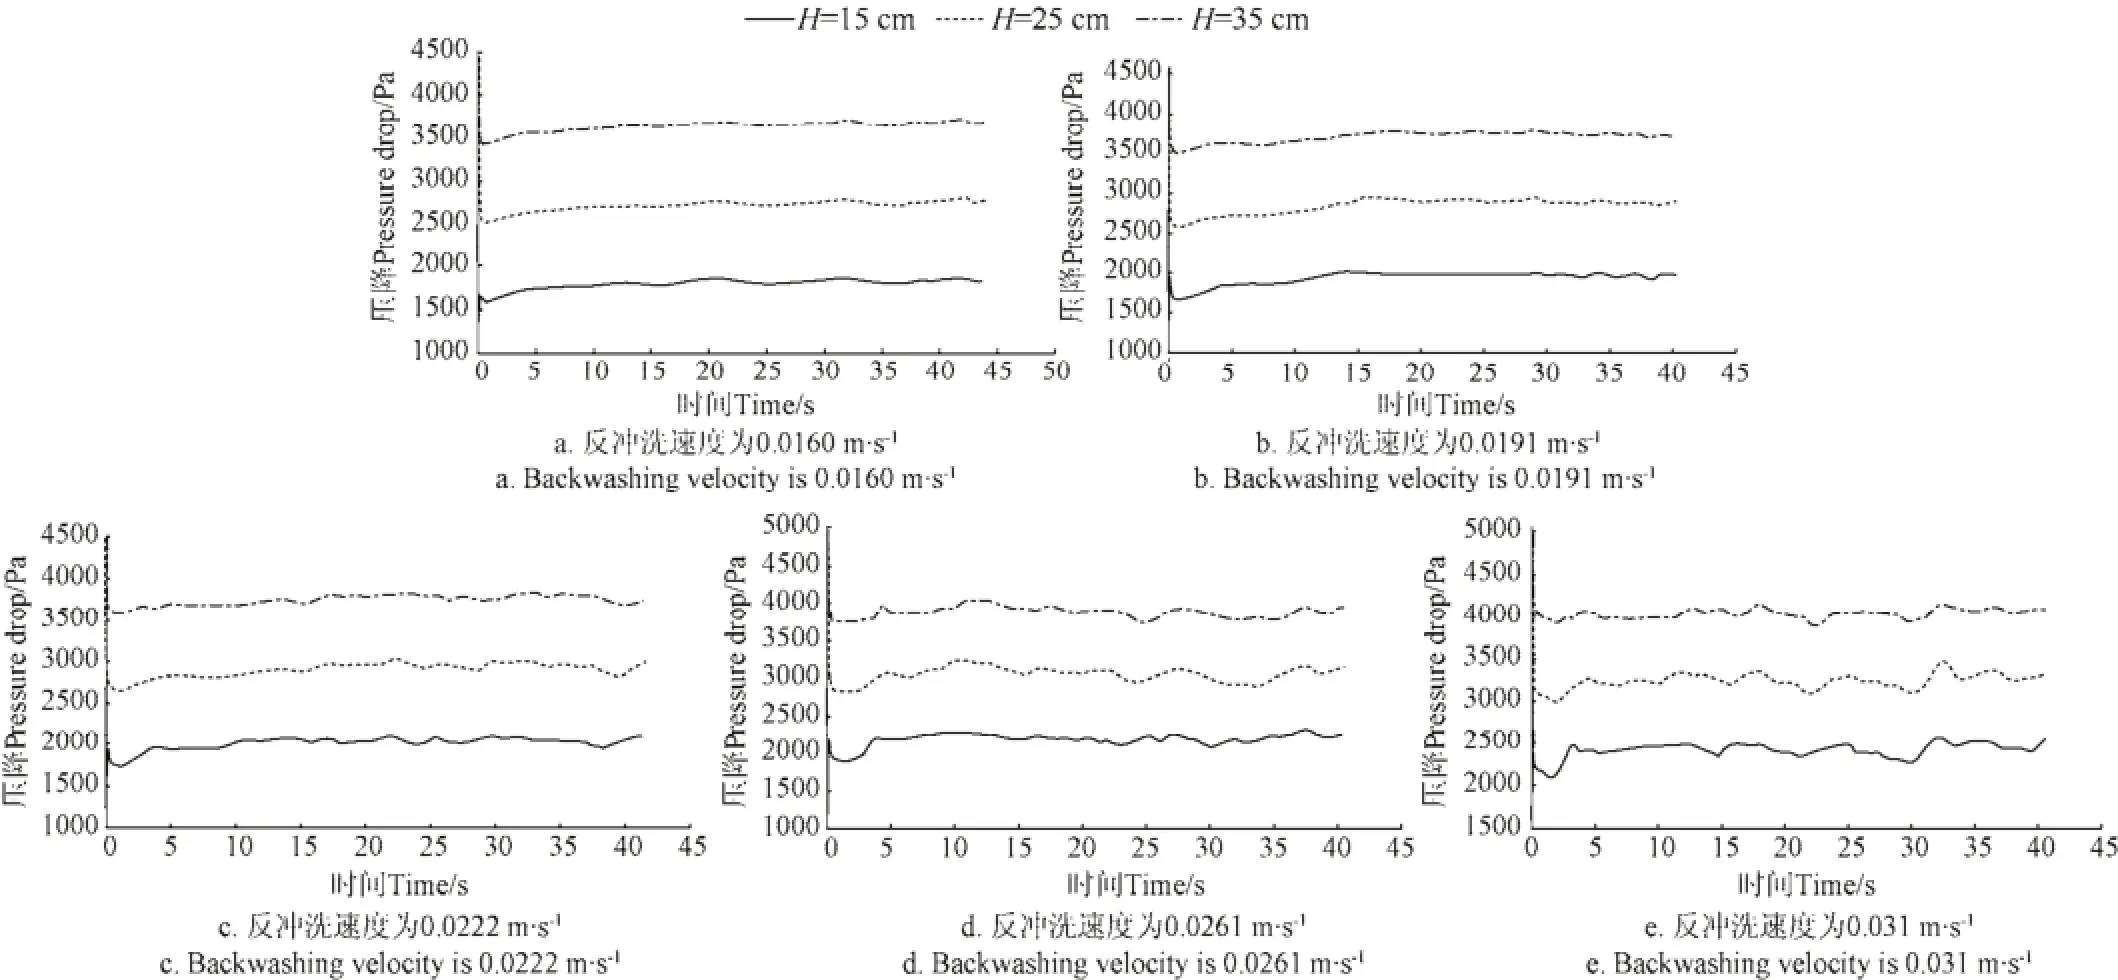
图7 压降随时间变化关系曲线(当量粒径为1.5 mm)Fig.7 Relation curve of pressure-drop and time (Filter equivalent particle size is 1.5 mm)
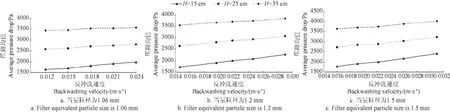
图8 压降均值随反冲洗速度的变化关系曲线Fig.8 Relation curve of average pressure drop and backwashing velocity
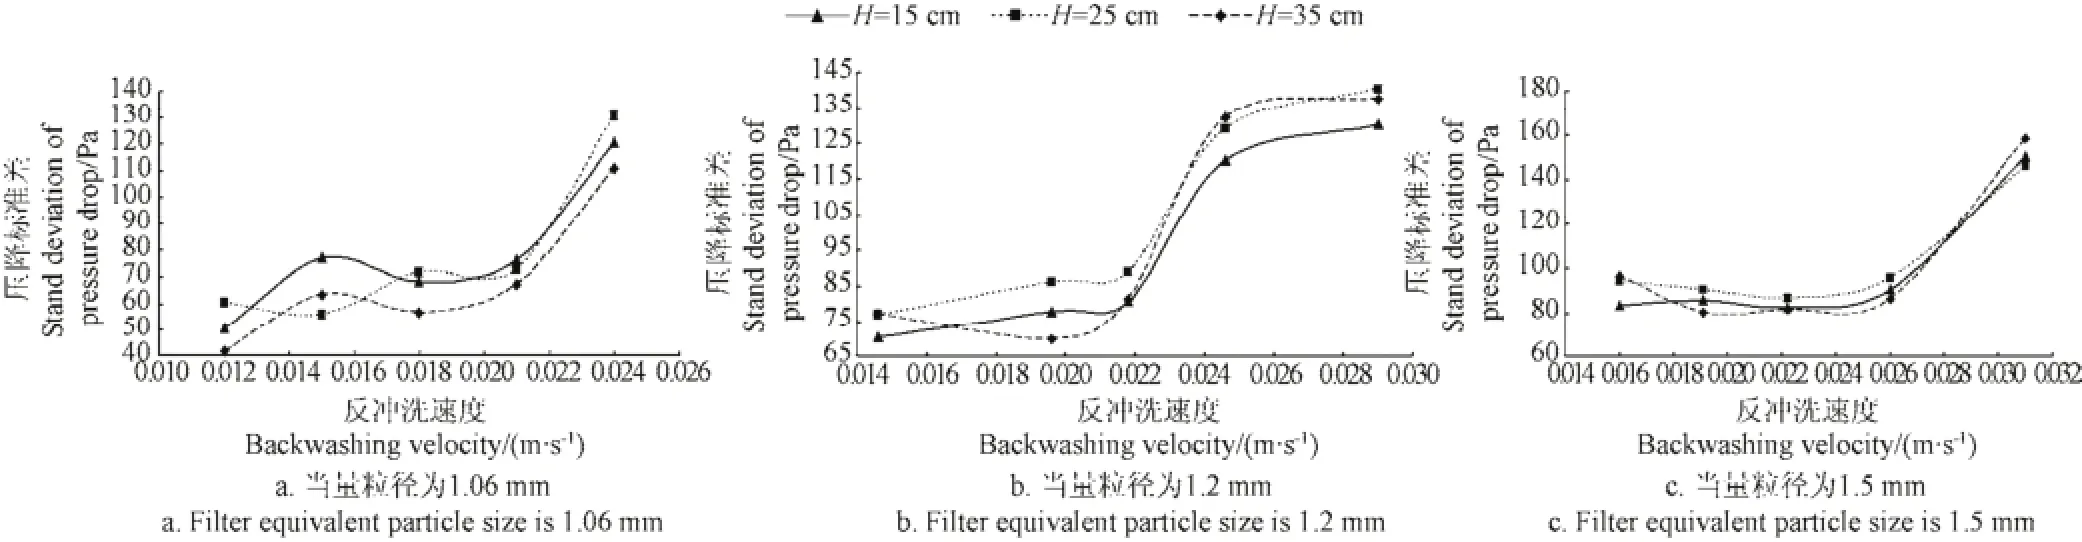
图9 压降标准偏差随反冲洗速度的变化关系曲线Fig.9 Relation curve of pressure drop standard deviation and backwashing velocity
分析图8和图9可知,对于当量粒径为1.06 mm的滤层,当反冲洗速度≤0.0212 m/s时,3个截面的压降均值随反冲洗速度的增加基本保持稳定,压降标准偏差值较小,也基本保持稳定。当反冲洗速度≥0.0240 m/s时,压降均值仍然保持稳定,但压降标准偏差却明显增加,这说明滤层波动幅度增大,稳定性开始变差。所以,对于当量粒径为1.06 mm的滤层,反冲洗速度不宜超过0.0212 m/s。
同理可知,对于当量粒径为1.2 mm的滤层,反冲洗速度不宜超过0.0218 m/s。对于当量粒径为1.5 mm的滤层,反冲洗速度不宜超过0.0261 m/s。
3.2 滤层密度的分布规律分析
3.2.1 滤层密度的试验验证
将滤层混合体密度的试验值与模拟值(图10)对比可知,当滤层当量粒径为1.06 mm时,滤层水砂混合体密度的最大误差为0.81%;当滤层当量粒径为1.2 mm时,滤层水砂混合体密度的最大误差为0.87%;当滤层当量粒径为1.5 mm时,滤层水砂混合体密度的最大误差为1.93%。对比结果说明,滤层水砂混合体密度的试验值与模拟值能够较好地吻合,模拟结果准确可信。
图10 滤层密度随反冲洗速度变化关系图Fig.10 Relation curve of filter layer density with change of backwashing velocity
图11 密度随时间变化关系曲线(当量粒径为1.06 mm)Fig.11 Relation curve of density and time (Filter equivalent particle size is 1.06 mm)
3.2.2 滤层横截面的密度分布
滤层密度分布是否均匀,关系到滤层在反冲洗过程中是否存在局部堆积。对于密度的分析,反冲洗速度和滤层截面选取与压降相同。
对于3种滤层,分别绘制3个横截面上,5个反冲洗速度对应的密度随时间的变化关系曲线,如图11~图13。
分析图11~图13可知,在反冲洗的初始阶段,滤层密度先由自然堆积状态迅速降至最低点,然后又在极短时间内回升,而后经过几个周期的波动逐渐稳定至某一固定值,并围绕这一固定值上下波动。密度呈现的波动规律与压降随时间的波动规律基本一致,主要原因在于,密度的上下波动是由于压降的上下波动引起的。
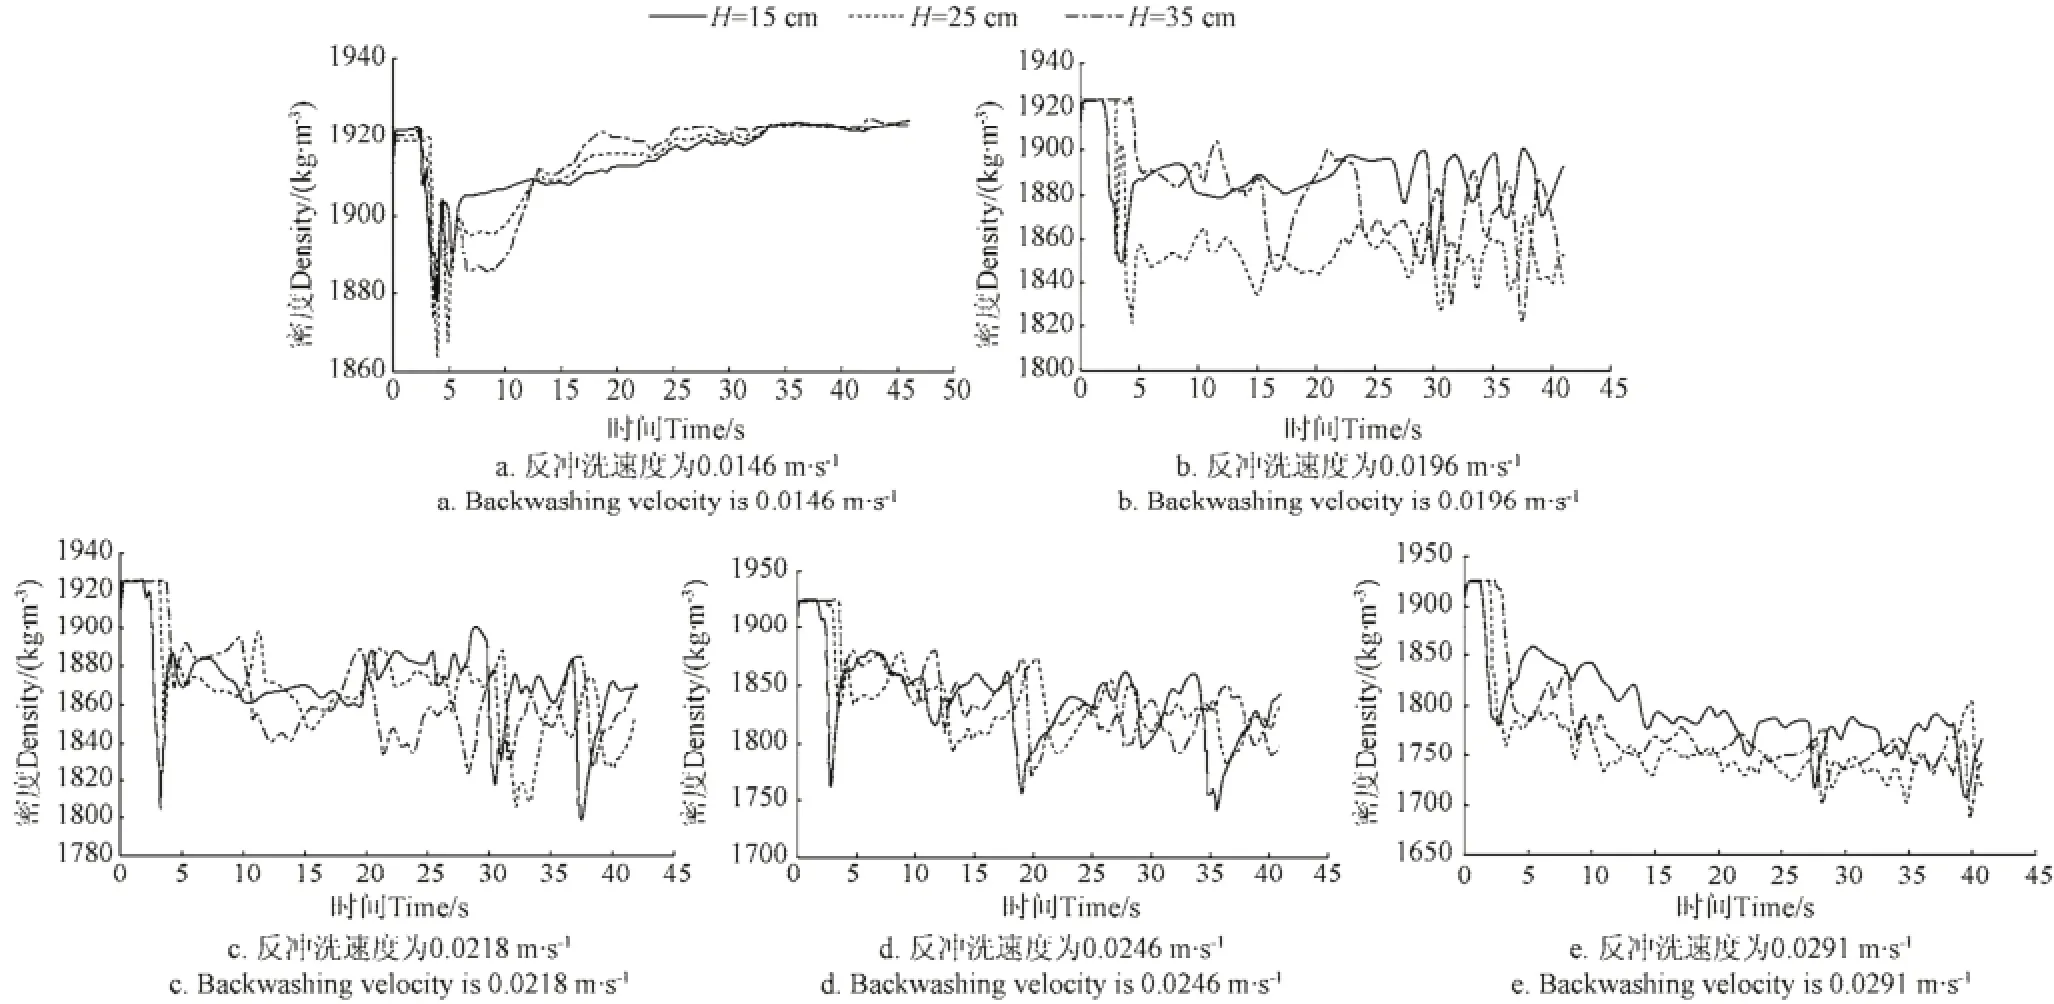
图12 密度随时间变化关系曲线(当量粒径为1.2 mm)Fig.12 Relationship of density and time (Filter equivalent particle size is 1.2 mm)
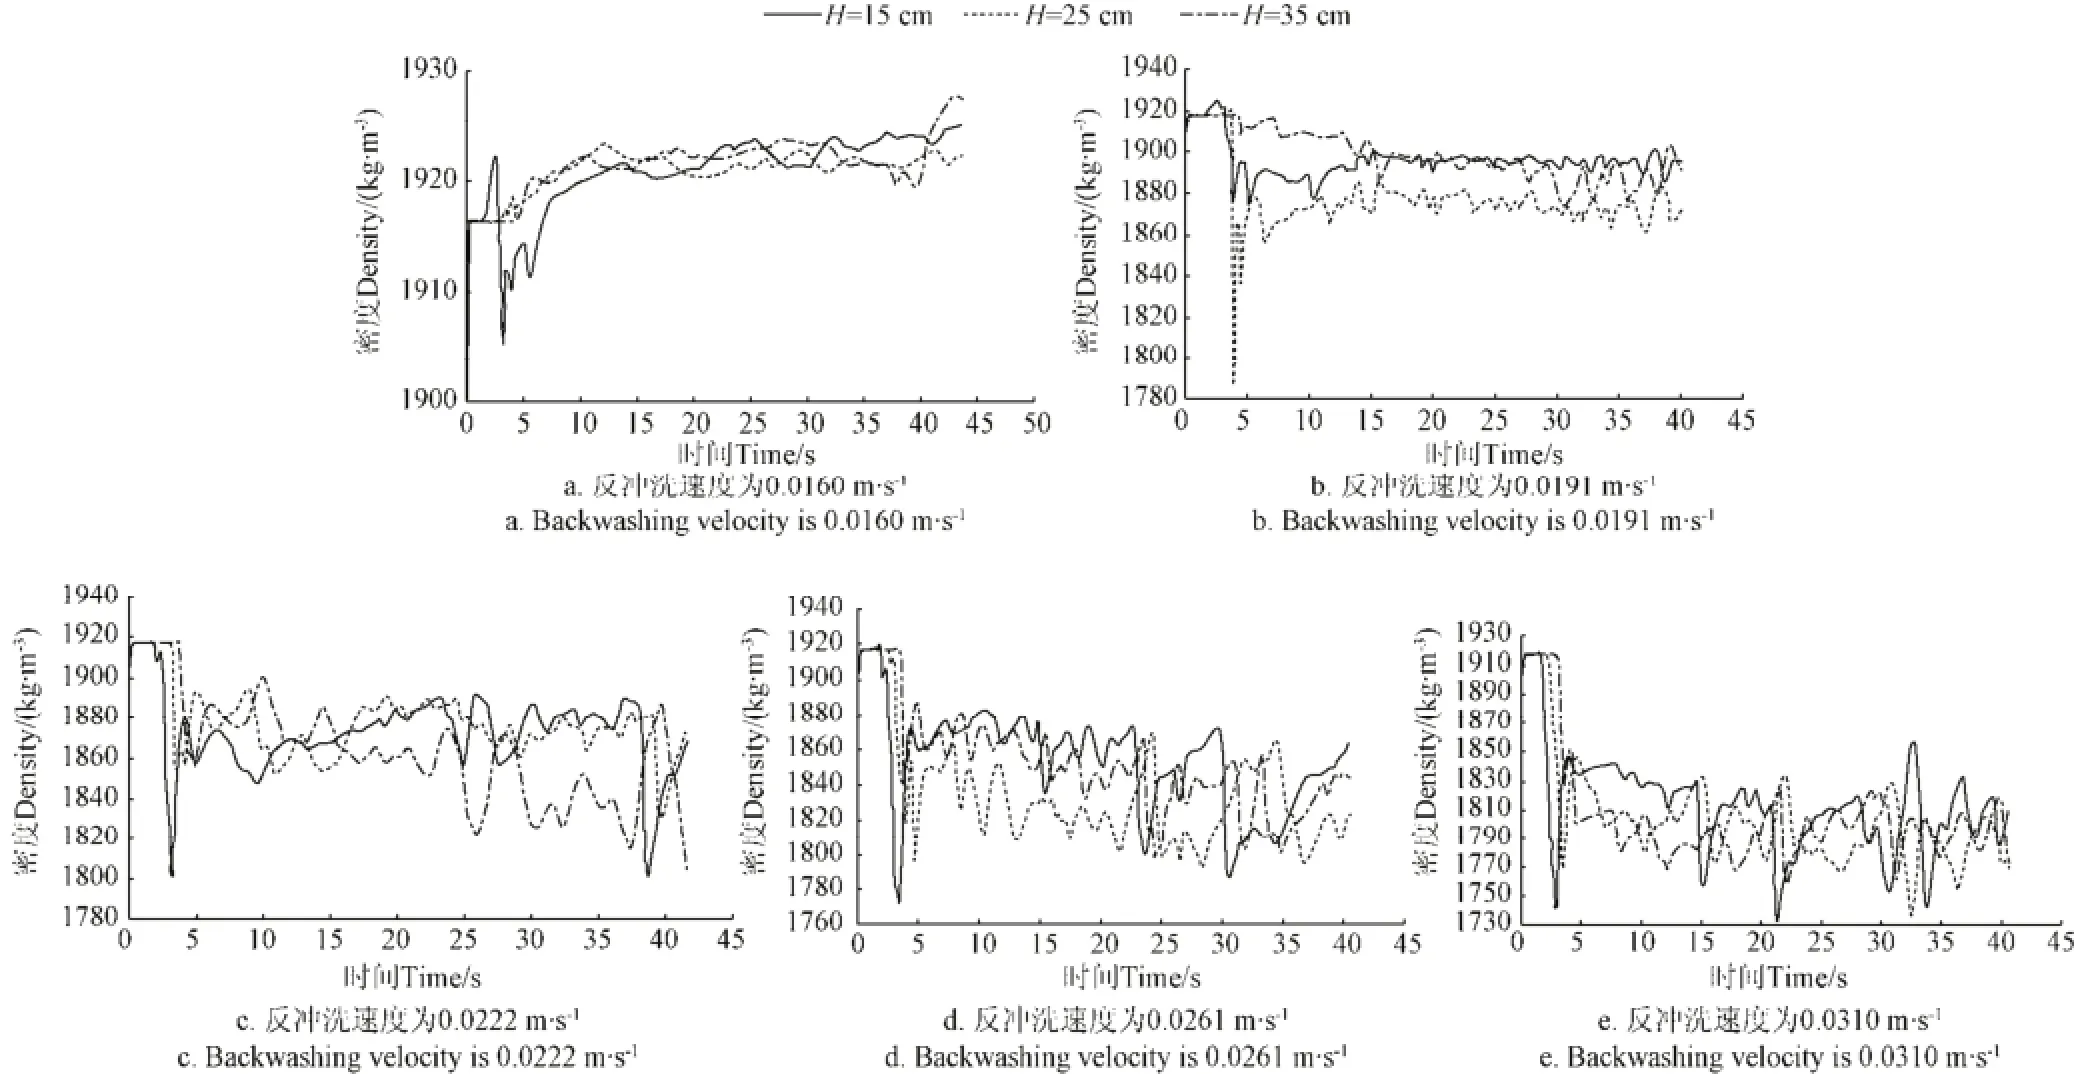
图13 密度随时间变化关系曲线(当量粒径为1.5 mm)Fig.13 Relationship of density and time (Filter equivalent particle size is 1.5 mm)
为了分析滤层密度分布的均匀性,对3种滤层,计算3个截面密度的平均值,绘出密度均值随反冲洗速度的变化关系图(图14)。计算3个截面密度的标准偏差,绘出密度标准偏差随反冲洗速度的变化关系图(图15)。
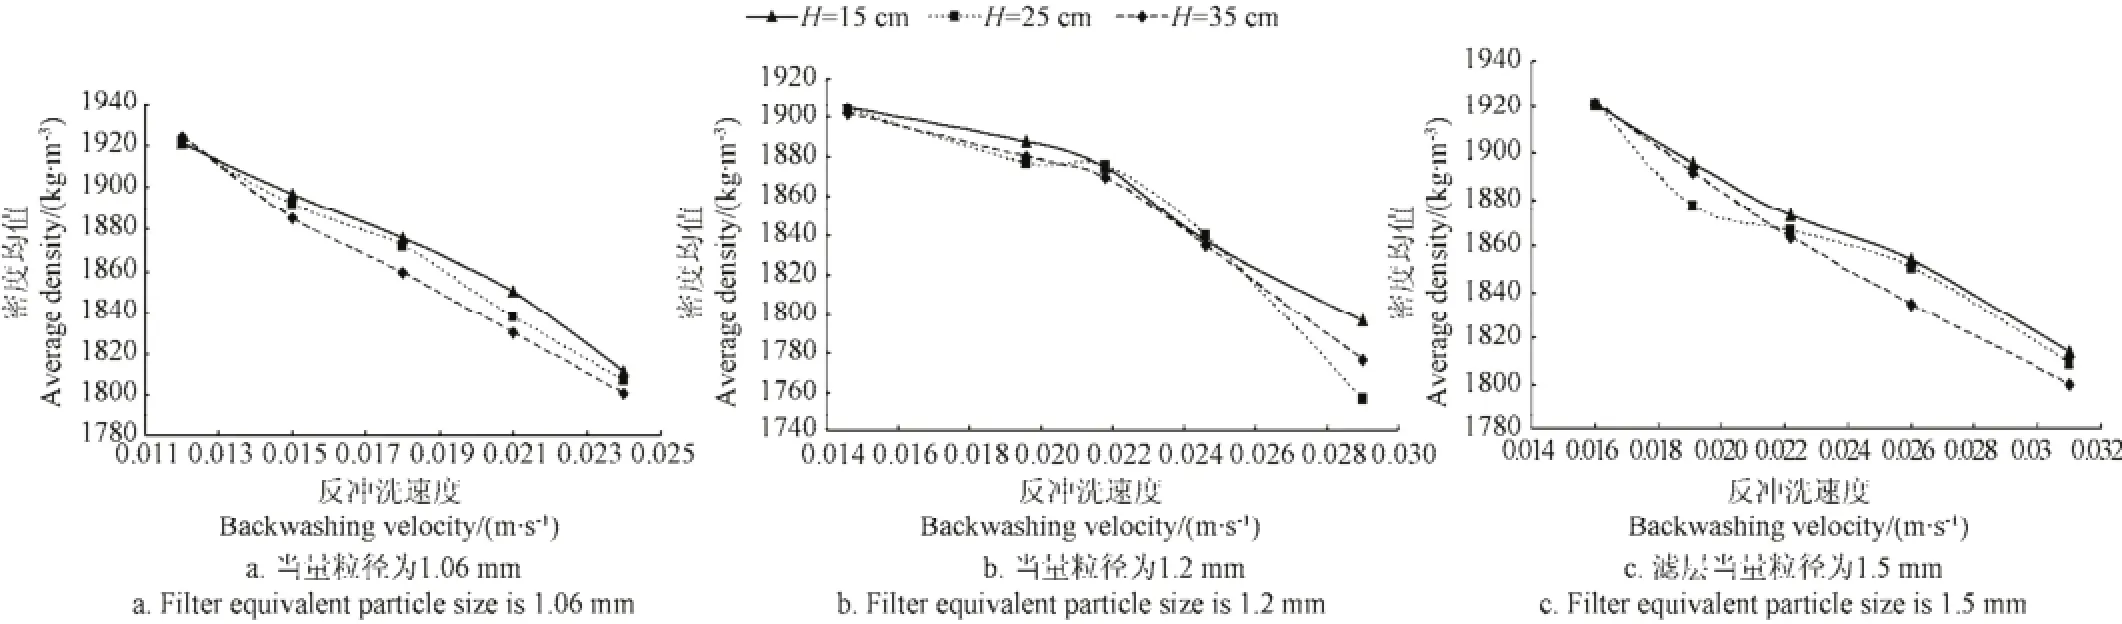
图14 密度均值随反冲洗速度的变化关系曲线Fig.14 Relation curve of average density and back washing velocity
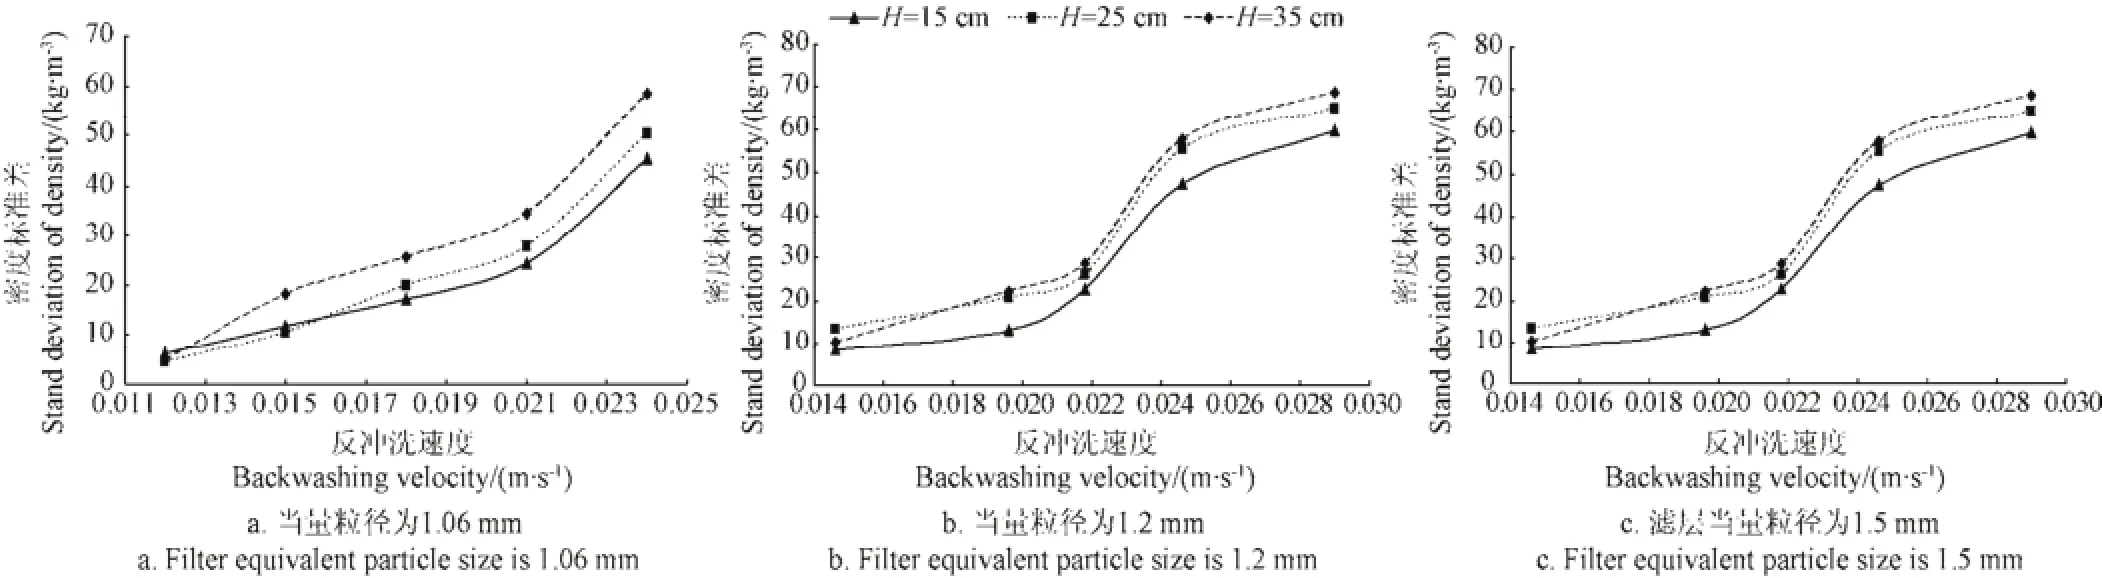
图15 密度标准偏差随反冲洗速度的变化关系曲线Fig.15 Relation curve of density standard deviation and back washing velocity
分析图14和图15,对于当量粒径为1.06 mm的滤层,由密度标准偏差变化趋势可以看出,当反冲洗速度为0.0121、0.0149、0.0180和0.0212 m/s时,密度标准偏差的变化趋势比较平缓,而当反冲洗速度为0.0240 m/s时,标准偏差明显增大,说明密度波动的稳定性变差,不利于反冲洗效果的增强。同时,由密度均值的变化趋势可以看出,密度均值随反冲洗速度的增加而呈减小趋势,密度变小,说明水的体积分数增大,对反冲洗有利。但反冲洗速度0.0121 m/s对应的滤层密度高于1 920 kg/m3,几乎接近于滤层的静止状态,因而不适于进行反冲洗。因此,对于当量粒径为1.06 mm的滤层,适宜的反冲洗速度范围为0.0149~0.0212 m/s。
同理可知,对于当量粒径为1.2 mm的滤层,适宜的反冲洗速度范围为0.0146~0.0218 m/s。对于当量粒径为1.5 mm的滤层,适宜的反冲洗速度范围为0.0191~0.0261 m/s。
3.3 合理反冲洗速度的确定
综合滤层压降与密度的波动规律可知,对于当量粒径为1.06 mm的滤层,适宜的反冲洗速度范围为0.0149~0.0212 m/s;对于当量粒径为1.2 mm的滤层,适宜的反冲洗速度范围为0.0146~0.0218 m/s;对于当量粒径为1.5 mm的滤层,适宜的反冲洗速度范围为0.0191~0.0261 m/s。
4 结论与讨论
4.1 结 论
1)采用Eulerian模型作为反冲洗模拟模型,对石英砂滤层反冲洗过程进行了瞬态模拟,并且通过室内试验对模拟结果进行了验证,结果显示该模拟方法是可行的。
2)分析了压降的波动规律,确定了使压降波动保持稳定的反冲洗速度。对滤层密度进行数值模拟,分析了密度的分布规律,确定了使密度均匀性保持稳定的反冲洗速度。
3)结合滤层密度和压降的波动规律,确定了3种滤层反冲洗速度的合理范围,分别为0.0149~0.0212、0.0146~0.0218和0.0191~0.0261 m/s。
4.2 讨 论
在反冲洗模拟方面,由于滤层中杂质颗粒粒径小、体积分数小,在反冲洗稳定后,可以近似认为对流场不产生影响,因而没有考虑对滤层中杂质的模拟。对于杂质的模拟,主要难点在于,杂质颗粒种类多、粒径分布广,对于杂质颗粒的描述存在困难,而且在多相流的模拟过程中,每增加一相,模拟量会增加十几倍,对于计算机的要求较高。
[1] 董文楚. 微灌用砂过滤器的过滤与反冲洗[J]. 中国农村水利水电,1996(12):15-20. Dong Wenchu. On filtering and inverse washing of sandy filter in micro-irrigation[J]. China Rural Water and Hydropower, 1996(12): 15-20. (in Chinese with English abstract)
[2] 董文楚. 微灌用过滤砂料选择与参数测定[J]. 喷灌技术,1995(2):42-46. Dong Wenchu. The material selection and parameter determination of sand filter in micro irrigation[J]. Sprinkler Irrigation Technology, 1995(2): 42-46. (in Chinese with English abstract)
[3] 翟国亮,陈刚,赵武,等. 微灌用石英砂滤料的过滤与反冲洗试验[J]. 农业工程学报,2007,23(12):46-50. Zhai Guoliang, Chen Gang, Zhao Wu, et al. Experimental study on filtrating and backwashing of quartz sand media in micro-irrigation filter[J]. Transactions of the Chinese Society of Agricultural Engineering (Transactions of the CSAE), 2007, 23(12): 46-50. (in Chinese with English abstract )
[4] 翟国亮,冯俊杰,邓忠,等. 微灌用砂石过滤器反冲洗参数试验[J]. 水资源与水工程学报,2007,18(1):24-28. Zhai Guoliang, Feng Junjie, Deng Zhong, et al. Parameters experiment of backwashing on sandy filter in micro-irrigation[J]. Journal of Water Resources & Water Engineering, 2007,18(1): 24-28. (in Chinese with English abstract)
[5] 冯俊杰,翟国亮,邓忠,等. 微灌过滤器用水压驱动反冲洗阀启闭机构的力学计算[J]. 农业机械学报,2007,38(12):212-214. Feng Junjie, Zhai Guoliang, Deng Zhong, et al. Mechanical calculation of opening and closing mechanism of back flushing valve driven by hydraulic pressure[J]. Transactions of the Chinese Society of Agricultural Machinery, 2007, 38(12): 212-214. (in Chinese with English abstract)
[6] 邓忠,翟国亮,仵峰,等. 微灌过滤器石英砂滤料过滤与反冲洗研究[J]. 水资源与水工程学报,2008,19(2):34-37. Deng Zhong, Zhai Guoliang, Wu Feng, et al. Study on the filtration and backwashing for the quartz filter in micro-irrigation[J]. Journal of Water Resources & Water Engineering, 2008, 19(2): 34-37. (in Chinese with English abstract)
[7] 赵红书. 微灌用石英砂滤料的过滤与反冲洗性能研究[D].北京:中国农业科学院,2010. Zhao Hongshu. Performance of Filtration and Flushing of Quartz sand Media for Micro-irragation[D]. Beijing: Chinese Academy of Agricultural Sciences, 2010. (in Chinese with English abstract)
[8] Ansys Inc. Ansys Fluent User’s Guide[M]. Pittsburgh: ANSYS Inc, 2011.
[9] 宗全利,郑铁刚,刘焕芳,等. 滴灌自清洗网式过滤器全流场数值模拟与分析[J]. 农业工程学报,2013,29(16):57-65. Zong Quanli, Zheng Tiegang, Liu Huanfang, et al. Numerical simulation and analysis on whole flow field for drip self-cleaning screen filter[J]. Transactions of the Chinese Society of Agricultural Engineering (Transactions of the CSAE), 2013, 29(16): 57-65. (in Chinese with English abstract)
[10] 宋辉智. 溢流管插入深度及圆柱段高度对旋流式过滤器沉沙效果的影响[D]. 内蒙古:内蒙古农业大学,2012. Song Huizhi. Overflow Pipe Insertion Depth and the Cylindrical Section Height of Cyclone Filter Settling Effect[D]. Inner Mongolia, Inner Mongolia Agricultural University, 2012. (in Chinese with English abstract)
[11] 王新坤,高世凯,夏立平,等. 微灌用网式过滤器数值模拟与结构优化[J]. 排灌机械工程学报,2013,31(8):719-723. Wang Xinkun, Gao Shikai, Xia Liping, et al. Numerical simulation and structure optimization of screen filter in micro-irrigation[J]. Journal of Drainage and Irrigation Machinery Engineering, 2013, 31(8): 719-723. (in Chinese with English abstract)
[12] 王栋蕾,宗全利,刘建军. 微灌用自清洗网式过滤器自清洗结构流场分析与优化研究[J]. 节水灌溉,2011(12):5-8. Wang Donglei, Zong Quanli, Liu Jianjun. Flow analysis and structure optimization of Self cleaning nets filter for micro-irrigation[J]. Water Saving Irrigation, 2011(12): 5-8. (in Chinese with English abstract)
[13] 罗力. 水力旋流器固-液两相流动数值计算及性能分析[D].广州:华南理工大学,2012. Luo Li. Numerical Calculation and Performance Analysis of Solid Liquid Two Phase Flow in Hydrocyclone[D]. Guangzhou: South China University of Technology, 2012. (in Chinese with English abstract)
[14] 刘文娟. 石英砂过滤器过滤及反冲洗特性的实验研究与数值模拟[D]. 北京:中国农业科学院,2014. Liu Wenjuan. Experimental Study and Numerical Simulation of Filtration and Backwashing Characteristics of Quartz Sand Filter[D]. Beijing: Chinese Academy of Agricultural Sciences, 2010. (in Chinese with English abstract).
[15] 李景海,刘清霞,黄修桥,等. 微灌石英砂滤层流态特性与分形阻力模型参数确定[J]. 农业工程学报,2015,31(13):113-119. Li Jinghai, Liu Qingxia, Huang Xiuqiao, et al. Flow state characteristics and fractal model parameters determination of quartz sand filter layer used in micro-irrigation[J]. Transactions of the Chinese Society of Agricultural Engineering (Transactions of the CSAE), 2015, 31(13): 113-119. (in Chinese with English abstract).
[16] Ansys Inc. Ansys Fluent Theory Guide[M]. Pittsburgh: ANSYS Inc, 2011: 457-458.
[17] 贺靖峰. 基于欧拉-欧拉模型的空气重介质流化床多相流体动力学的数值模拟[D]. 北京:中国矿业大学,2012:25-26. He Jingfeng. Numerical Simulation of Multiphase Fluid Dynamic in Air Dense Medium Fluidized Bed Based on Euler-Euler Model[D]. Beijing: China University of Mining and Technology, 2012, 25-26. (in Chinese with English abstract)
[18] Gidaspow D. Hydrodynamics of fluidization and heat transfer: Supercomputer modeling[J]. Applied Mechanics Reviews, 1986, 39(1): 1-22.
[19] Mansoori Z, Saffar-Avval M, Basirat-Tabrizi H, et al. Thermo-mechanical modeling of turbulent heat transfer in gas-solid flows including particle collisions[J]. International Journal for Heat Fluid Flow, 2002, 23(6): 792-806.
Numerical simulation and flow field analysis of backwashing of quartz sand filter in micro-irrigation
Li Jinghai1,2, Zhai Guoliang1, Huang Xiuqiao1※, Feng Junjie1, Liu Yang1
(1. Farmland Irrigation Research Institute, Chinese Academy of Agricultural Sciences/Key Laboratory of Water-saving Agriculture in Henan Province, Xinxiang 453002, China; 2.Water Resources Management Committee Office of Anyang City, Anyang 455000, China)
Backwashing of quartz sand filter in micro-irrigation is an effective way to realize the regeneration of quartz sand filter media. Analysis of flow field in the backwashing process of quartz sand filter and determination of reasonable backwashing velocity play an important role in the design and operation of the quartz sand filter. The method of numerical simulation has obvious advantage in the analysis and investigation of the flow field in the filter layer. In order to realize the numerical simulation of the backwashing process of quartz sand filter, the geometric model of quartz sand filter was established through Gambit software, and the mesh division of the geometric model was carried out. Because the backwashing process of quartz sand filter layer is a solid-liquid multiphase flow system interacted by both water and quartz sand, in which quartz sand particles are distributed only in a part of the region during the process of backwashing, not being carried away to outside of the filter by the stream, and in which quartz sand accounted for a larger proportion of the whole volume, the Eulerian model was adopted as a model for numerical simulation of backwashing. At the same time, because the backwashing process of quartz sand filter layer is a dynamically stable process, the transient simulation solver was adopted. The simulation objects were three kinds of quartz sand filter layer with the same thickness of 400 mm, but the equivalent particle size were 1.06, 1.2 and 1.5 mm respectively. In order to verify the reliability of simulation results, backwashing experiments were conducted in Farmland Irrigation Research Institute, Chinese Academy of Agricultural Sciences, in 2014. The parameters such as backwashing velocity, pressure drop and expansion height of filter layer were measured. The simulation results were compared with the experimental results. Comparison showed that the maximum simulation error of the whole pressure drop of filter layer was 7.03%, and the maximum simulation error of filter layer density was 1.93%. It was proved that the numerical simulation results were reliable. On this basis, the fluctuation trend of pressure drop with time and the variation trend of the mean value and the standard deviation of the pressure drop with backwashing velocity in backwashing process of quartz sand filter layer were analyzed. If the standard deviation of pressure drop is large, it shows that the fluctuation of pressure drop is unstable, and the unstable fluctuation of pressure drop will affect the effect of backwashing. This result can determine the reasonable range of the backwashing velocity. Then, the distribution rule of the filter layer density with time, the variation trend of the mean value and the standard deviation of the density with the change of the backwashing velocity were analyzed. When the density is close to the static density of the mixture composed of water and quartz sand, the effect of backwashing is poor. When the standard deviation of density is too large, partial concentration phenomenon will appear in the filter layer, which will cause negative influence on the effect of backwashing. Thus, the reasonable range of the backwashing velocity was determined. After combined the rules of pressure drop fluctuation and density distribution, the reasonable ranges of the backwashing velocity of three kinds of filter layer are obtained as 0.0149-0.0212, 0.0146-0.0218 and 0.0191-0.0261 m/s respectively. The research results provided a theoretical basis for the mechanism of quartz sand filter in the process of backwashing. It also provided a technical support for the operation of the sand filter.
irrigation; models; computer simulation; quartz sand filter layer; backwashing; multiphase flow
10.11975/j.issn.1002-6819.2016.09.011
S275.6
A
1002-6819(2016)-09-0074-09
李景海,翟国亮,黄修桥,冯俊杰,刘 杨. 微灌石英砂过滤器反冲洗数值模拟验证与流场分析[J]. 农业工程学报,2016,32(9):74-82.
10.11975/j.issn.1002-6819.2016.09.011 http://www.tcsae.org
Li Jinghai, Zhai Guoliang, Huang Xiuqiao, Feng Junjie, Liu Yang. Numerical simulation and flow field analysis of backwashing of quartz sand filter in micro irrigation[J]. Transactions of the Chinese Society of Agricultural Engineering (Transactions of the CSAE), 2016, 32(9): 74-82. (in Chinese with English abstract) doi:10.11975/j.issn.1002-6819.2016.09.011 http://www.tcsae.org
2016-02-19
2016-03-16
“十二五”农村领域国家科技支撑计划课题(2014BAD12B05);公益性行业(农业)专项(201203003)
李景海,男,河南安阳人,博士生,高级工程师,主要从事微灌过滤器及水资源配置研究。新乡 中国农业科学院农田灌溉研究所,453002,Email:649923670@qq.com
※通信作者:黄修桥,男,湖北汉川人,博士,研究员,博士生导师,主要从事节水灌溉理论与技术研究。新乡 中国农业科学院农田灌溉研究所,453002,Email:huangxq626@126.com