陇东地区几种旱作作物产量对降水与气温变化的响应
2016-12-19王自奎张小明沈禹颖
杨 轩,王自奎,曹 铨,张小明,沈禹颖
(兰州大学草地农业科技学院草地农业生态系统国家重点实验室,兰州 730020)
陇东地区几种旱作作物产量对降水与气温变化的响应
杨 轩,王自奎,曹 铨,张小明,沈禹颖※
(兰州大学草地农业科技学院草地农业生态系统国家重点实验室,兰州 730020)
研究作物产量对气候变化的响应,对于指导区域农业生产,保障粮食安全和生态安全具有一定的理论指导意义。结合大田试验与农业生产系统模拟模型(Agricultural Production Systems Simulator,APSIM),在验证模拟研究区冬小麦、玉米和紫花苜蓿产量可靠性的基础上,分析5个降水变化梯度(降水量不变、降低10%和20%、升高10%和20%)和5个气温变化梯度(不变、降低1.5和1℃、升高1.5和1℃)组合情景下3种作物的产量变化趋势。结果表明:APSIM模型在试验点对3种作物籽粒产量和生物量的模拟精度较高,决定系数R2在0.80~0.93之间,归一化均方根误差在11.35%~22.48%之间,模型有效系数在0.53~0.91之间。冬小麦、玉米和紫花苜蓿在气温升高、降水量减少的情景下减产,减产的最大幅度分别为38.7%、40.3%和41.8%;冬小麦、紫花苜蓿的在气温降低、降水量增加时增产,增产的最大幅度分别为29.8% 和51.7%;玉米在降水量增加、温度不变的情景下增产幅度最大,为22.0%。总之,在研究范围内,3种作物的产量随降水的增加而增高;玉米的产量随气温升高先增高后降低,另2种作物的产量随气温的升高而降低;紫花苜蓿适应气候变化的能力最强。结果对明确黄土高原地区主要作物的生产走势,制订农业布局、管理措施等具有一定意义。
气候变化;降水;温度;APSIM;产量;陇东地区
0 引言
气候变化引起的气温与降水格局的转变必将对中国主要农作物的生产产生重要影响[1-2]。对于以旱作为主的黄土高原西部来说,农业生产对气温和降水的依赖程度更大[3-5],探讨气温和降水变化条件下该区主要作物产量的变化趋势,对于指导该区域种植结构调整,保障区域粮食稳产具有一定的参考价值。
以往有关作物生产和气象条件之间关系的研究大都基于田间试验方法,这种方法虽然取得的数据精确、结论可靠,但是一般试验周期长、成本高,而且结果的通用性差。作物生长模拟模型通过综合气候条件、土壤状况及农田管理措施来预测作物产量,能分析产量和各因素之间的关系,可为农民和决策者提供技术指导和决策依据[6-7]。因此,本研究采用试验与模拟相结合的方法研究作物产量对降水和气温变化的响应。
农业生产系统模拟模型(Agricultural Production Systems Simulator,APSIM)是澳大利亚联邦科学与工业研究组织于1990s研发的用于模拟农业生产系统生物物理过程的机理模型[8-10],已在世界范围内被广泛应用于评价气候变化对农作物生产的影响及指导农田灌溉、施肥及耕作等管理实践[11-14]。在中国,一些研究完成了APSIM在华北、西南和西北地区的适应性评估和验证[15-17];并且在此基础上,有学者利用APSIM评估气候因素对作物生产的影响:Wang等[15]基于该模型分析了气候变化对冬小麦物候期的影响;Chen等[2]以APSIM模型为平台分析了气象因子变化对华北地区粮食生产的影响;董朝阳等[18]利用APSIM分析了北方地区干旱对玉米产量的影响。在黄土高原西部雨养农业区,模型完成了本土化[19-21],并在验证、应用方面取得了进展[21-22],但是在作物长期生产方面的研究较少。陇东地处黄土高原西部,是典型的雨养农业区,冬小麦和玉米为主要的粮食作物。该区水土流失严重,土壤肥力严重下降[23],当地政府于2008年启动了以发展草地畜牧业、苹果、瓜菜为主的“六个百万工程”,以期改善生态环境和农业格局。紫花苜蓿作为应用广泛的多年生牧草,是发展草地畜牧业,实现农业结构调整,增加农民收入重要的饲草作物。为探讨该区小麦、玉米及紫花苜蓿的产量对气温和降水变化的响应,本研究首先利用多年大田试验数据对APSIM模型进行验证,然后设定不同的降水和气温变化情景,模拟分析气候变化对冬小麦、玉米和紫花苜蓿生产的影响,拟为主要作物的产量对气温、降水变化的响应提供参考,为实现黄土高原农业系统可持续发展提供理论和实际依据。
1 材料与方法
1.1 试验点概况
试验于2001-2010年在位于甘肃省庆阳市西峰区的兰州大学庆阳黄土高原试验站(35°39′N,107°51′E,海拔1 297 m)开展。该区是典型的黄土高原西部雨养农业区,属于大陆性季风气候,多年平均降水量为546 mm,且多集中于7-9月,年均蒸发为1 504 mm,年均气温在8~10℃之间,极端最高气温39.6℃,极端最低气温−22.4℃。年日照时数在2 300~2 700 h之间,无霜期150~190 d。试验地土壤为粉壤土,粉粒在600~700 g/kg之间。有机质约1 g/kg,全氮低于0.1 g/kg,pH值在8.0~8.5之间,地下水埋深50 m以上。
根据西峰区1961-2010年50 a的历史气象数据可知,研究点各年降水与多年平均降水相差最大幅度接近40%(图1a),年均气温的变化范围在7.7~10.3℃之间(图1b)。图1中列出了以年降水量或年均气温为因变量,以年份为自变量的趋势线表达式。由2个表达式可知,年降水量的变化为−2.099 mm/a,气温的变化为0.030℃/a;对年降水量和年均气温进行的Mann-Kendall检验结果表明,二者的变化趋势并不显著(P>0.05)。

图1 庆阳市西峰区1961-2010年逐年降水量及年均气温变化趋势Fig.1 Annual precipitation and annual temperature change from 1961 to 2010 in Xifeng of Qingyang city
1.2 试验布置及测定
兰州大学庆阳黄土高原试验站从2001年以来一直开展冬小麦田及玉米田保护性耕作研究[19,23-24],本文采用2001-2010年传统耕作处理条件下的产量数据来验证APSIM模型。当地普遍采用两年三熟的轮作制度,本试验中作物轮作序列为春玉米(Zea mays L.)-冬小麦(Triticum aestivum L.)-夏大豆(Gyleine max L.)或者春玉米-冬小麦-箭筈豌豆(Vicia sativa L.)。玉米的品种为中单2号,冬小麦品种为西峰24号。试验小区4 m×14 m,设置4个重复。小麦和玉米产量在每个小区随机设定l m样条方测定,箭筈豌豆用0.50 m×0.50 m样方进行收割、脱粒,风干后测定其产量。
紫花苜蓿(medicago sativa cv Longdong)播种时间为2002年9月、2007年9月。2002年9月播种后于2003 年3月进入返青期,本研究中采用2003年和2004年(1龄及2龄)紫花苜蓿的干物质产量。2007年播种后由2008 年3月进入返青期,本研究中采用2009年(2龄)紫花苜蓿的干物质产量。紫花苜蓿的播种及田间管理参数列于表1中。苜蓿播种当年刈割2次,之后每年刈割3次,刈割时在苜蓿地随机设定4块1 m×1 m的样方,将刈割后的苜蓿在75℃下烘干,测定其生物量。

表1 冬小麦、春玉米及紫花苜蓿的田间管理参数Table 1 Field management parameters for winter wheat, spring maize and lucerne
模拟所用初始土壤水分,0~10 cm以质量法测定,其余土层(10~30、>30~60、>60~90、>90~120、>120~150、>150~200 cm)用中子水分仪测定;所用初始土壤氮以凯氏定氮法测定。
模拟所用气象参数,包括每日最高和最低气温(℃)、降雨(mm)及太阳辐射(MJ/m2)采用位于试验站的PC200W型自动气象站测定。
1.3 APSIM模型参数校准及验证方法
APSIM模型所需要输入的参数包括气象、土壤、作物生长参数、管理参数等[8]。
APSIM所采用的分层土壤水量平衡模块是在PERFECT模型基础上发展的。假定当某土层含水量小于田间持水量时,非饱和水分在相邻土层中的运动用Richard方程描述。当土壤含水量达到田间持水量后,饱和水分将移向下层。需要确定水分运动的主要参数有饱和含水量,田间持水量和凋萎含水量[19-20]。土壤养分运移模块是在CERES模型基础上发展的,可以逐日分层次地计算土壤C和N的变化,但与CERES不同的是将土壤有机质库分为3个库:活性C、土壤微生物及其产物库和土壤有机质库[21]。
田间最大持水(drainage upper limit,DUL)于2001 年4月采用池塘法测定,用中子仪测定土壤水分含量直至稳定记为DUL[20]。作物水分利用最低限(crop low limit,CLL)测定于2002年作物生长旺季。以遮雨棚隔绝雨水进入,并在无雨时去掉遮盖;收获期于遮雨棚中心部位以土钻取样,重复4次,测量体积含水量,记为CLL;该参数与土壤在−1.5 MPa下的凋萎系数不同,CLL会因作物或生长条件不同而异[20]。试验田各层主要土壤参数列于表2中。

表2 试验地主要土壤参数Table 2 Main soil parameters of experimental site
APSIM模型的作物参数包括有效积温、春化作用系数、光周期系数、最大植株高度及最大潜在收获指数等(表3)。研究使用的作物品种:西峰24号冬小麦、中单2号玉米、陇东紫花苜蓿的主要参数已由前期研究利用基于4年的连续田间试验完成测定和率定,经过校准的APSIM模型对于2001-2005年3种作物的籽粒产量和生物量的模拟精度较高,决定系数R2达到0.70~0.98[19-21]。另外,APSIM模型的苜蓿模块没有描述越冬期的参数,在温度较低的冬季,模型仍然设置为反应苜蓿生长,但生长速度极其缓慢[21]。
在前期工作的基础上,模型的有效性验证使用实测值和模拟值回归关系的决定系数R2、归一化均方根误差(normalized root mean squared error,NRMSE)及模型有效系数(model efficiency,ME)几个参数量化[25-27]。
1.4 气候情景设置
根据15次IPCC报告,至本世纪末叶(2081-2100年),在极端情况下,西北地区气温的变化可达1.5~2℃,降水变化可达10%~20%[28],参考已有气候情景设定,多以降水变化0~20%,气温0~2℃或以1℃为步长设置变化范围[13,22,29-32]。本研究将降水变化10%为步长设立5个降水梯度,气温变化0.5~1℃为步长设立5个气温梯度。各降水梯度分别为降水量降低20%(P1)、降低10%(P2)、不变(P3)、升高10%(P4)与升高20%(P5);各气温梯度分别为降低1.5℃(T1)、降低1℃(T2)、不变(T3)与升高1℃(T4)、升高1.5℃(T5),两因素两两组合共计25个情景,其中P3T3为对照CK情景,即历史气候条件。
利用APSIM模型,使用来源于西峰气象局的1961 -2010年气象数据对各个情景冬小麦、玉米、紫花苜蓿进行50 a的连续生产模拟。长期模拟使用的耕作管理措施与田间试验相同。为去除管理参数、土壤初始状态对作物生产的影响,突出作物产量对气候因素的响应,本研究在各情景模拟下所设定的同种作物的土壤初始水分、土壤初始氮和耕作管理参数均一致,具体管理设置参数见表1。

表3 三种作物品种的主要参数Table 3 Main crop parameters of 3 crops
1.5 数据分析
统计冬小麦、玉米籽粒产量和紫花苜蓿生物量为产量。采用Microsoft Excel软件对所得数据进行处理分析,Sigma Plot 10.0制作曲面图并求趋势面方程,采用Genstat统计软件比较模拟值、实测值之间的差异,各情景产量概率曲线斜率的差异。
2 结果与分析
2.1 模型验证
运用APSIM模型模拟2002-2010年冬小麦、2001- 2010年玉米籽粒产量和生物量与2003-2004及2009年各茬紫花苜蓿的生物量积累,并根据实测数据和模拟数据进行模型的有效性检验。冬小麦、玉米的籽粒产量模拟值与实测值之间线性回归关系的决定系数R2分别为0.93和0.83,3种作物生物量模拟值与实测值之间的R2分别为0.90、0.80和0.81(图2)。冬小麦和紫花苜蓿的回归线斜率<1,模型有高估低值的趋势,而玉米回归线的斜率>1.1(图2),模型低估了大部分数值较高的点。归一化均方根误差NRMSE主要反映模型对高值的模拟效果,冬小麦和玉米籽粒产量对应的NRMSE分别为11.35%、14.91%,冬小麦、玉米和紫花苜蓿生物量对应的NRMSE为21.08%、13.74%和22.48%,模型的有效系数ME达到0.53~0.91,均大于0.5,模拟效果较好[26-27]。综上所述,APSIM模型可以有效地模拟研究区西峰24冬小麦、中单2号玉米和陇东紫花苜蓿的籽粒产量和生物量。

图2 冬小麦玉米籽粒产量和3种作物生物量的实测值与模拟值Fig.2 Observed and simulated grain yield of winter wheat, maize and biomass of three crops
2.2 三种作物各情景的模拟产量波动范围比较
首先模拟P3T3(CK)情景下1961-2010年3种作物的产量。图3显示了不同作物模拟产量的概率累积曲线。冬小麦产量变化范围最小,其中有60%的年份产量达到4 363 kg/hm2;玉米的最高产量可达11 853 kg/hm2,60%的年份产量达到8 279 kg/hm2以上,但有8个年份产量低于3 000 kg/hm2;紫花苜蓿有4个年份的产量低于4 000 kg/hm2,近80%的年份达到6 000 kg/hm2以上。
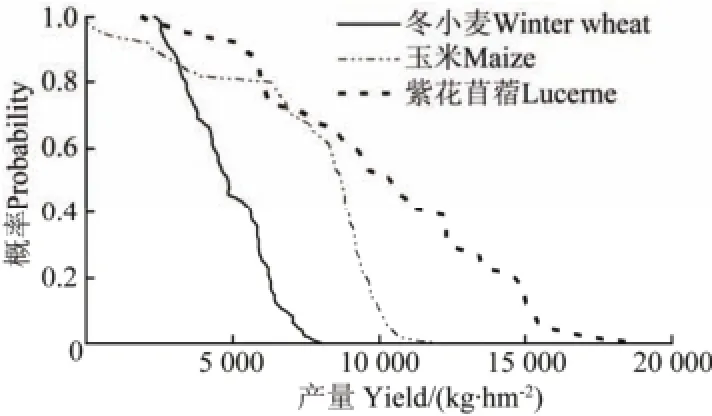
图3 西峰1961-2010年间冬小麦、玉米和紫花苜蓿模拟产量的概率累积曲线Fig.3 Accumulative probability curves of simulated yields of winter wheat, maize, and lucerne from 1961 to 2010 in Xifeng
图4展示了各作物在各情景下的产量范围和100%、75%、50%、25%、0概率下的产量。

图4 三种作物产量的不同概率堆积图Fig.4 Different probability stacked bar for yield of 3 crops
由图4可知,各作物各情景的产量最高点随降水梯度上升而上升;冬小麦、紫花苜蓿的产量最高点随气温梯度上升而下降,而玉米的产量最高点随气温梯度增加呈先上升后下降的趋势。冬小麦、紫花苜蓿于各情景下100%(情景产量最低点)、75%、50%、25%概率下的产量点趋势与最高点基本一致,但冬小麦在P3~P5梯度时,虽然最高点随气温梯度下降,最低点却有随气温梯度上升而提高的趋势。对玉米来说,各概率产量点趋势多变,其最低点仅在P4、P5梯度下有6个情景不为0(分别为2个与4个情景),其余概率下的产量点与最高点的趋势基本一致。
为进一步量化各作物在各情景下的产量高低,将不同降水梯度、气温梯度下3种作物的产量概率累积曲线的斜率列于表4与表5中。产量概率累积曲线的斜率都小于0,斜率越小,表示累积曲线越陡,产量的波动范围越小。表4中,对比不同降水梯度,冬小麦、玉米的概率曲线斜率均随降水梯度的增加而减小,这是因为作物的产量的波动范围随降水升高而逐渐减小,紫花苜蓿的产量波动范围则逐渐增加。冬小麦在降水梯度P5与其他各梯度之间斜率差异显著(P<0.05),但P2~P4之间斜率差异不显著;对玉米而言,除P5与其他各梯度之间斜率差异显著(P<0.05),P1~P4间不显著(P>0.05);紫花苜蓿则是除P1与其他梯度有显著差异外(P<0.05),各梯度间斜率的差异均不显著(P>0.05)。

表4 各作物在不同降水梯度下产量曲线的斜率均值Table 4 Mean absolute values and standard deviations of slope of probability curves in different precipitate gradients
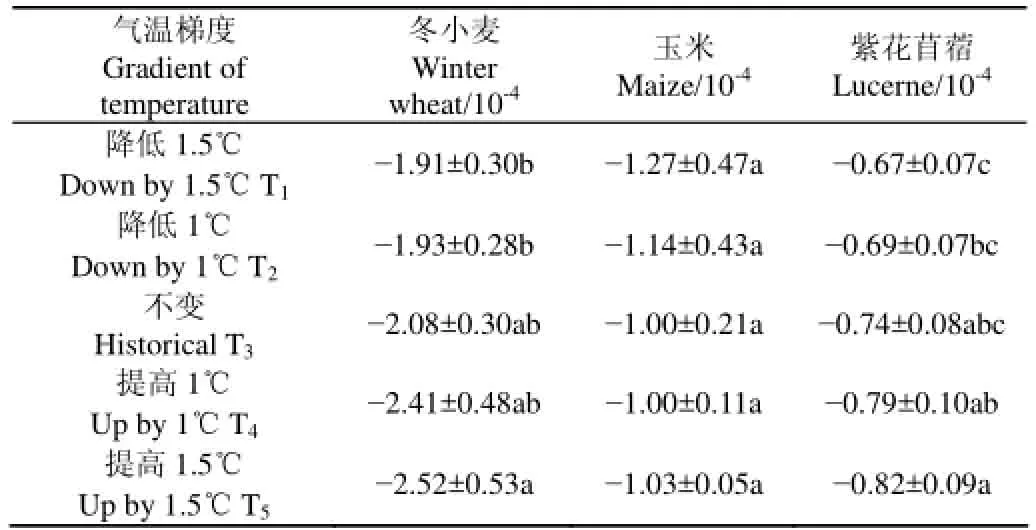
表5 各作物在不同气温梯度下产量曲线的斜率均值Table 5 Mean absolute values and standard deviations of slope of probability curves in different temperature gradients
表5中,冬小麦与紫花苜蓿产量累计概率曲线的斜率随气温的提升而减小,表明产量的范围缩小;玉米产量概率曲线的斜率则随气温的提升于T1~T3呈现增大趋势,表明产量范围扩大,但在T3~T5间变化很小。各梯度间,冬小麦只于T5与T1、T2间差异显著(P<0.05);玉米各梯度间均无显著差异(P>0.05);而紫花苜蓿除T5与T1、T2间,T4也与T1有显著差异(P<0.05)。另外,表4~5中紫花苜蓿斜率于各情景间的变化最小。各气温梯度斜率的差异不如降水梯度之间显著,说明气温对作物产量波动范围的影响较降水小。
综上,降水与气温的整体上升均会对冬小麦的产量波动范围产生减小趋势;玉米在降水上升时范围减少,当设定气温低于基准气温时,增温倾向扩大波动范围,而当设定气温高于基准气温时,增温对波动范围影响极小;对于紫花苜蓿来说,降水同时提高了其产量和波动范围,而增温会缩小范围,同时,由于紫花苜蓿在不同情景间,斜率变化最小,故其产量区间的变化幅度也最小,突出了其较好的气候适应性。
2.3 气温与降水变化情景下3种作物的模拟产量变化
图5显示了其他设定情景与P3T3相比作物产量的变化率,从图中可明显看出在研究区降水对产量的影响要远远大于气温,所以不论气温升高或者降低,降水增多都使作物的产量增大。降水减少和气温升高对3种作物产量形成的负效应最为显著。个别在P3T3下绝收或产量极低的年份,由于气候情景变化产生的产量上升幅度超过100%。剔除这些极端值后,冬小麦、玉米及紫花苜蓿产量的最大增幅分别为29.8%、22.0%及51.7%,最大减幅分别为38.7%、40.3% 和41.8%。图5中产量变化率与气温及降水梯度之间接近曲面关系,故用二元二次方程拟合了它们之间的关系
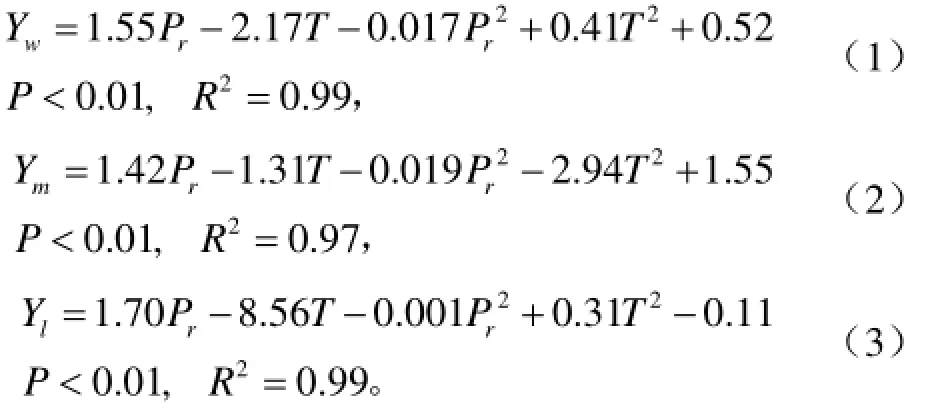
式中Yw、Ym及Yl分别为冬小麦、玉米及紫花苜蓿相对于P3T3的产量变化率,%;Pr为降水梯度(−20%~20%),T为温度梯度(−1.5~1.5℃)。拟合结果的决定系数高达0.97~0.99,说明二元二次方程可较好地描述产量变化率与气温及降水梯度之间的关系。由式(1)~式(3)可知,由于方程中Pr的系数分为1.42~1.70,而Pr2的系数极小,为−0.019~−0.001,因此降水增加主要对各作物的产量产生正效应。式(1)、式(3)中T的系数为−2.17、−8.56,绝对值远大于T2的系数,同时T2的系数又<1,因此气温主要对冬小麦、紫花苜蓿的产量产生负效应;对玉米来说,由于T、T2的系数分别为−1.31和−2.94,因此除T3两项之和为0,气温梯度无论在本研究设定范围内如何变化,两项之和均为负数,说明式(2)中描述的玉米产量在T3梯度时倾向最高。
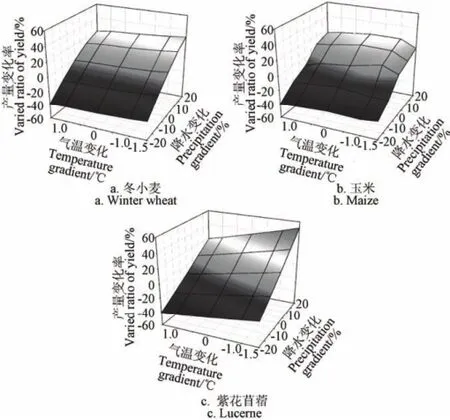
图5 各情景与P3T3(CK情景)相比的产量变动Fig.5 Yield variations of different scenarios in comparison with P3T3 (CK scenario)
为了研究产量变化率与单一因素降水或气温之间的关系,假定一个因素不变,拟合产量变化率与另一因素之间的线性关系。当气温一定时,冬小麦、玉米和紫花苜蓿产量变化率随降水的增加而增大,斜率分别为14.3~16.0、11.8~15.5和15.0~18.9,说明3种作物的产量大体随降水梯度的上升而增加。当降水一定时,斜率随温度梯度升高,分别为由−1.3和−4.8下降至−2.5和−8.9,说明冬小麦和紫花苜蓿的产量大体随气温梯度的上升而减少。对玉米而言,降水量为P1时产量随气温的升高而下降,此时产量与气温近似正相关;降水量为P2、P4及P5时产量在T3处达到最大,降水量为P3时产量于T2处达到最大,此时玉米产量对气温梯度并非单纯的直线变化趋势,而倾向于正抛物线趋势。总体来说,降水作为自变量时方程的斜率更高,也说明在研究设定范围内,降水是影响作物产量的主要因素。
3 讨论
为分析降水和气温变化对陇东地区冬小麦、玉米和紫花苜蓿产量的协同作用,利用研究区域气候资料和土壤属性资料,并根据研究区域2001-2010年的定位试验数据,在APSIM 模型已有的冬小麦、玉米及苜蓿模块基础上对模型的有效性进行检验。通常情况下,产量和生物量模拟值与实测值的NRMSE低于30%,ME高于0.5,则表明模拟结果较好,模型在研究地区具有适应性[26-27]。本研究中模型用APSIM模型模拟的3种作物的产量与实测值的NRMSE在11.35%~22.48%之间,ME高于0.5,说明该模型在陇东地区的适用性较好。王琳等[33]基于APSIM模型模拟在华北平原冬小麦和夏玉米连作系统的生物量和产量,模拟结果的NRMSE值为24.6%;戴彤等[16]于重庆小麦产区分析了APSIM模型在该地区的适应性,结果表明模拟产量与实测值间NRMSE值低于30%。以上研究均得到了较好的模型拟合度。
在黄土高原,降水是引起作物产量变动的主要因素。半干旱地区,一般降水难以满足作物生育期的最佳的需水量,所以研究结果显示3种作物的产量随着降水量的增加而增加。Masikati等[34]基于APSIM研究作物的生产潜力和水分生产率时表明,生长季降水与小麦产量显著相关,降水减少使得小麦和玉米的产量显著降低,气温升高对产量产生的效应较降水带来的效应弱,这与本研究结果所展示的趋势相近。所以未来气候干旱化势必会对陇东地区农业生产造成严重的影响。紫花苜蓿属于深根系的多年生牧草,于夏季到秋季对水分的利用率明显高于小麦和玉米[21],试验点的降水量也多集中在这个时期,降水增加所提升的产量较另外2种作物更高。Bowman 等[35]的研究表明,由于紫花苜蓿的抗旱能力较强,低于300 mm的年降水量才会导致旱地生产潜力的降低,一定范围内气温的降低可提高其固氮能力,从而提高产量,这也与本文的结果一致;并且,紫花苜蓿的水分条件受土壤水库的调节作用影响很大,除前期降水外,中深层有效贮水也对其水分需求有重要的调节作用[36]。本研究的结果中,紫花苜蓿的产量变异范围不仅于各温度梯度间无显著差异(P>0.05),也于相邻降水梯度间无显著差异(P>0.05),表明紫花苜蓿对环境具有更强的适应性。
在陇东地区,冬小麦与紫花苜蓿的产量会随气温的整体上升而降低,但对玉米而言,当气温低于基准气温时,增温对于产量具有正效应,而当设定气温高于基准气温时,增温对于产量具有负效应。李广等[22]研究春小麦产量对气温变化的响应时也发现,温度升高对春小麦产量的贡献率为负效应, 产量与温度呈二次抛物线下降型变化;这也与其他学者认为温度升高将对作物产量起到负效应研究结果一致[37−38]。玉米产量在气温不变的情况下要比气温较低时高,这是由于C4作物发育的最低积温限制高于C3作物。Basso等[39]的研究认为,温度与玉米产量呈单向负相关,最高气温高于30℃的天数越多,对玉米产量所造成的负面影响也越高;与该研究对比,陇东地区7-8月的逐日最高温度很少达到30℃,所以本文的结果与他们的结论有所差异。本研究中降低气温造成某些年份玉米减产的另一个原因是其较易受5-9月冷害的影响[40]。
在研究区降水对产量的影响要远大于气温,所以不论气温升高或者降低,降水增多都使作物的产量增大。降水减少和气温升高对3种作物产量形成的负效应最为显著。玉米大幅度减产的现象多是由于生育前期低温、少雨或者低温少雨共同发生造成生长发育滞后,导致花期结束太晚而未能完成灌浆过程。紫花苜蓿与同为作为C3植物的冬小麦相比具有固氮能力,显示出更低的产量变异性和更好的适应性。总体来说,当气候条件剧变,特别是气温升高的同时降水趋向降低时,有必要根据具体情况改变主要作物的播种面积和播种时间,规避高温胁迫、充分利用降水以减少生产风险,同时加强其他田间管理措施。本研究未考虑太阳辐射和CO2浓度的变化对3种作物的影响,太阳辐射、CO2浓度、降水和气温的变化对黄土高原西部农业生产产生的综合效应仍需进一步的分析讨论。
4 结论
农业生产系统模拟模型对3种作物的产量的归一化均方根误差在11.35%~22.48%之间,模型有效系数均高于0.5,因此适用性较好。在黄土高原西部,研究设定的气温与降水变化范围内,冬小麦、玉米、紫花苜蓿的产量受降水影响较气温更大,且均为正效应。冬小麦与紫花苜蓿随气温降低而提高产量,气温对产量产生负效应;玉米在降水提高且气温不变时,产量最高。多年生、深根系作物紫花苜蓿的产量范围受气温和降水的影响较1 a生作物冬小麦和玉米更小,适应气候变化的能力更强。在黄土高原西部,选择合适的耕作措施、实施草田轮作、加强作物管理等可于一定程度规避气候变化引起的高温和水分胁迫导致的生产风险。
[1] 秦大河. 气候变化与干旱[J]. 科技导报,2009,27(11):3. Qin Dahe. Climate change and drought[J]. Science and Technology Review, 2009, 27(11): 3. (in Chinese with English abstract)
[2] Chen C, Wang E L, Yu Q, et al. Quantifying the effects of climate trends in the past 43 years (1961-2003) on crop growth and water demand in the North China Plain[J]. Climatic Change, 2010, 100(3/4): 559-578.
[3] 任继周,胥刚. 传统农耕文化在黄土高原上的困境与机遇[J].草业科学,2010,27(3):3-8. Ren Jizhou, Xu Gang. The difficulties and opportunities for traditional agrarian culture on the Loess Plateau[J]. Pratacultural Science, 2010, 27(3): 3-8. (in Chinese with English abstract)
[4] 雷廷武,邵明安,杨培岭. 我国干旱半干旱地区农业持续发展战略探讨[J]. 农业工程学报,1999,15(4):1-5. Lei Tingwu, Shao Mingan, Yang Peiling. On the strategies of sustainable agricultural development in the arid and semi-arid areas of China[J]. Transactions of the Chinese Society of Agricultural Engineering (Transactions of the CSAE), 1999, 15(4): 1-5. (in Chinese with English abstract)
[5] 刘晓清,赵景波,于学峰. 黄土高原气候暖干化趋势及适应对策[J]. 干旱区研究,2006,23(4):627-631. Liu Xiaoqing, Zhao Jingbo, Yu Xuefeng. Study on the climatic warming-drying trend in the Loess Plateau and the counter measure[J]. Arid Zone Research, 2006, 23(4): 627-631. (in Chinese with English abstract)
[6] 罗毅,郭伟. 作物模型研究与应用中存在的问题[J]. 农业工程学报,2008,24(5):307-312. Luo Yi, Guo Wei. Development and problems of crop models[J]. Transactions of the Chinese Society of Agricultural Engineering (Transactions of the CSAE), 2008, 24(5): 307-312. (in Chinese with English abstract)
[7] 姚宁,周元刚,宋利兵,等. 不同水分胁迫条件下DSSAT-CERES-Wheat模型的调参与验证[J]. 农业工程学报,2015,31(12):138-150. Yao Ning, Zhou Yuangang, Song Libing, et al. Parameter estimation and verification of DSSAT-CERES-Wheat model for simulation of growth and development of winter wheat under water stresses at different growth stages[J]. Transactions of the Chinese Society of Agricultural Engineering (Transactions of the CSAE), 2015, 31(12): 138-150. (in Chinese with English abstract)
[8] Keating B A, Carberry P S, Hammer G L, et al. An overview of APSIM, a model designed for farming systems simulation[J]. European Journal of Agronomy, 2003, 18(3): 267-288.
[9] Amarasingha R P R K, Suriyagoda L D B, Marambe B, et al. Simulation of crop and water productivity for rice (Oryza sativa L.) using APSIM under diverse agro-climatic conditions and water management techniques in Sri Lanka[J]. Agricultural Water Management, 2015, 160: 132-143.
[10] Holzworth D P, Huth N I, DeVoil P G, et al. APSIM: Evolution towards a new generation of agricultural systems simulation[J]. Environmental Modelling & Software, 2014, 62: 327-350.
[11] Delve R J, Probert M E, Cobo J G, et al. Simulating phosphorus responses in annual crops using APSIM: model evaluation on contrasting soil types[J]. Nutrient Cycling in Agroecosystems, 2009, 84(3): 293-306.
[12] Semenov M A, Stratonovitch P, Alghabari F, et al. Adapting wheat in Europe for climate change[J]. Journal of Cereal Science, 2014, 59: 245-256.
[13] Msongaleli B, Rwehumbiza F, Tumbo S D, et al. Sorghum yield response to changing climatic conditions in semi-arid central Tanzania: evaluating crop simulation model applicability[J]. Agricultural Sciences, 2014, 5: 822-833.
[14] Balwinder-Singha, Gaydon D S, Humphreysc E, et al. The effects of mulch and irrigation management on wheat in Punjab, India Evaluation of the APSIM model[J]. Field Crops Research, 2011, 124: 1-13.
[15] Wang J, Wang E L, Feng L, et al. Phenological trends of winter wheat in response to varietal and temperature changes in the North China Plain[J]. Field Crops Research, 2013, 144: 135-144.
[16] 戴彤,王靖,赫迪,等. APSIM模型在西南地区的适应性评价-以重庆冬小麦为例[J]. 应用生态学报,2015(4):1237-1243. Dai Tong, Wang Jing, He Di, et al. Adaptability of APSIM model in Southwestern China: A case study of winter wheat in Chongqing City, Chinese Journal of Applied Ecology, 2015(4): 1237-1243. (in Chinese with English abstract)
[17] 奥海玮,谢应忠,宋乃平,等. APSIM苜蓿模型在宁夏半干旱地区的适用性[J]. 草地学报,2014,22(3):535-541. Ao Haiwei, Xie Yingzhong, Song Naiping, et al. Adaptability of ASPIM lucerne model in semiarid area of Ningxia[J]. Acta Agrectir Sinica, 2014, 22(3): 535-541. (in Chinese with English abstract)
[18] 董朝阳,刘志娟,杨晓光. 北方地区不同等级干旱对春玉米产量影响[J]. 农业工程学报,2015,31(11):157-164. Dong Chaoyang, Liu Zhijuan, Yang Xiaoguang. Effects of different grade drought on grain yield of spring maize in Northern China[J]. Transactions of the Chinese Society of Agricultural Engineering (Transactions of the CSAE), 2015, 31(11): 157-164. (in Chinese with English abstract)
[19] 周少平. 基于APSIM模型的黄土高原玉米-小麦-大豆轮作系统产量、土壤水分动态[D]. 兰州:兰州大学,2008. Zhou Shaoping. Simulated Crop Yield and Soil Water within a Maize-winter Wheat–soybean Rotation in the Loess Plateau by APSIM[D]. Lanzhou: Lanzhou University, 2008. (in Chinese with English abstract)
[20] 沈禹颖. 黄土高原苜蓿-小麦轮作系统土壤与作物的组分动态[D]. 广州:中山大学,2004. Shen Yuying. Component Dynamics of the Soil and Crop within Lucerne-wheat Rotation Systems[D]. Guangzhou: Zhongshan University, 2004. (in Chinese with English abstract)
[21] Chen W, Shen Y Y, Robertson M J, et al. Simulation analysis of lucerne-wheat crop rotation on the Loess Plateau of Northern China[J]. Field Crops Research, 2008, 108: 179-187.
[22] 李广,李玥,黄高宝,等. 基于APSIM模型旱地春小麦产量对温度和CO2浓度升高的响应[J]. 中国生态农业学报,2012,20(8):1088-1095. Li Guang, Li Yue, Huang Gaobao, et al. Response of dryland spring wheat yield to elevated CO2concentration and temperature by APSIM model, Chinese Journal of Eco-Agriculture, 2012(8): 1088-1095.(in Chinese with English abstract)
[23] 罗彩云,沈禹颖,南志标,等. 水土保持耕作下陇东玉米-小麦-大豆轮作系统产量、土壤易氧化有机碳动态[J].水土保持学报,2005,19(4):84-88. Luo Caiyun, Shen Yuying, Nan Zhibiao, et al. Dynamics of crop yield and soil oxdizible organic carbon fraction within a maize-winter whea-soy rotation under different tillage treatment in Longdong Loess Plateau[J]. Journal of Soil and Water Conservation, 2005, 19(4): 84-88. (in Chinese with English abstract)
[24] 杨晶,沈禹颖,南志标,等. 保护性耕作对黄土高原玉米-小麦-大豆轮作系统产量及表层土壤碳管理指数的影响[J]. 草业学报,2010,19(1):75-82. Yang Jing, Shen Yuying, Nan Zhibiao, et al. Effects of conservation tillage on crop yield and carbon pool management index on top soil within a maize-wheat-soy rotation system in the Loess Plateau[J]. Acta Agrectir Sinica, 2010, 19(1): 75-82. (in Chinese with English abstract)
[25] Spara R L. Using R2with caution[J]. Current Medicine Research and Practice, 2014, 4(3): 130-134.
[26] Zhang X C. Calibration, refinement,and application of the WEPP model for simulation climatic impact on wheat production[J]. ASAE, 2004, 47(4): 1075-1085.
[27] Michele R, Nicola L, Zina F. Evaluation and application of the OILCROP-SUN model for sunflower in southern Italy[J]. Agricultural Systems, 2003, 78: 17-30.
[28] IPCC. Climate change 2013: The Physical Science Basis[M]// Stocker T F, Qin D, Plattner G K, et al. Contribution of Working Group I to the Fifth Assessment Report of the Intergovernmental Panel on Climate Change. Cambridge, United Kingdom and New York, NY, USA: Cambridge University Press, 2013.
[29] Chen C, Baethgen W E, Robertson A. Contributions of individual variation in temperature, solar radiation and precipitation to crop yield in the North China Plain, 1961-2003[J]. Climatic Change, 2013, 116(3): 767-788.
[30] Anwar M R, Liu D L, Farquharson R, et al. Climate change impacts on phenology and yields of five broadacre crops at four climatologically distinct locations in Australia[J]. Agricultural Systems, 2015, 132: 133-144.
[31] 刘晓清,赵景波,于学峰. 黄土高原气候暖干化趋势及适应对策[J]. 干旱区研究,2006,23(4):627-631. Liu Xiaoqing, Zhao Jingbo, Yu Xuefeng. Study on the climatic warming-drying trend in the Loess Plateau and the countermeasure[J]. Arid Zone Research, 2006, 23(4): 627-631. (in Chinese with English abstract)
[32] 郭海英,赵建萍,索安宁,等. 陇东黄土高原农业物候对全球气候变化的响应[J]. 自然资源学报,2006,21(4):608-614. Guo Haiying, Zhao Jianping, Suo Anning, et al. Response of agricultural phenospectrum to global climate change in Loess Plateau of east Gansu province[J]. Journal of Natural Resources, 2006, 21(4): 608-614. (in Chinese with English abstract)
[33] 王琳,郑有飞,于强,等. APSIM模型对华北平原小麦-玉米连作系统的适用性[J]. 应用生态学报,2007,18(11):2480-2486. Wang Lin, Zheng Youfei, Yu Qiang, et al. Applicability of Agricultural Production Systems Simulator (APSIM) in simulating the production and water use of wheat maize continuous cropping system in North China Plain[J]. Chinese Journal of Applied Ecology, 2007, 18(11): 2480-2486. (in Chinese with English abstract)
[34] Masikati P, Manschadi A, Rooyen A. Maize-mucuna rotation: An alternative technology to improve water productivity in smallholder farming systems[J]. Agricultural Systems, 2014, 123: 62-70.
[35] Bowman A M, Smith W, Brockwell J. Forecasting lucerne productivity under dryland farming conditions in central-western and western New South Wales[J]. Soil Biology and Biochemistry, 2004, 36(8): 1253-1260.
[36] 王位泰,张天锋,黄斌,等. 陇东黄土高原春播紫花苜蓿生长规律及气候生产潜力评估[J]. 干旱地区农业研究,2007,25(5):214-219. Wang Weitai, Zhang Tianfeng, Huang Bing, et al. Growth disciplinarian of alfalfa sowed in spring and evaluation of climate productivity in the loess plateau of East Gansu[J]. Agricultural Research in the Arid Areas, 2007, 25(5): 214-219. (in Chinese with English abstract)
[37] 王修兰,徐师华,崔读昌. CO2浓度倍增及气候变暖对农业生产影响的诊断与评估[J]. 中国生态农业学报,2003,11(4):47-48. Wang Xiulan, Xu Shihua, Cui Duchang. The diagnosis and estimation of CO2concentration increasing and climate warming on the agricultural production[J]. Chinese Journal of Eco-Agriculture, 2003, 11(4): 47-48. (in Chinese with English abstract)
[38] Watson R T, Zinyowera M C, Moss R H. The Regional Impacts of Climate Change: An Assessment of Vulnerability[M]. Cambridge, United Kingdom: Cambridge University Press, 1997: 1-18.
[39] Basso B, Ritchie J. Temperature and drought effects on maize yield[J]. Nature Climate Change, 2014, 4(4): 233.
[40] 张丽. C3、C4不同作物光合生理特性比较的研究[D]. 北京:中国农业大学,2004. Zhang Li. Comparison of Photosynthetic Characteristics for C3 and C4 Plants[D]. Beijing: China agricultural university, 2004. (in Chinese with English abstract)
Effects of precipitation and air temperature changes on yield of several crops in Eastern Gansu of China
Yang Xuan, Wang Zikui, Cao Quan, Zhang Xiaoming, Shen Yuying※
(College of Pastoral Agriculture Science and Technology, Key Laboratory of Grassland Agro-ecosystem, Lanzhou University, Lanzhou 730020, China)
Investigating the response of crop production to climate change can help to optimize local agricultural practices, and then ensure food and ecological security. Crop models can provide a useful way to examine the effects of a range of climatic condition, management or crop cultivar on crop growth and yield in field and pasture. This work investigated the effects of precipitation and air temperature changes on the production of winter wheat, maize and lucerne in rain-fed agriculture area located in the central and western Loess Plateau by field experiment and crop simulation model. The field experiment was conducted at Qingyang Loess Plateau Experimental Station of Lanzhou University through 2001 to 2010, and the Agricultural Production Systems Simulator (APSIM) was applied in this study to simulate the growing process of winter wheat, maize and lucerne. The APSIM was validated with the experimental data firstly, and then the APSIM was applied to simulate the yield variability of the crops under the combinations 5 precipitation levels and 5 air temperature levels based on historical climatic data from 1961 to 2010. Temperature levels were: 1) -1.5°C decrease in daily mean temperature (T1); 2) -1°C decrease in daily mean temperature (T2); 3) historical daily temperature (T2); 4) 1°C increase in daily mean temperature (T4); and 5) 1.5°C increase in daily mean temperature (T5). Precipitation levels were: 1) 20% decrease in daily precipitation (P1); 2) 10% decrease in daily precipitation (P2); 3) historical daily precipitation (P3); 4) 10% increase in daily precipitation (P4); and 5) 20% increase in daily precipitation (P5). Results showed that the APSIM can predict the grain yield and biomass of the 3 crops accurately with the determination coefficients varied between 0.80-0.93, the normalized root mean square errors varied between 11.35%-22.48%, and the model efficiency varied between 0.53-0.91; Overall, APSIM was powerful to simulate the crop grain yield and biomass of winter wheat, maize and lucerne in study site. Winter wheat and lucerne maintained the greatest yield increase when the air temperature decreased and the precipitation increased during 1961-2010, which was 29.8% and 51.7%. Maize reached its greatest yield, which improved 22% when the precipitation increased and the air temperature remained unchanged. The maximal reduction of yield of 3 crops were 38.7%, 40.3% and 41.8%, respectively, which presented in the scenarios with low precipitation level and high temperature level. In addition, the variation range of winter wheat yield was reduced by increasing air temperature and precipitation while lucerne yield exhibited a smaller variation range when precipitation decreased and temperature increased. According to the trend of winter wheat and lucerne, the variation range of maize yield tended to boost by increasing precipitation, otherwise, maize yield also showed a wider range under the temperature level varied from T1to T3; but when temperature level hoisted up the T5, variation range of maize yield tended to be narrower. Overer, lucerne could adapt to the climate change better than winter wheat and maize with relatively inferior changes of yield variation under different climatic scenarios. In conclusion, the 3 crops were more sensitive to precipitation and they had positive linear relationships with precipitation level by slopes of 14.3-16.0, 11.8-15.5 and 15.0-18.9, respectively. The results should offer better comprehension and consultation for future studies and actual production about long-term of chief crop production when climate changes. Future agricultural production should attach importance to change crop management such as sowing date and cultivar to avoid heat or moisture stress. Otherwise, more efforts should be paid to explore the effect of interaction by CO2, solar radiation, precipitation and air temperature on crop production on the western of Loess Plateau.
climate change; precipitation; temperature; APSIM; yield; Eastern Gansu
10.11975/j.issn.1002-6819.2016.09.015
P467;S501
A
1002-6819(2016)-09-0106-09
杨 轩,王自奎,曹 铨,张小明,沈禹颖. 陇东地区几种旱作作物产量对降水与气温变化的响应[J]. 农业工程学报,2016,32(9):106-114.
10.11975/j.issn.1002-6819.2016.09.015 http://www.tcsae.org
Yang Xuan, Wang Zikui, Cao Quan, Zhang Xiaoming, Shen Yuying. Effects of precipitation and air temperature changes on yield of several crops in Eastern Gansu of China[J]. Transactions of the Chinese Society of Agricultural Engineering (Transactions of the CSAE), 2016, 32(9): 106-114. (in Chinese with English abstract) doi:10.11975/j.issn.1002-6819.2016.09.015 http://www.tcsae.org
2015-09-28
2016-02-10
甘肃省重大科技专项(1203FKDA035);教育部长江学者和创新团队发展计划(IRT13019);甘肃省科技支撑项目(150NKCA081)
杨 轩,男,宁夏银川人,博士生,主要从事作物生长模型应用方面的研究。兰州 兰州大学草地农业科技学院,730020。Email:yangxuan2014@lzu.edu.cn
※通信作者:沈禹颖,女,上海人,教授,博士生导师,主要从事草地农业生态方面的研究。兰州 兰州大学草地农业科技学院,730020。Email:yy.shen@lzu.edu.cn
