A convenient look-up-table based method for the compensation of non-linear error in digital fringe projection
2016-12-09ChenXiongJunYoJuingChenHongMio
Chen Xiong,Jun Yo,Juing Chen,Hong Mio,∗
aKey Laboratory of Mechanical Behavior and Design of Materials(CAS),Department of Modern Mechanics,University of Science and Technology of China, Hefei,230027,China
bDepartment of Engineering Mechanics,Shanghai Jiao Tong University,Shanghai,200240,China
Letter
A convenient look-up-table based method for the compensation of non-linear error in digital fringe projection
Chen Xionga,Jun Yaob,Jubing Chenb,Hong Miaoa,∗
aKey Laboratory of Mechanical Behavior and Design of Materials(CAS),Department of Modern Mechanics,University of Science and Technology of China, Hefei,230027,China
bDepartment of Engineering Mechanics,Shanghai Jiao Tong University,Shanghai,200240,China
H I G H L I G H T S
•The theoretical analysis of the nonlinear errors in digital fringe projection is deduced.
•The LUT is made from measured phase map without extra calibration experiment.
•The process of algorithm is convenient to be applied in real-time digital fringe projection.
A R T I C L EI N F O
Article history:
Accepted 25 December 2015
Available online 28 January 2016
Phase measurement
Digital fringe projection
Non-linear error compensation
Digital image processing
Although the structured light system that uses digital fringe projection has been widely implemented in three-dimensional surface profile measurement,the measurement system is susceptible to non-linear error.In this work,we propose a convenient look-up-table-based(LUT-based)method to compensate for the non-linear error in captured fringe patterns.Without extra calibration,this LUT-based method completely utilizes the captured fringe pattern by recording the full-field differences.Then,a phase compensation map is established to revise the measured phase.Experimental results demonstrate that this method works effectively.
©2016 The Authors.Published by Elsevier Ltd on behalf of The Chinese Society of Theoretical and Applied Mechanics.This is an open access article under the CC BY-NC-ND license(http:// creativecommons.org/licenses/by-nc-nd/4.0/).
Advanced composite materials are becoming more and more widely used in the aerospace field in equipment such as radar antenna arrays and airfoils.Since these structures work in different types of specialized conditions,an increasing demand exists for their deformation details with respect to their location in large areas,on asmallscale,and withtheneedforhighprecision.Inrecent decades,these requirements have prompted the rapid developmentofopticalnon-contactthree-dimensional(3D)surfaceprofile methods[1–8].Of these methods,digital fringe projection(DFP), whichusesphaseextractionandimageprocessing,hasbeenextensivelyinvestigatedandisconsideredtobeoneofthemosteffective techniquesfor3Dshapemeasurement.Figure1showsaschematic diagram of a typical DFP-based measurement system[9–11].
A digital projector is used to project a simulated fringe pattern on the measured surface;then,the reflected light,whose intensity is modulated by the shape of the measured surface,is captured by adigitalcharge-coupleddevice(CCD)camera.Inourmeasurement system,we employ a phase-shifting technique to calculate the phase as
where Iiis the light intensity of the captured image,i denotes the image sequence number,and aiis the phase shift.Here,the nonlinear error plays a key role in affecting the DFP.Digital devices, such as complementary metal–oxide semiconductor(CMOS) cameras,CCD cameras,and digital projectors,are manufactured to be non-linear to achieve a better visual effect;thus,the phase error is often introduced during the deformation from the ideal sinusoidal to non-sinusoidal fringe patterns.In optical measurement,digitaldevicesarebecomingindispensable.Assuch, the non-linear error is inevitable in most measurement results.
Various efforts have been made to diminish this non-linear error.Pan et al.reported that the phase error originated from the non-sinusoidal waveforms and suggested that a Fourier series could be used to decompose the captured images in different-order harmonics,and then,an iterative phase compensation algorithm be applied to compensate for the non-linear error[5].Hoang et al.first used a universal phase-shifting techniqueto detect the gamma value and then pre-encoded the measurement setup.Using the new light intensity,an accurate measurement result could be achieved[7].Other researchers have also conducted work related to the calibration of gamma nonlinearity[12–14].Surrel believed the error could be alleviated by a number of phase-shifting fringe patterns[15].To diminish the phase error in DFP,Huang et al.proposed a new phase-shifting algorithm(double three-step algorithm)[16],and both the theoretical and experimental results showed that the algorithm could work effectively.A method based on amplitude modulation was proposed by Gai and Da[17],which can identify the fringe order by the fringe pattern’s amplitude,and reasonable results were obtained.Zhang and Huang proposed a method basedonthree-stepphaseshiftingtocompensateforthemeasured phase,and its key step was to establish an error compensation table called a look-up-table(LUT)[6].This method has proven to be generic for the arbitrary step phase-shifting technique,and an easier-operating LUT-based method in DFP measurement could be proposed,wherein a uniform flat surface board is used to calibrate thenon-linearerrorratherthanconductingapre-calibrationofthe monotonic gamma values of the projector[18].Some other related works may also be found in Refs.[19–23].For example,Schwider et al.mathematically discussed the historical development of different algorithms for error-compensating phase-shifting[22]. Zhou et al.claimed that errors arose from both non-linear gamma values and the ratio of the intensity modulation;thus,ambient light was considered in their compensation method[23].
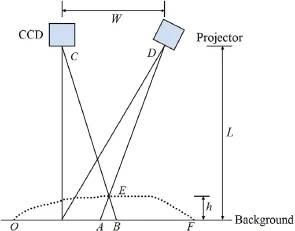
Fig.1.Schematic diagram of DFP measurement system.
In this study,we developed a convenient way to realize the LUT-based phase compensation algorithm,which fully utilizes the data information in the measured phase map.The non-linear error is directly extracted from the phase map rather than calibrating a uniform flat surface board using a set of fringe images.Thus, we can easily realize this method through programming.The experimental results showed that errors were reduced by a factor of ten.This convenient method has good potential for real-time DFP measurement applications.We first describe our study of the characteristics in DFP images and then detail the procedure of constructing a phase compensation map.Next,we provide our experimental results,followed by a discussion of these results.
We performed a simple experiment to analyze the non-linear error,and the obtained results are illustrated in Fig.2.
Figure 2(a)is an experimental fringe pattern captured by a CCD camera.The grayscale distribution of the red line(including several fringe periods)in Fig.2(a)is shown in Fig.2(b),which indicates that the grayscale distribution of the fringe pattern has become non-sinusoidal.The red and blue lines in Fig.2(c)denote the ideal and real captured grayscales’responses to the projected grayscale of the red line in Fig.2(a),respectively.In Fig.2(d),the red and blue lines are the ideal linear and real measured phases calculated from the short green line(including one intact fringe period)in Fig.2(a),respectively.This shows that the distribution of the measured phase in one intact fringe period was not linear. Therefore,the projection and capture procedures directly lead to unwanted grayscale changes in the captured fringe pattern, resulting in a non-linear distribution in the acquired phase.In the following,we provide a theoretical analysis.
Typically,we can express the captured image from a DFP as


Then,we use a cosine power function to expand Eq.(3)as

To accurately analyze the non-linear error,we only study the harmonic waves for k≤8,because the harmonic wave with a higher order is small enough to be ignored.Four-step phase shifting is used in our system,and then,the non-linear error can be derived from Eq.(4)as


Since we have r≪ q and s≪ q,r and s can be ignored.The non-linear error can finally be described as

We can conclude from Eq.(7)that the non-linear error depends only on the ratio q and measured phaseφ.
TorealizetheproposedLUT,twotypesofphasesareintroduced. One is the measured phase containing the error(blue line in Fig.2(d))owing to the phase-shifting technique.The other is the true phase that is defined to describe the phase in the sinusoidal fringe.The true phase(red line in Fig.2(d))can be calculated from the intact fringe patterns(distributed linearly in the intact fringe)being projected.During the digital image processing,a true phase[−π,π]in each intact fringe is defined according to the number of pixels in the pitch.The true phase can be obtained only from the flat region where the phase is supposed to have a linear distribution,whereas the phase in the object region is not linear, since it contains shape information.The non-linear characteristicsof the fringe patterns are similar in a full field;thus,the nonlinear error in the object region can be eliminated by the phase compensation map obtained from the flat region.

Fig.2.(a)Captured fringe pattern.(b)Grayscale distribution of the red line in plot(a).(c)Response of captured grayscale to projected grayscale.(d)Wrapped phase of the green line.(For interpretation of the references to color in this figure legend,the reader is referred to the web version of this article.)
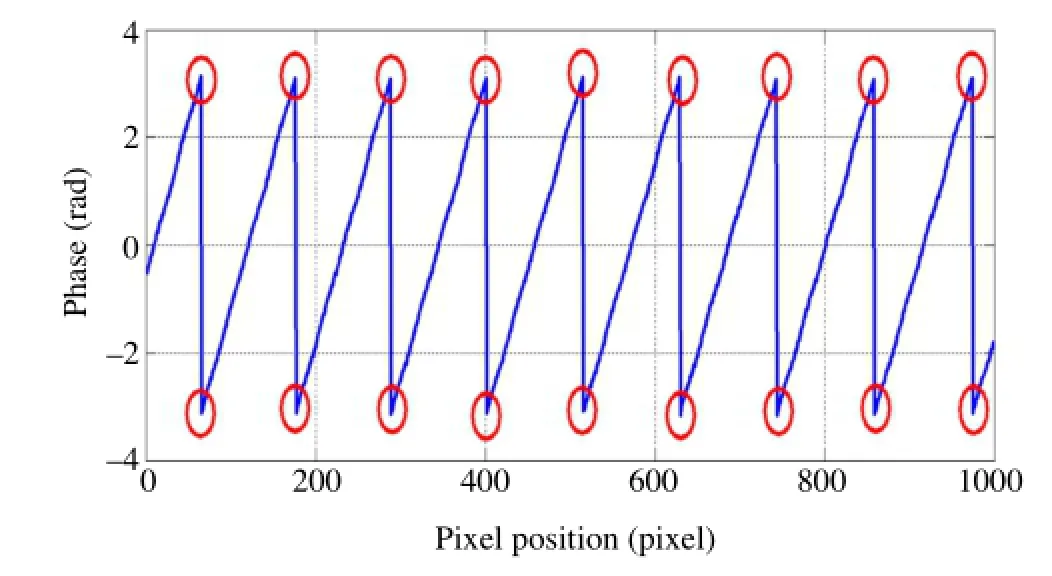
Fig.3.Distribution of wrapped phase(broken line)of the 100th row in Fig.2(a).A breakpointismarkedasaredellipseintheplot.(Forinterpretationofthereferences tocolorinthisfigurelegend,thereaderisreferredtothewebversionofthisarticle.)
A breakpoint in the wrapped phase map is recommended to distinguish the edge of each fringe from the captured image and confirm the number of pixels in each intact fringe pitch.The wrapped phase of the 100th row in Fig.2(a)is shown in Fig.3. The small red ellipses in Fig.3 mark the edge point of each fringe pitch.The number of pixels in each fringe pitch can be obtained by counting the number of pixels between the two adjacent ellipses.
Once the measured and true phases are both obtained,the LUT isusedtorecordthefull-fielddifferences.Thousandsofpixelsexist in one captured image;therefore,a number of arrays(intervals) are employed to classify this huge amount of data.We employ the average algorithm to calculate the recorded difference for each interval and consider the difference to be the error of the interval. Inourmeasurement,theLUTisdividedinto300intervals,andeach interval is denoted in order as In(n=1,2,3,...,300),as shown in Fig.4.
AsshowninFig.4,In(n=1,2,3,...,300)istheintervalandn istheindexnumberofeachintervalIn.Itisimportanttodetermine the sequence index(n)of the interval to which each pixel belongs. Specifically,if the measured phase of a pixel(ϕmp)belongs to the nth interval,it will satisfy the following

After confirming the interval sequence index n,the difference is recorded in the interval In.By traversing the full-field pixels,each intervalwillhaveanumberofrecordeddifferences.Figure5shows the data distribution of the 150th interval.
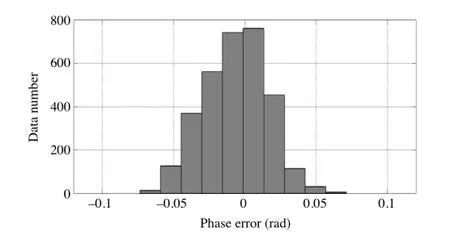
Fig.5.Data in the 150th interval.
As shown in Fig.5,most of the differences are distributed between−0.05 and 0.05.The average algorithm is employed to process these differences.The procedure can be described as

where errornis the error of the nth interval and average[In] represents the calculation process of the average algorithm imposed to the nth interval.Since each pixel’s interval sequence index is confirmed,building the phase compensation map by traversing the full-field measured phase is easy.Figure 6 shows an example of a phase compensation map.
Finally,we subtract the phase compensation map from the measured phase map to obtain the full-field accurate phase map.
To illustrate the effectiveness of the proposed LUT-based method,we carried out two experiments.We built a 3D measurement system,comprising a projector(Vivitek-D5158HD with a resolution of 1920×1280 pixels)and a CCD camera(Baslerace1600-20 g with resolution of 1600×1200 pixels).
In the first experiment,the fringe pattern was generated by a computer,and the object to be measured was a wafer 1 mm thick, with a flatness of 10µm,and a diameter of 80 mm.To obtain a higher precision result,the projector was defocused to give the projected fringe pattern a high contrast[24].

Fig.4.Intervals in the LUT.
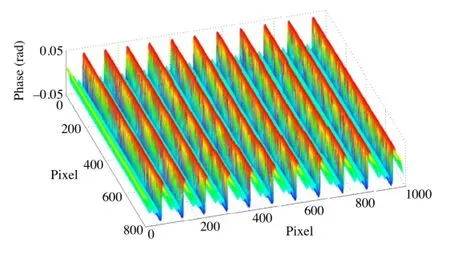
Fig.6.Phase compensation map.
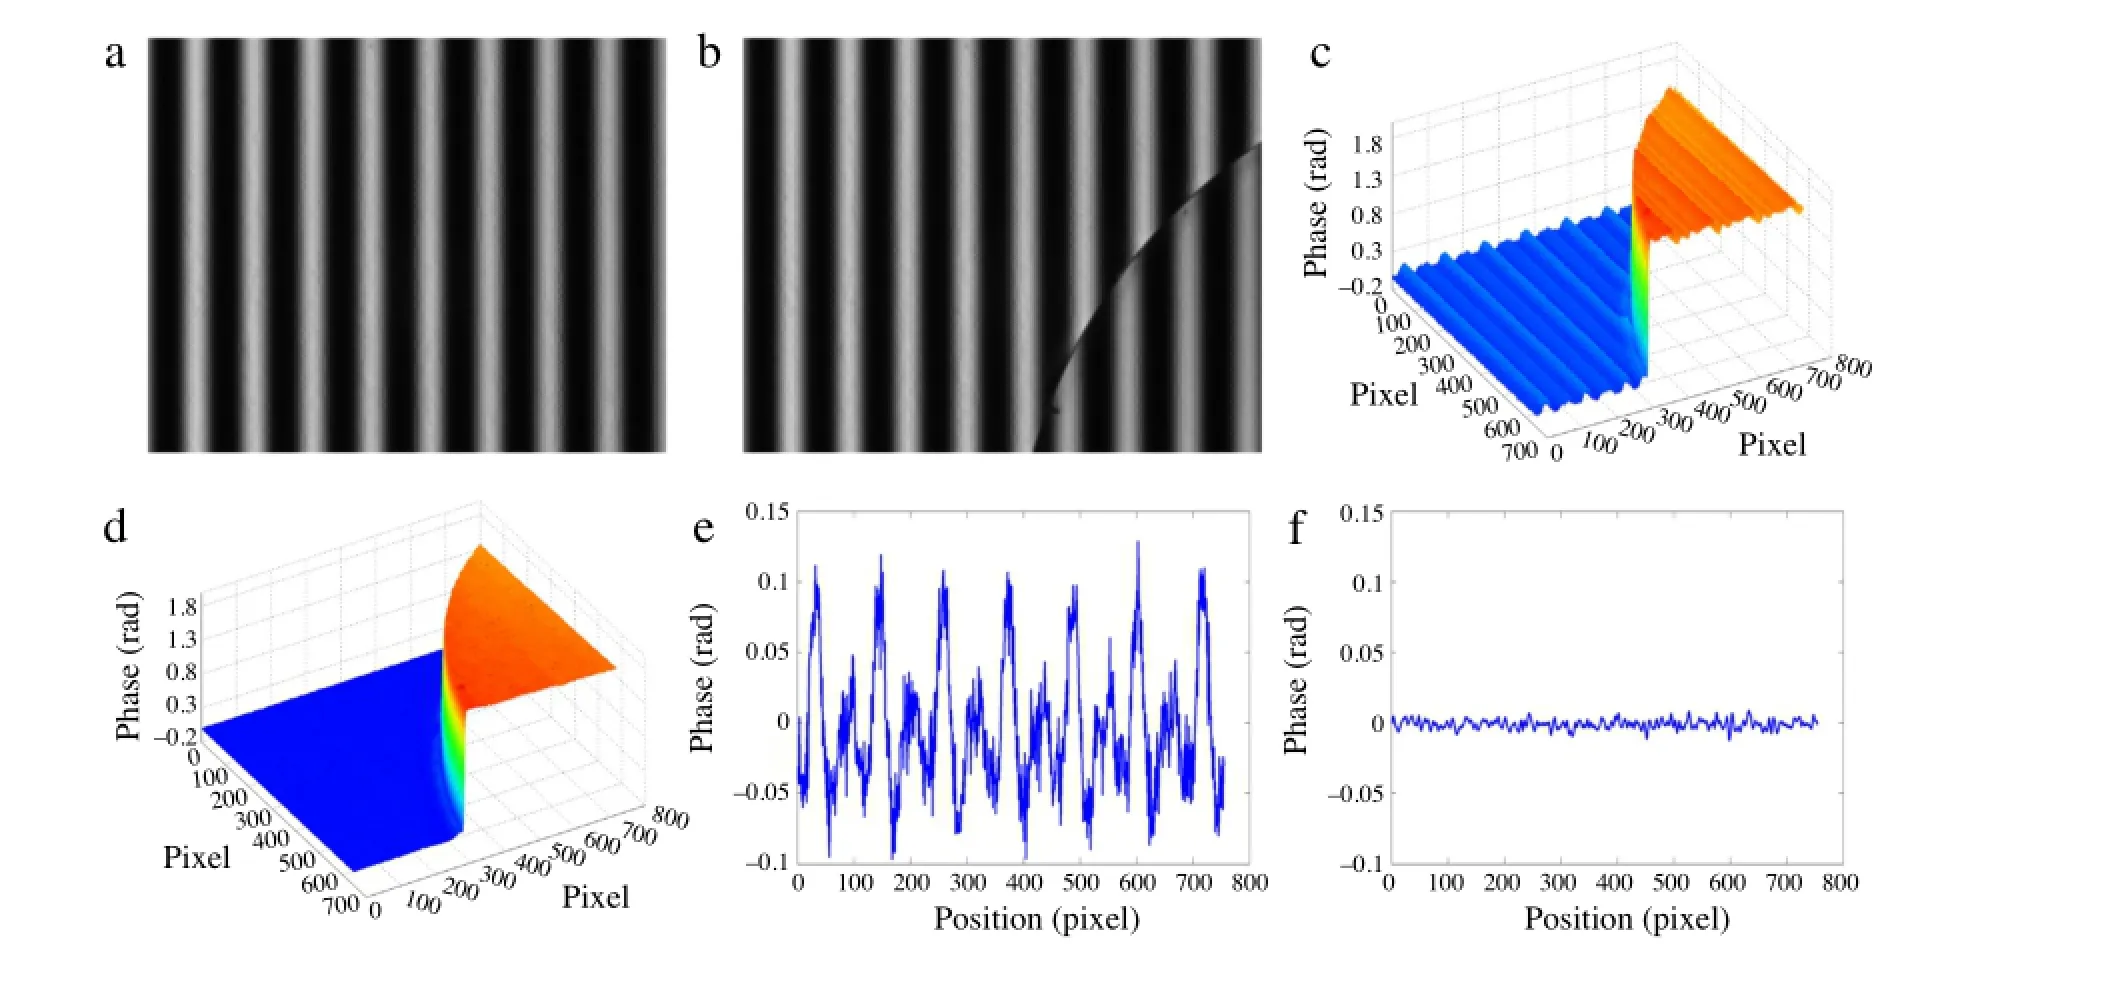
Fig.7.(a)Captured fringe pattern of background.(b)Captured fringe pattern of background with the wafer.(c)Wafer’s phase map before error compensation.(d)Wafer’s phase map after error compensation.(e)Measured phase of the 10th row data before error compensation.(f)Measured phase of the 10th row data after error compensation.
The four phase-shifting fringe patterns captured without and with the measured object are illustrated in Fig.7(a)and(b), respectively.Figure 7(c)shows the raw measured result of the measured object whose surface was wrapped with periodic ripples such that the measured object no longer had its original appearance.The phase of the periodic ripples was evaluated to be approximately 0.2 rad,whereas the phase of the wafer’s thickness was approximately 2 rad.This indicates that the size of the ripple was 1/10 that of the measured object,thus resulting in the surface not being recognized.The phase error in Fig.7(c)has an RMS of 0.0104 rad,whereas that in Fig.7(d)has a root mean square(RMS) of 0.0009 rad.This indicates that the phase error declines by a factor of 11.5 following the application of the proposed method.In comparison to these results,we note that periodic ripples hardly exist in the full-field and a better visual effect is obtained.
In the second experiment,we measured a more complex mask 165 mm in width,225 mm in length,and 65 mm in height,and Fig.8 shows the experimental results.
Figure 8(b)indicates that the periodic ripples on the mask surface were well alleviated after phase compensation.The mask not only became smoother but also had better visual effects. As such,we have proven that this method is effective in object profilometry.
In this study,we proposed a different method for realizing the LUT-based phase compensation algorithm,which fully utilizes the data information in the measured phase map.The advantage of this method is that it makes the realization of LUT-based measurement easier without affecting the error compensation result and also achieves the goal of automating DFP measurement. In our proposed method,the non-linear error is obtained directly from the flat area in the wrapped phase map,without needing to project a set of fringe patterns to calibrate a uniform flat surface board.The obtained experimental results show that our method greatly decreases measurement error by a factor of ten,which is similar in effectiveness to the results reported in[6,18–23], whereas our method is more conveniently implemented and has a better potential for application in real-time DFP systems.In addition,this method can be programmed with Visual C++and Matlab,making it capable of automated measurement.In addition tothe300intervalcasesanalyzed,weexperimentedwith100,200, 500,and 1000 intervals and obtained almost identical results,so it is easy to assign a given interval number.In addition,the LUT-based algorithm was derived to be suitable for the arbitrary step phase-shifting technique[18].
In this study,the non-linear error common to DFP is introduced and deeply examined.We then proposed a convenient LUT-based method to compensate for the non-linear error in the captured fringe patterns,which fully utilizes information in the measured phase map and establishes a compensation map to revise the measured phase.We described in detail the principle of the algorithm and performed experiments to demonstrate its effectiveness.
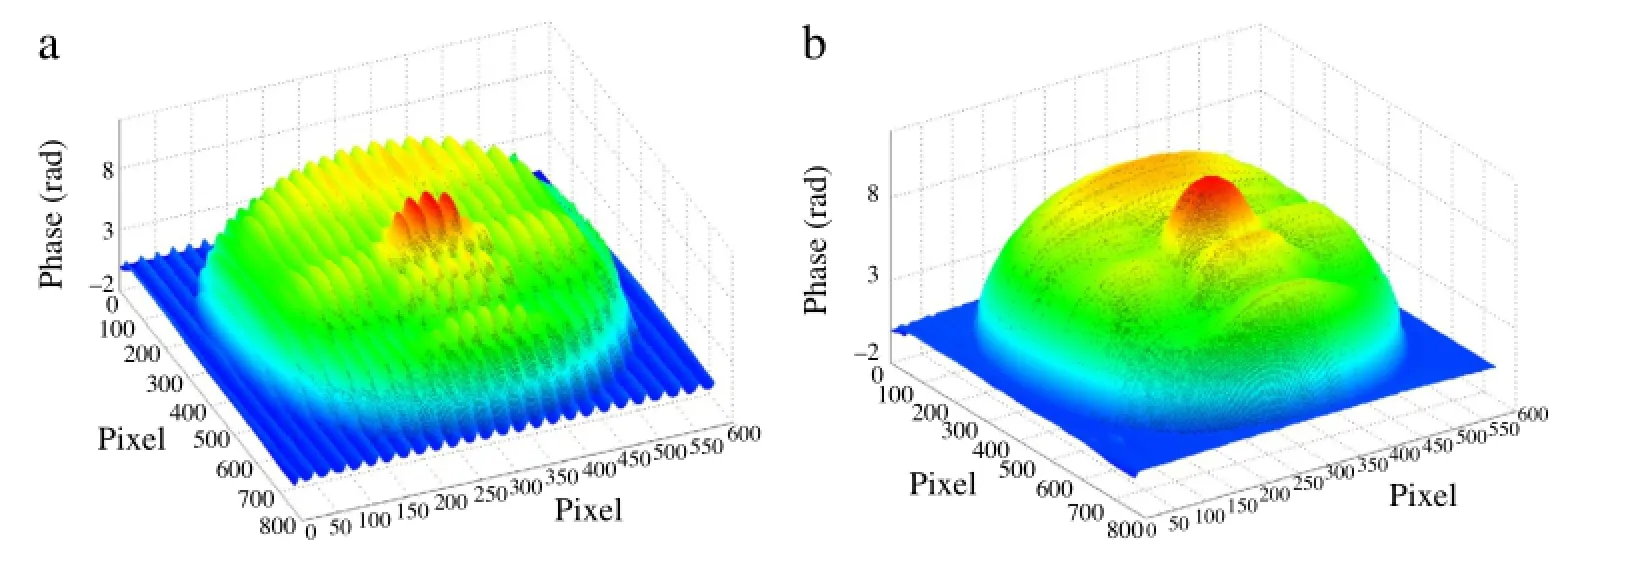
Fig.8.(a)Mask’s phase map before error compensation.(b)Mask’s phase map after error compensation.
Acknowledgments
The authors would like to acknowledge the financial support provided by the National Natural Science Foundation of China (11472267 and 11372182),and the National Basic Research Program of China(2012CB937504).
References
[1]S.S.Gorthi,P.Rastogi,Fringe projection techniques:Whither we are?Opt. Lasers Eng.48(2)(2010)133–140.
[2]S.Kishimoto,Electron moire method,Theoret.Appl.Mech.Lett.2(2012) 011001.
[3]C.Yang,H.Miao,Vibrationparametermeasurementusingthetemporaldigital hologram sequence and windowed Fourier transform,Theoret.Appl.Mech. Lett.1(2011)051008.
[4]X.Y.Sun,Y.Yuan,Z.K.Zhu,X.H.Zhang,Q.F.Yu,Videometric research on deformation measurement of large-scale wind turbine blades,Theoret.Appl. Mech.Lett.1(2011)011005.
[5]B.Pan,K.M.Qian,L.Huang,A.Asundi,Phase error analysis and compensation for nonsinusoidal waveforms in phase-shifting digital fringe projection profilometry,Opt.Lett.34(4)(2009)416–418.
[6]Z.Song,P.S.Huang,Phase error compensation for a 3-D shape measurement systembasedonthephase-shiftingmethod,Proc.ofSPIE6000(2005)60000E-1.
[7]T.Hoang,B.Pan,D.Nguyen,Z.Y.Wang,Genericgammacorrectionforaccuracy enhancement in fringe-projection profilometry,Opt.Lett.35(12)(2010) 1992–1994.
[8]Y.J.Ma,T.C.Xiong,X.F.Yao,Experimental investigation of interface curing stresses between PMMA and composite using digital speckle correlation method,Theoret.Appl.Mech.Lett.1(2011)051003.
[9]Z.Y.Wang,H.Du,Out-of-plane shape determination in generalized fringe projection profilometry,Opt.Express 14(25)(2014)12122.
[10]Y.J.Fu,Q.Luo,Fringe projection profilometry based on a novel phase shift method,Opt.Express 19(2011)21739.
[11]Z.W.Li,Y.S.Shi,C.J.Wang,D.H.Qin,K.Huang,Complexobject3Dmeasurement based on phase-shifting and a neural network,Opt.Commun.282(2009) 2699–2706.
[12]Y.Wang,Y.Feng,J.Y.Fan,Y.Fu,Gamma calibration and phase error compensation for phase shifting profilometry,Int.J.Multimed.Ubiquitous Eng.9(9)(2014)311–318.
[13]K.Liu,Y.C.Wang,D.L.Lau,H.Qi,L.G.Hassebrook,Gamma model and its analysis for phase measuring profilometry,Appl.Opt.27(3)(2010)553.
[14]Hongwei Guo,Haitao He,Mingyi Chen,Gamma correction for digital fringe projection profilometry,Appl.Opt.43(14)(2004)2096.
[15]Yves Surrel,Design of algorithms for phase measurements by the use of phase stepping,Appl.Opt.35(1)(1996)51.
[16]P.S.Huang,Q.Y.J.Hu,F.P.Chiang,Double three-step phase-shifting algorithm, Appl.Opt.41(22)(2002)4503.
[17]S.Y.Gai,F.P.Da,Fringe image analysis based on the amplitude modulation method,Opt.Express 18(10)(2010)10704.
[18]S.Zhang,S.T.Yau,Generic nonsinusoidal phase error correction for threedimensional shape measurement using a digital video projector,Appl.Opt.46 (1)(2007)36–43.
[19]C.W.Zhang,H.Zhao,L.Zhang,X.Wang,Full-field phase error detection and compensation method for digital phase-shifting fringe projection profilometry,Meas.Sci.Technol.26(2015)035201.
[20]Y.J.Fu,Z.G.Wang,G.Y.Jiang,J.Yang,A novel three-dimensional shape measurementmethod based ona look-up-table,Optik125(2014)1804–1808.
[21]P.S.Huang,Q.Y.Hu,F.P.Chiang,Error compensation for a three-dimensional shape measurement system,Opt.Eng.42(2)(2003)482–486.
[22]J.Schwider,T.Dresel,B.Manzke,Some considerations of reduction of reference phase error in phase-stepping interferometry,Appl.Opt.38(4) (1999)655.
[23]P.Zhou,X.R.Liu,Y.He,T.J.Zhu,Phase error analysis and compensation considering ambient light for phase measuring profilometry,Opt.Lasers Eng. 55(2014)99–104.
[24]S.Y.Lei,S.Zhang,Flexible 3-D shape measurement using projector defocusing, Opt.Lett.34(20)(2009)3080.
7 November 2015
http://dx.doi.org/10.1016/j.taml.2015.12.005
2095-0349/©2016 The Authors.Published by Elsevier Ltd on behalf of The Chinese Society of Theoretical and Applied Mechanics.This is an open access article under the CC BY-NC-ND license(http://creativecommons.org/licenses/by-nc-nd/4.0/).
∗.
E-mail address:miaohong@ustc.edu.cn(H.Miao).
*This article belongs to the Solid Mechanics
杂志排行
Theoretical & Applied Mechanics Letters的其它文章
- Editorial:Recent advances in mechanics of unconventional electronics
- The finite deformation of the balloon catheter
- Adhesion-governed buckling of thin-film electronics on soft tissues
- Mechanics of bioinspired imaging systems
- Recent development of transient electronics
- Recent advances on thermal analysis of stretchable electronics
