Numerical analysis of dynamic response of vehicle-bridge coupled system on long-span continuous girder bridge
2016-09-21LipengAnDejinLiPengYuPengYun
Lipeng An∗,Dejin LiPeng Yu,Peng Yun
aSchool of Civil Engineering,Central South University,Changsha 410075,ChinabNational Engineering Laboratory for High Speed Railway Construction,Changsha 410075,China
Letter
Numerical analysis of dynamic response of vehicle-bridge coupled system on long-span continuous girder bridge
Lipeng Ana,b,∗,Dejian Lia,b,Peng Yua,Peng Yuana,b
aSchool of Civil Engineering,Central South University,Changsha 410075,China
bNational Engineering Laboratory for High Speed Railway Construction,Changsha 410075,China
H I G H L I G H T S
·A vehicle model with seven degrees of freedom was built and the total potential energy of vehicle space vibration system was deduced.
·On the basis of the self-compiled Fortran program and bridge engineering,the dynamic response of long-span continuous girder bridge under vehicle load was studied.
·This study included the calculation of vehicle impact coefficient,evaluation of vibration comfort and analysis of dynamic response parameters.
A R T I C L EI N F O
Article history:
in revised form
21 April 2016
Accepted 27 May 2016
Available online 20 July 2016
Long-span continuous bridge
Vehicle-bridge coupled system
Dynamic response
Vehicle impact coefficient
Vibration comfort
To systematically study the vehicle-bridge coupled dynamic response and its change rule with different parameters,a vehicle model with seven degrees of freedom was built and the total potential energy of vehicle space vibration system was deduced.Considering the stimulation of road roughness,the dynamic response equation of vehicle-bridge coupled system was established in accordance with the elastic system principle of total potential energy with stationary value and the‘set-in-right-position’rule.On the basis of the self-compiled Fortran program and bridge engineering,the dynamic response of longspan continuous girder bridge under vehicle load was studied.This study also included the calculation of vehicle impact coefficient,evaluation of vibration comfort,and analysis of dynamic response parameters. Results show the impact coefficient changes with lane number and is larger than the value calculated by the‘general code for design of highway bridges and culverts(China)’.The Dieckmann index of bridge vibrationisalsorelatedtolanenumber,andthevibrationcomfortevaluationisgoodinnormalconditions. Therelevantconclusionsfromparametricanalyseshavepracticalsignificancetodynamicdesignanddaily operation of long-span continuous girder bridges in expressways.Safety and comfort are expected to improve significantly with further control of the vibration of vehicle-bridge system.
©2016 The Author(s).Published by Elsevier Ltd on behalf of The Chinese Society of Theoretical and
Applied Mechanics.This is an open access article under the CC BY-NC-ND license(http://creativecommons.org/licenses/by-nc-nd/4.0/).
A limited amount of research has proposed complex models of vehicle-bridge coupled vibration of highway bridges before the 1990s[1].Kawatani et al.[2]used a numerical method to calculate the dynamic response of a bridge structure on the basis of a vehicle model with two degrees of freedom.Chatterjee and Datta[3]analyzedvehiclebraking’seffectonthedynamicresponse of a simply supported girder bridge by simulating the bridge into orthotropic plates and concentrated mass distribution beams. Wang and Huang[4]used random numerical method to simulate the good,general,and poor road levels in line with the power spectral density function of road roughness.Green and Cebon[5] presented a calculation method of bridge dynamic response under wheel load and analyzed the effect of vehicle-bridge dynamic action.Silva[6]proposed a total probability formula in the frequency domain to calculate the dynamic response of a highway bridge.Jonsson et al.[7]established a vehicle-bridge coupled vibration equation through a stimulation of road roughness and discussed the influence factors of dynamic response.Zhang and Xia[8]studied the vehicle-bridge coupled dynamic response of an urban elevated bridge on the basis of a self-compiled Fortran program.Li et al.[9]studied the semi-active control method of a vehicle-bridge coupled vibration system.
Someresearchershavestudiedtheimpactcoefficientofbridges since the 1980s.The EMPA laboratory in Switzerland[10]derived the expression of bridge impact coefficient defined from amplified spectra based on experiments on 226 types of highway bridges. Wu[11]tested two bridges in the field and found that themaximum dynamic coefficient occurred within a certain range of a structure’s natural frequency.Xu[12]analyzed numerous expressions of impact coefficient of highway bridges in a forest region.Kwasniewski et al.[13]discovered that the experimental value of the impact coefficient was greater than the calculated value in line with the specification method when the vehicle speed is higher.He et al.[14]studied the impact of road roughness on the dynamic effect of a vehicle-bridge coupled vibration system.With the use of the load identification method,Liu et al.[15]found that the arrangement of vehicle load,the load level,and the size of span affected the value of the impact coefficient.
The‘general code for design of highway bridges and culverts(China)’stipulates that vehicular impact coefficient is related only tobridgenaturalvibrationfrequency[16].Butinfact,thevehicular impact on the bridge often changes with other factors such as vehicle speed and its load when vehicles quickly pass through a long-span continuous girder bridge[13-15].Moreover,the vibration of the vehicle-bridge can increase passenger discomfort;this issue has been highlighted in published works on driving comfort.Highways in China have developed rapidly.A notable problem is that moving vehicular load affects the dynamic response and driving comfort of the long-span continuous girder bridge.This issue has practical significance to dynamic design and daily operation of the long-span continuous girder bridge,as determined in a systematic study of the vehicle-bridge coupled dynamic response and its change rule with different factors, including the vehicular parameters and the bridge characteristics. Driving can be more secure and comfortable when the vibration of the vehicle-bridge system is controlled.For these reasons,the dynamic response of a long-span continuous girder bridge under vehicle load and its relevant parameter impacts were studied in this paper on the basis of a long-span continuous girder bridge in the expressway.
Considering that a vehicle consists of wheels,axles,and body,a multi-rigid-body system model was established.The components were connected by a spring system and a damping system.The basic assumptions are as follows:
(1)The vehicle’s wheels,axles,and body are absolutely rigid. The wheel,axles,and bridge floor are connected by a first-spring damping system.The wheel,axles,and vehicle body are connected by a second-spring damping system.
(2)The wheels,axles,and body demonstrate a uniform rectilinear motion without regard for the bridge’s longitudinal vibration.
(3)The vehicle’s wheels,axles,and body vibrate within a small displacement.
(4)The spring among rigid components is linear,and its damping is hysteretic.
(5)The vehicle’s wheels,axles,and body exhibit a bilateral symmetry.
(6)The vehicle’s wheels are always contacted closely with the bridge floor,which means that the jump phenomenon does not occur and both vertical displacements are the same.
The two-axle model of a vehicle consists of a vehicle body and four wheels.A multi-axle trailer can also be transformed into a two-axle model in accordance with relevant principles.On the basis of the above points,a vehicle model with seven degrees of freedom was built as shown in Fig.1.
The wheels are labeled a,b,c,and d from front to back and from left to right,respectively.Suppose the body and wheels moved in the vertical direction and the body also rotated along the bridge’s longitudinal and transversal directions.Thus,a total of seven degrees of freedom can be described as follows:

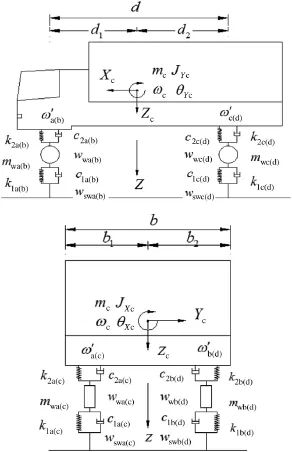
Fig.1.Vehicle dynamic analysis model.
Annotation:
wwa,wwb,wwc,wwd:vertical displacement of the wheel(the vertical beam displacement of touchpoints of the wheel);
wc:vertical displacement of the car body;
θXc,θYc:rotational displacement of the car body around the bridge’s longitudinal and transversal directions;
wswa,wswb,wswc,wswd:vertical displacement of first-spring between the wheel and the bridge floor;
mwa,mwb,mwc,mwd,mc:mass of the wheels and the car body;
k1a,k1b,k1c,k1d:spring stiffness between the wheel and the bridge floor(first-spring stiffness);
c1a,c1b,c1c,c1d:damping coefficient between the wheel and the bridge floor(first-spring damping coefficient);
k2a,k2b,k2c,k2d:spring stiffness between the wheel and the car body(second-spring stiffness);
c2a,c2b,c3c,c4d:damping coefficient between the wheel and the car body,and is also called second-spring damping coefficient;
JXc,JYc:rotationalinertiaofthecarbodyaroundthelongitudinal and transversal axis of the barycenter;
d:distance from the front and rear axles to the suspension center;
d1,d2:distance from the front and rear axles to the barycenter of the car body;
b:width of the car body;
b1,b2:distance from the left and right wheels to the barycenter of the car body.
Suppose the front-wheel group(a,b)and rear-wheel group(c,d)are contacted with the elements of the bridge structure, respectively,as shown in Fig.2.
Annotation:ea(c),eb(d)are the horizontal distances from the left and right wheels to the barycenter of the beam element;h0is the vertical distance from the top surface of the beam element to the barycenter.
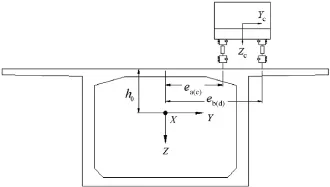
Fig.2.Displacement diagram of wheel in contact with bridge element.
The left and right joints’displacement of beam element where wheels and axles were located is as follows:

Annotation:The parameters in Eq.(2)indicated the left and right joints’displacement and rotation angle of the beam element in the X,Y,and Z directions successively.
Hence,the displacement of the beam element’s barycenter where the first-spring damping system was located({δ}sn=[N]{δ})is

usn,vsn,wsn:The displacement of bridge element under the wheel in the X,Y,and Z directions successively;
θXsn,θYsn,θZsn:The torsional Angle of bridge element under the wheel in the X,Y,and Z directions successively where[N]is the displacement shape function of the beam element
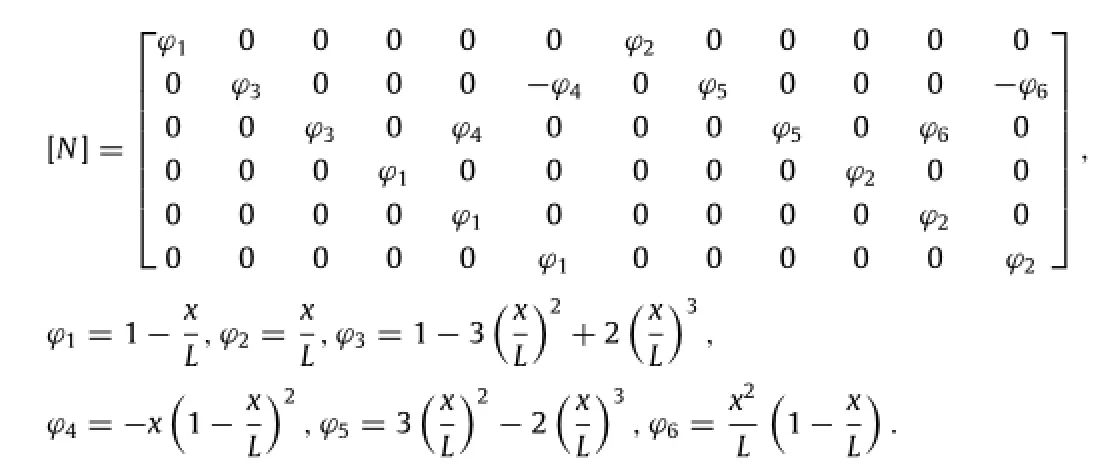
Annotation:L in the above formula indicates the length of the beam element where the wheels are located.x indicates the displacement from the wheel to the beam element’s joint i in the x axis.
Atpresent,aunifiedapplicationspecificationofroadroughness has not been formally defined in China.On the basis of Ref.[8],the deterministic analysis method was used to describe bridge’s road roughness,and the following function was applied in this paper:

Annotation:x indicates the longitudinal coordinate of bridge deck;the value of lvis 11.5m;the value of avis 0.02,0.03, and 0.04 m,which corresponds to the A,B,and C levels of road roughness y.Obviously,a higher road roughness corresponds to a worse bridge surface condition.
Thus,the road roughness where wheels are located can be expressed as follows:

Then the displacement of the contact position between the first-spring damping system and bridge floor can be expressed as follows:

where[Tsc]is the transformation matrix,and en(n=a,b,c,d)represents the horizontal distances from every wheel to the barycenter of the beam element

wswa,wswb,wswc,wswdindicate the displacement of the contact positionbetweenthefirst-springdampingsystemandbridgefloor, which are not independent displacement but are related to the joint displacements of the beam element

Therefore,the displacements of connections between wheels and car body can be expressed as follows:

The static equilibrium position under bridge gravity was regardedasthezeropointofpotentialenergywhencalculatingthe dynamic potential energy of the vehicle.
The inertia force of car body performed negative work

The inertia force of wheels and axles also performed negative work

The strain energy of the bridge floor and the vehicle’s firstspring is

Annotation:Δ1a,Δ1b,Δ1c,Δ1dare the elongation of firstspring among the wheels,axles,and bridge floor.

The strain energy of the vehicle’s second-spring is

Annotation:Δ2a,Δ2b,Δ2c,Δ2dare the elongation of secondspring among the wheels,axles,and bridge floor.

The damping force of first-spring damping performed negative work

The damping force of second-spring dampings performed negative work

The gravitational potential energy of vehicle can be expressed as follows:


Fig.3.Bridge span arrangement(unit:m).
Pswa,Pswb,Pswc,Pswdindicate the vehicle gravity where wheels contacted with the bridge floor.
Suppose that n vehicles are present on the bridge.Then,the total potential energyVof vehicles’space vibration can be obtained by combining each vehicle component’s inertia potential energy[17],elastic strain energy,damping force potential energy, and gravitational potential energy


In line with Eq.(16),the vehicle space vibration equation can be obtained as

Suppose all joint displacements are small displacement and all amounts of degrees of freedom are n in the bridge structure.With the static equilibrium position under bridge gravity considered as the original state,the total potential energySof the bridge structure can be expressed by its elastic strain energy UKS,inertia force’s negative work UIS,and damping force’s negative work UDS:

On the basis of the principle of total potential energy with stationary value,the variation of the total potential energy of the bridge structure was calculated and the motion equation of the bridge structure can be deduced as

With the static equilibrium position under bridge gravity considered as the zero point of potential energy and the original state of vehicle-bridge coupled system,which meant{PS}= {0}, Eq.(19)can be written as follows:


The main bridge is a prestressed concrete continuous box girder with high piers and a large span constructed by cast-in-situ cantilevermethod.Thespanarrangementis(78+130+78)m,and the girder cross-section is a single cell and single-box section of six two-way lanes,whose width of the top deck and bottom deck is 12 and 6.5 m,respectively.The main pier consists of hollow thinwalled piers with a rectangular section;the pier wall’s thickness is 0.8 m in the longitudinal direction and 1.05 m in the transverse direction.The braking pier’s height is 36 m(see Fig.3.)
The FEM model of a bridge was built by Midas Civil,whose superstructure adopted a space beam element with 12 degrees of freedom.The bridge was divided into 139 elements as shown below.
The‘general code for design of highway bridges and culverts(China)’(JTG D60-2004 Code)[16]states the vehicular impact coefficient is related to the bridge’s fundamental frequency. In accordance with the stipulation,the impact coefficient of prestressed concrete bridge should be calculated as follows:
when f<1.5 Hz,µ=0.05;
when 1.5 Hz≤f≤14 Hz,µ=0.1767ln(f)-0.0157;
when f>14 Hz,µ=0.45.
Annotation:f is the structure fundamental frequency.
On the basis of the dynamic response equation of vehicle-bridge coupled system derived above and the theoretical calculationmethodofthenaturalvibrationcharacteristicofalongspan continuous bridge,a Fortran program was compiled to calculate the natural frequencies of girder.A comparison between the results of the self-compiled program and the FEM model was conducted,and the top 10 natural vibration frequencies were calculated as shown below.
Table 1 shows that the results of the self-compiled program and the Midas Civil model was approximate in natural vibration characteristic analysis of the girder,thereby showing that each mode of vibration was in agreement and that using the selfcompiled program to analyze the dynamic response of the vehicle-bridge coupled system was correct and feasible.The pier stiffness was not taken into consideration when calculating the natural frequency of girder.Thus,the corresponding calculated values were greater than the results of the whole bridge model. Moreover,the value of impact coefficient was 0.05 because f<1.5 Hz.
The calculation model of bridge static deflection was in accordance with its dynamic characteristic analysis model,as shown in Fig.4.The A-level road roughness was adopted and parameter values(av=0.02 m,lv=11.5 m)were substituted in Eq.(4).
On the basis of the description of spatial seven-degrees-offreedom vehicle model and Ref.[18],the parameter values of vehicle were determined as shown in Table 2.
Under the premise of meeting vehicle layout requirements, the worst-case loading was executed in the longitudinal direction(Fig.5),and two load cases were calculated with different lane numbers in the transversal direction.The first case was a single lane with three cars per lane.The second case was three lanes with three cars per lane and symmetrically arranged cars as shown in Fig.6.

Table 1 Finite element calculation values of the natural characteristics of the bridge.
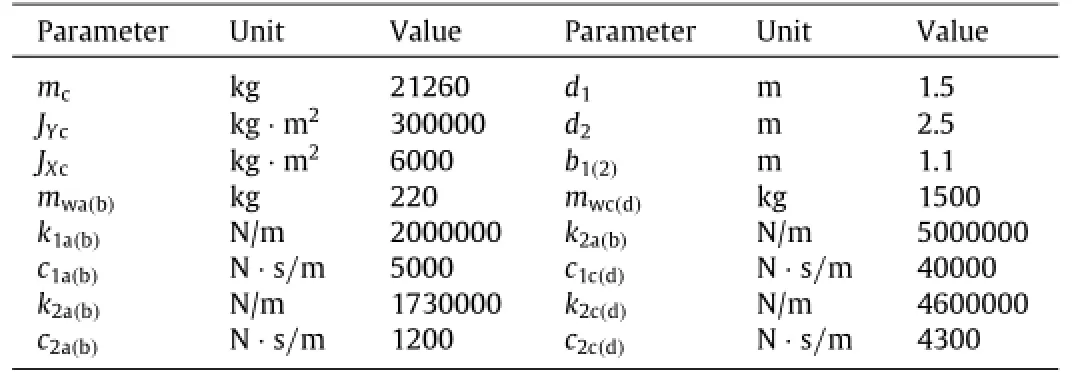
Table 2 Parameters of vehicle model.

Fig.5.Vehicle layout in longitudinal direction(unit:cm).
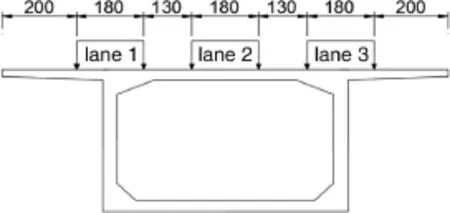
Fig.6.Vehicle layout in transversal direction(unit:cm).
For these two cases,the midspan deflection of the mainspan was calculated by the self-compiled program and Midas Civil, respectively,and their calculation results are compared in Table 3.
Table 3 shows that the deflection results of the self-compiled program and the Midas Civil model were accordant in both load cases,thereby verifying the feasibility of the self-compiled program and the validity of the vehicle-bridge model.
In structural dynamic analysis,the bridge impact coefficient is defined as the ratio of the difference between maximum vertical dynamic displacement and static displacement to the maximum value of vertical static displacement at the bridge’s midspan[19]

Annotation:dmaxd,dmaxjindicated maximum vertical dynamic displacement and static displacement,respectively.
Two worst-case loadings were chosen for dynamic response analysis of the bridge:(a)first case:single lane and three vehicles in parallel with a spacing of 15 m;(b)second case:three lanes and three vehicles per lane were in parallel with a spacing of 15 m(vehicle layout was as shown in Figs.5 and 6).The vehicle running speedwas120km/h.TheA-levelroadroughnesswasadopted,and parameter values(av=0.02 m,lv=11.5 m)were substituted in Eq.(4).Theresultscalculatedbytheself-compiledprograminboth conditions are shown in Table 4.
In Figs.7 and 8 and Table 4,the maximum dynamic displacement,acceleration,and impact coefficient of three lanes under vehicle load were all larger than those of single lane.The impact coefficient was 0.165-0.186,which was much larger than 0.05 calculated by the JTG D60-2004 code.
Bridge structure vibration caused by vehicle occurs during normal use.When pedestrians were present on the bridge,the evaluated comfort of the human body during bridge structure vibration can be distinguished by Dieckmann index K,which is the limit of comfort evaluation.When the bridge vibrated vertically, the computational formula of K was as follows:

Annotation:D is the amplitude in mm;f is the vibration frequency in Hz.
In accordance with the calculated K,the evaluated comfort of the human body during bridge structure vibration is shown in Table 5.
On the basis of the calculation results of the bridge’s displacement time history,which was transformed by fast Fourier method,the bridge’s dynamic response spectrum can be analyzed and shown in Table 6.In Table 6,the displacement amplitude of single lane and three vehicles in parallel with a spacing of 15 m and a speed of 120 km/h was smaller than that of three lanes with the same traffic conditions.At the moment,the K value changed from 1.30 to 1.42,and humans can tolerate any long-term vibration in this range.Thus,the vibration comfort evaluation was good.

Table 3 Comparison of midspan deflection of mainspan calculated by self-compiled program and Midas Civil(unit:cm).

Table 4 Dynamic response and impact coefficient of midspan.
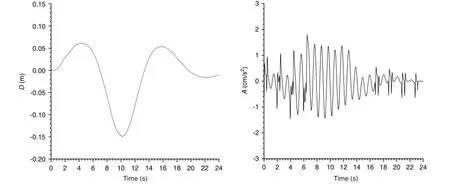
Fig.7.Vertical displacement and acceleration time history of continuous girder bridge midspan in the first case(single-lane).
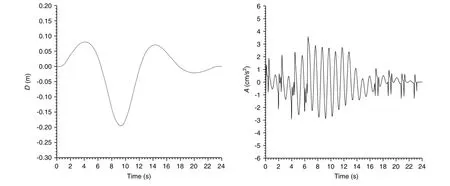
Fig.8.Vertical displacement and acceleration time history of continuous girder bridge midspan in the second case(three-lane).

Table 5 Evaluation standard of Dieckmann index K.

Table 6 Dieckmann index K and midspan dynamic response.
The impact parameters of dynamic response of vehicle-bridge coupled system can be divided into vehicle parameters,including running speed,vehicle load,vehicle spacing,and lane number,and bridge parameters,which mainly include road roughness.When the parameters’impact on dynamic response of coupled system was analyzed,the relation curve between dynamic response and parameters can be plotted on the basis of the principle of changing a single parameter while others are kept the same.Then,the impact law on vibration comfort can be obtained under the vibration of the bridge and the vehicle.
In dynamic response analysis,on the basis of the description of the seven-degrees-of-freedom vehicle model in Fig.1 of the paper andRef.[18],theparametervaluesofvehiclemodelwerethesame as in Table 2.
The parameters’impact on bridge dynamic response showed not only in the maximum acceleration and the maximum dynamic displacement,but also in the impact coefficient and comfort.
When vehicles ran on the bridge,the road roughness,as the initial vibration source,played an important role on the dynamic response of the vehicle-bridge coupled system.The road roughness was simulated by Eq.(4),whose parameter values were 0.02,0.03,and 0.04 m for the A,B,and C levels of road roughness, respectively.The following vehicle parameter values were used: vehicle load of 21.26 t;running speed of 120 km/h;vehicle spacing of 15 m;and the bridge was composed of a single lane with three vehicles running in parallel and in the same direction.Theother parameters were the same as those in Table 2.The results calculated by the self-compiled program are shown in Fig.9.
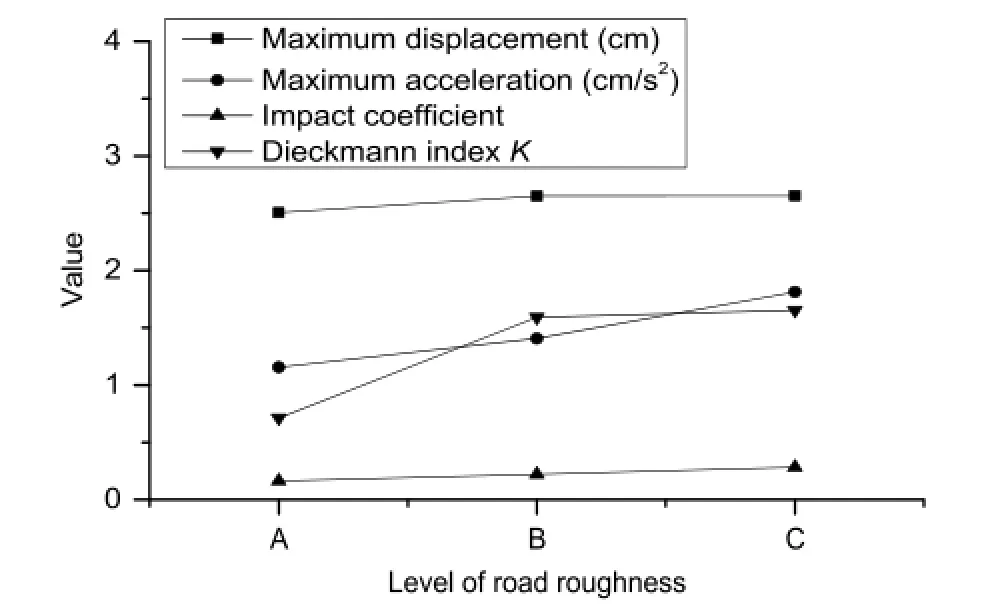
Fig.9.Dynamic response and Dieckmann index K at bridge midspan in different road roughness levels.
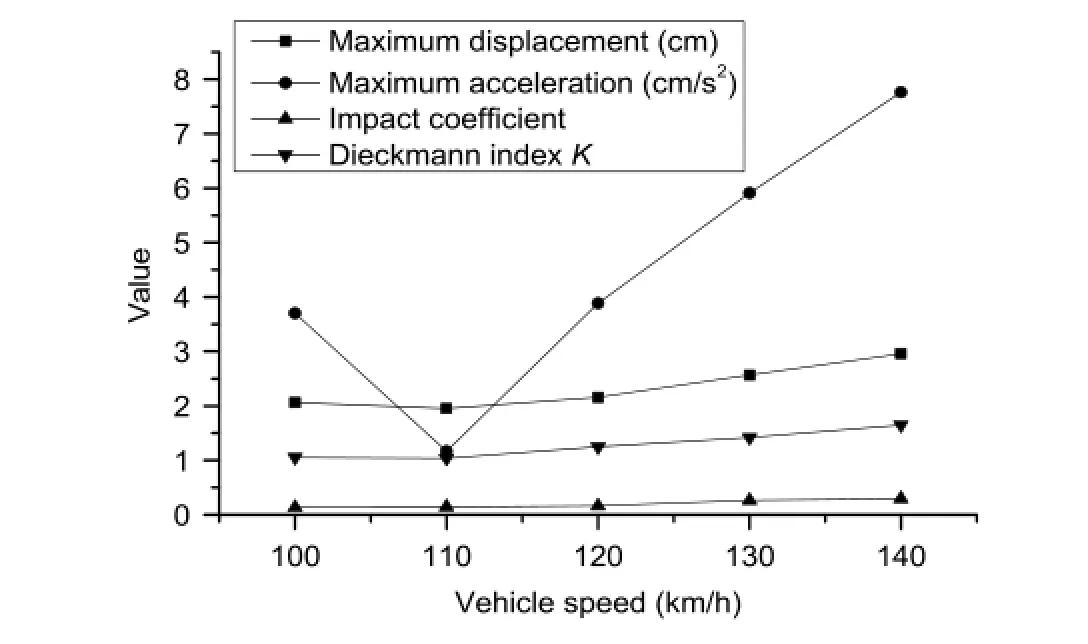
Fig.10.Dynamic response and Dieckmann index K at bridge midspan at different vehicle speeds.
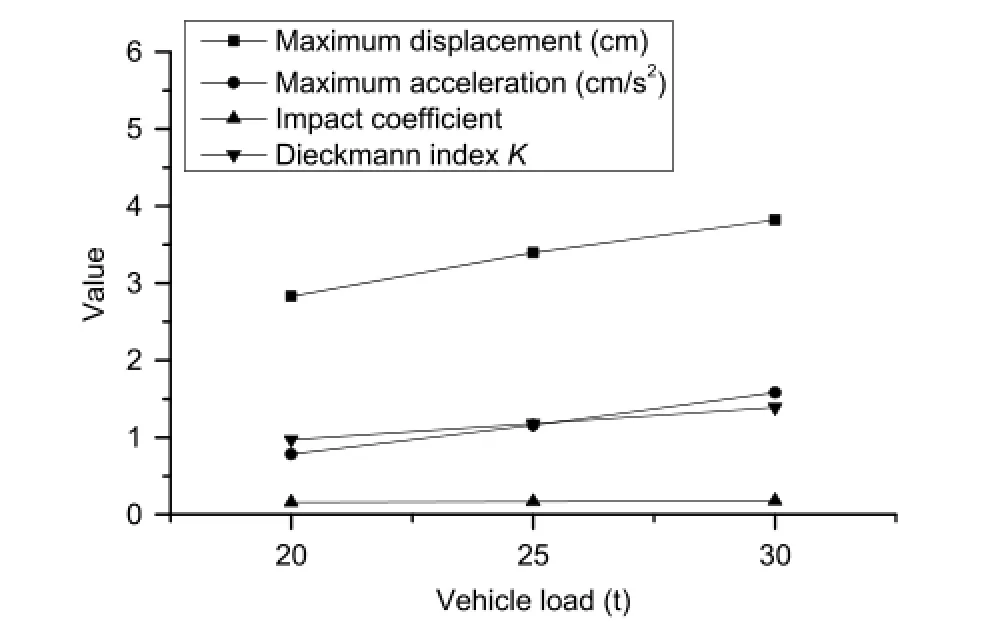
Fig.11.Dynamic response and Dieckmann index K at bridge midspan at different vehicle loads.
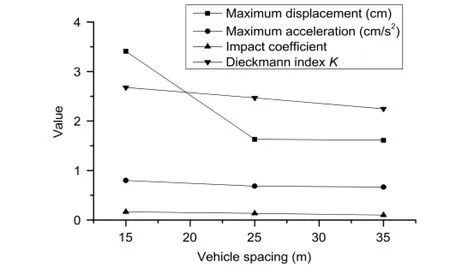
Fig.12.Dynamic response and Dieckmann index K at bridge midspan at different vehicle spacings.
In Fig.9,a higher road roughness corresponds to a greater dynamic response of the bridge;the impact coefficients were all greater than the standard value of 0.05.The Dieckmann index K changed from 0.713 to 1.655,and the human feeling of vibration changed from ‘can feel the vibration’to‘can tolerate any long-term vibration’.The level of road roughness obviously had a great effect on bridge impact coefficient and comfort.Therefore, strengthening the control of road roughness during construction and maintaining the road surface during later operation are necessary.
Five vehicle running speeds,100,110,120,130,and 140 km/h, were chosen for impact analysis.The level of road roughness was A,and other parameters were invariable.The results calculated by the self-compiled program are shown in Fig.10.
In Fig.10,the dynamic responses did not increase with increasing vehicle speed.The impact coefficient at 110 km/h was 0.145;this value is smaller than that at 100 and 120 km/h but is still much larger than the 0.05 calculated by the JTG D60-2004 code.What can be predicted was the monotonic increase of the impact coefficient when the vehicle speed was higher than 120km/h.ThechangelawofDieckmannindexwasconsistentwith theimpactcoefficient,whosesmallervaluewas1.038at110km/h, and humans can tolerate any long-term vibration at the moment. Therefore,vehicles should slow down on the bridge to guarantee minimum speed.
Three vehicle loads,20,25,and 30 t,were chosen for impact analysis.The level of road roughness was A,and other parameters were invariable.The results calculated by the self-compiled program are shown in Fig.11.
In Fig.11,the dynamic responses increased with the increase of vehicle load.When the vehicle load increased from 20 to 30 t, the maximum acceleration of midspan increased from 0.781 to 1.581 cm/s2.The impact coefficient increased monotonically and was much larger than the standard value of 0.05.The Dieckmann index also increased,and the human feeling of vibration was‘can tolerate any long-term vibration’.Reducing damage caused by vehicleoverloadisnecessarytostrengthenthelimitofvehicleload during daily operation management.
Three vehicle spacings,15,25,and 35 m,were chosen for impact analysis.The level of road roughness was A,and other parameters were invariable.The results calculated by the selfcompiled program are shown in Fig.12.
InFig.12,thedynamicresponsesdecreasedwiththeincreaseof vehiclespacing.Whatcanbepredictedwasthemonotonicincrease of the impact coefficient when the vehicle spacing increased. The Dieckmann index was slightly larger,and the human feeling of vibration was still‘can tolerate any long-time vibration’. Expanding the vehicle spacing not only helps to ensure traffic safety but can also reduce bridge vibration.
The vehicle always ran in one lane in the abovementioned impact analyses of parameters.More dynamic responses can be observed with more lanes.Three lane numbers,namely,single lane,double lane,and three lanes in the same direction,were chosen for impact analysis.The level of road roughness was A,and other parameters were invariable.The results calculated by the self-compiled program are shown in Fig.13.
In Fig.13,the dynamic responses increased with the increase of lane number;the maximum acceleration in particular increased with time.The impact coefficient increased monotonically and was much larger than standard value 0.05.The Dieckmann indexalso increased,and the human feeling of vibration remained‘can tolerate any long-term vibration’.
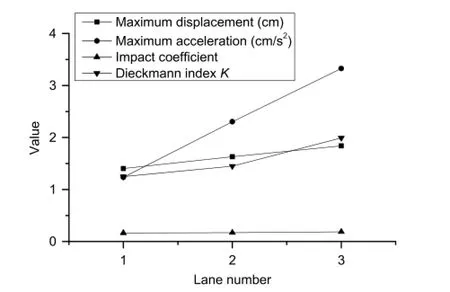
Fig.13.Dynamic response and Dieckmann index K at bridge midspan with different lane numbers.
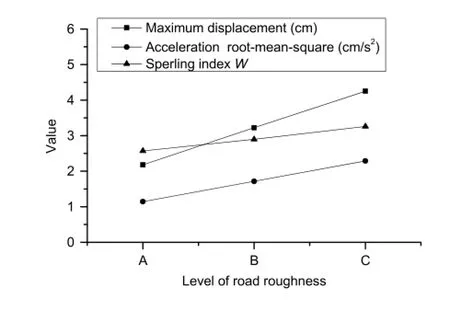
Fig.14.Dynamic response and Sperling index W of car body at different road roughness levels.
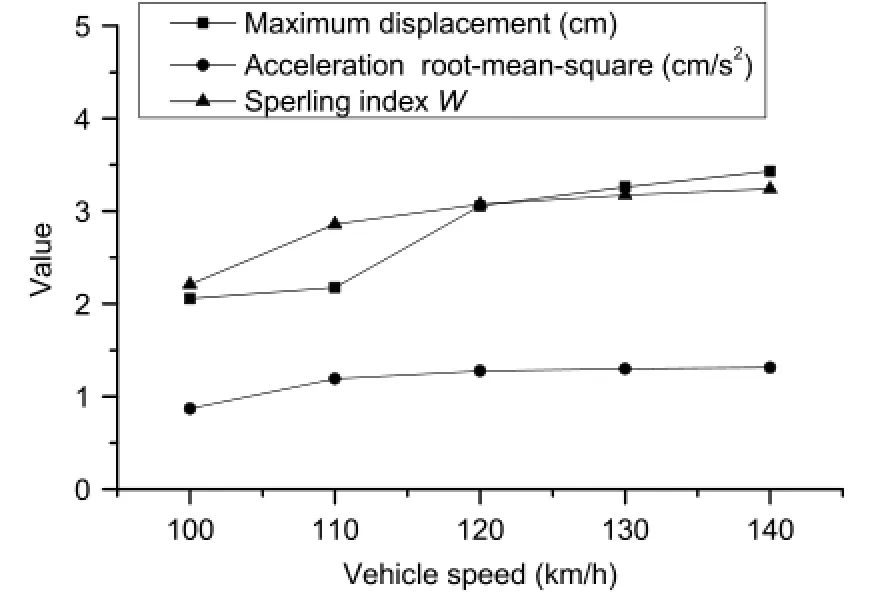
Fig.15.Dynamic response and Sperling index W of car body at different vehicle speeds.
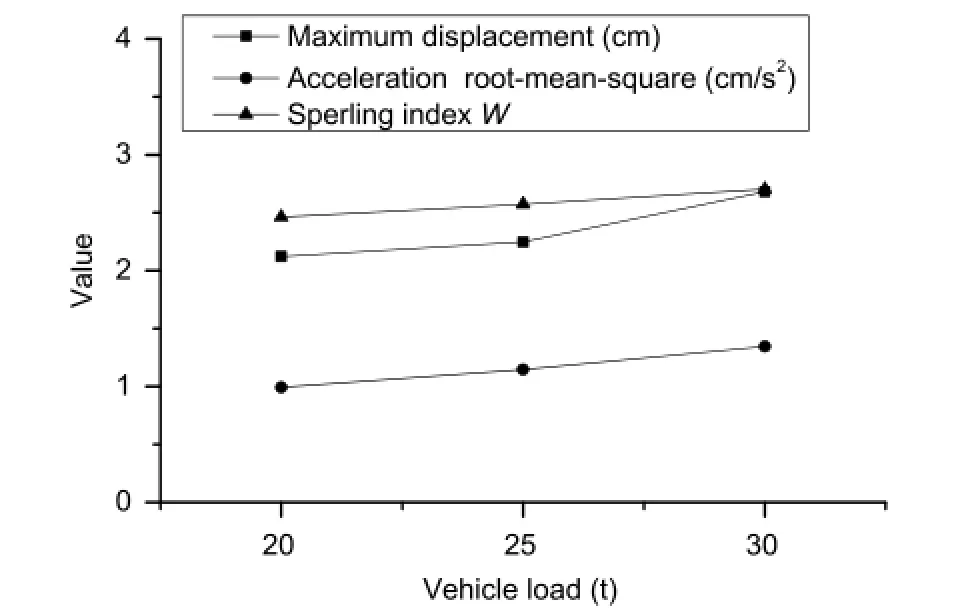
Fig.16.Dynamic response and Sperling index W of car body at different vehicle loads.
The parameters’impact on vehicle dynamic response not only showed in the maximum acceleration and the maximum dynamic displacement but also in the vibration comfort.The ISO standard and Sperling index[20]were adopted in this paper.
The road roughness was simulated by Eq.(4),and its parameter values were 0.02,0.03,and 0.04 m at the A,B,and C levels of road roughness,respectively.The vehicle parameters were the same as in Table 2.The results calculated by the self-compiled programwereobtainedinFig.14throughananalysisofthevertical displacement and acceleration in the first car’s body center.
As shown in Fig.14,the vertical dynamic displacement showed an increasing trend with the increase of road roughness.The dynamic displacement at the C level was almost twice that at the A level,which meant the human feeling of vehicle vibration changed from‘uncomfortable’to‘extremely uncomfortable’in line with the ISO standard.Furthermore,the Sperling index W was regarded as a more appropriate impact analysis method of road roughness[20].At the moment,the human feeling of vehicle vibration changed from ‘feel strong and irregular vibration but still can be tolerated’to‘feel extremely irregular vibration and cannot be tolerated for a long time’.Thus,the road roughness had a significant effect on the dynamic response of the vehicle, and a higher road roughness corresponded to worse discomfort for humans.Therefore,decreasing the road roughness during construction to reduce vehicle vibration and improving vibration comfort and maintenance of road surface during later operation are necessary.
Five vehicle running speeds,100,110,120,130,and 140 km/h, were chosen for impact analysis.The level of road roughness was A,and other parameters were invariable.The results calculated by the self-compiled program are shown in Fig.15.
In Fig.15,the dynamic responses increased with the increase of vehicle speed.On the basis of ISO standard,the human feeling of vehicle vibration was‘uncomfortable’at 100 km/h,and it can change to‘very uncomfortable’and even‘extremely uncomfortable’at more than 110 km/h.Moreover,the variation trend of vibration comfort of Sperling index W was consistent with ISO standards;the feeling was‘‘feel obvious vibration’at 100 km/h and‘feel very irregular vibration’and‘feel uncomfortable’at more than 120 km/h.Inaword,thevibration comfortdeteriorated when vehicle speed increased.Therefore,vehicles should slow down on the bridge to guarantee minimum speed.
Three vehicle loads,20,25,and 30 t,were chosen for impact analysis.The level of road roughness was A,and other parameters were invariable.The results calculated by the self-compiled program are shown in Fig.16.
In Fig.16,the dynamic displacement increased with the increase of vehicle load.When the vehicle load changed from 20 to 30 t,the human feeling of vehicle vibration was‘uncomfortable’’based on the ISO standard and‘feel obvious vibration’and‘still feel comfortable’’based on the Sperling index.This finding indicatesthatvehicleloadhadaminimaleffectonvehiclevibration and riding comfort in the case without speed.
On the basis of the self-compiled Fortran program and bridge engineering,the dynamic responses of long-span continuous girder bridge under vehicle load were studied in this paper.This study included the calculation of impact coefficient,evaluation of vibration comfort,and analysis of dynamic response parameters. The following conclusions can be drawn:
(1)The bridge maximum dynamic displacement,acceleration, and impact coefficient of single lane under the action of moving vehicles are smaller than those of three lanes with the same trafficcondition.The impact coefficient changed from 0.165 to 0.186, which is much larger than the 0.05 calculated by the JTG D60-2004 Code.
(2)The Dieckmann index of single lane under the action of moving vehicles is smaller than that of three lanes with the same trafficcondition,whosevalueincreasesfrom1.3to1.42.Moreover, humans can tolerate any long-term vibration under two types of worst-case loading.Thus,the vibration comfort of the bridge is good.
(3)The impacts on dynamic responses of the bridge under the action of moving vehicles,including vertical dynamic displacement in midspan,vertical acceleration,impact coefficient,and vibration comfort,are analyzed with the parameters of road roughness,vehicle speed,vehicle load,vehicle spacing,and lane number.The impacts on dynamic responses of vehicles in the vehicle-bridge coupled vibration system,including vehicle vertical dynamic displacement and vibration comfort,are also analyzed with the parameters of road roughness,vehicle speed,and vehicle load.The relevant conclusions from parametric analyses have practical significance to the dynamic design and daily operation of long-spancontinuousgirderbridgesinexpressways.Drivingsafety and comfort are expected to improve significantly through further control of the vibration of vehicle-bridge systems.
Acknowledgments
The financial support was provided by the National Natural Science Foundation of China(51378504)and the Funding Project of Traffic Science and Technology Program of Hunan Province(201022).
[1]Y.F.Song,Highway Bridge Dynamics,China Communications Press,Beijing, 2006.
[2]M.Kawatani,S.Nishiyama,Y.Yamada,Dynamic response analysis of highway girder bridges under moving vehicles,Technology Reports of the Osaka University 43(1993)109-118.
[3]P.K.Chatterjee,T.K.Datta,Vibration of continues bridges under moving vehicles,J.Sound Vib.169(1994)619-632.
[4]T.L.Wang,D.Z.Huang,Cable-stayed bridge vibration due to road surface roughness,J.Struct.Eng.ASCE 118(1992)1354-1373.
[5]M.F.Green,D.Cebon,Dynamic interaction between heavy vehicles and highway bridges,Comput.Struct.62(1997)253-264.
[6]J.G.S.Da Silva,Dynamical performance of highway bridge decks with irregular pavement surface,Computers and Structures 82(2004)871-881.
[7]P.A.Jonsson,S.Stiched,I.Persson,New simulation model for freight wagons with UIC link suspension,Veh.Syst.Dyn.46(2008)695-704.
[8]N.Zhang,H.Xia,Dynamic analysis of coupled vehicle-bridge system based on inter-system iteration method,Computer and structure 10(2013)26-34.
[9]M.A.Li,K.Cui,S.Lei,A semi-action control method for vehicle-bridge coupled system,Chinese J.Appl.Mech.28(2011)376-38.
[10]R.Cantieni,Dynamic load tests on highway bridges in switezerland.60 years experience of EMPA report No.211,1983.
[11]Q.H.Wu,Test research on the influence factor of dynamic coefficient,China J. Highw.Transp.4(1991)27-34.
[12]R.X.Xu,Test research on dynamic action of forest road bridge vehicle load, Journal of Northeast Forestry University 26(1993)16-20.
[13]L.Kwasniewski,J.Wekezer,R.Carry,etal.,Experimentalevaluationofdynamic effects for a selected highway bridge,J.Perform.Constr.Facil.20(2006)253-260.
[14]X.He,T.Shimoda,M.Hayashikawa,et al.,Dynamic response evaluation on curvedtwinl-girderbridgeusingvehicle-bridgecoupledvibrationanalysis,in: 13th East Asia-Pacific Conference on Structural Engineering and Construction, 2013.
[15]B.Liu,Y.Z.Wang,P.Hu,et al.,Impact coefficient and reliability of mid-span continuous beam bridge under action of extra heavy vehicle with low speed, J.Cent.South Univ.22(2015)1510-1520.
[16]JTG D60-2004,Genera Code for Design of Highway Bridge and Culveres.China Communications Press,2004(in Chinese).
[17]D.J.Li,Civil Engineering Structure Analysis Programming Principle and its Application,Central South University Press,Changsha,2014(in Chinese).
[18]L.H.Hu,D.J.Li,Analysis of characteristics and flutter for large span continuous box girder bridge with high skew piers,Journal of Railway Science and Engineering 11(2014)35-40(in Chinese).
[19]G.L.Dai,D.J.Li,The Design and Application of Spatial analysis,China Communications Press,Beijing,2001(in Chinese).
[20]Z.S.Yu,Automobile Theory,China Machine Press,Beijing,2001(in Chinese).
7 January 2016
at:School of Civil Engineering,Central South University, Changsha 410075,China.
E-mail address:zzdxanlipeng@163.com(L.An).
http://dx.doi.org/10.1016/j.taml.2016.05.006
2095-0349/©2016 The Author(s).Published by Elsevier Ltd on behalf of The Chinese Society of Theoretical and Applied Mechanics.This is an open access article under the CC BY-NC-ND license(http://creativecommons.org/licenses/by-nc-nd/4.0/).
*This article belongs to the Dynamics and Control
杂志排行
Theoretical & Applied Mechanics Letters的其它文章
- Editorial:Advances in Optical Techniques for Mechanical Measurements
- Residual stress measurement for injection molded componentsAchyut Adhikari∗,Thomas Bourgade,Anand Asundi
- Fabrication of nanoscale speckle using broad ion beam milling on polymers for deformation analysisQinghua Wanga,∗,Satoshi Kishimotob,Yoshihisa Tanakab,Kimiyoshi Naitob
- Instantaneous phase-stepping interferometry based on a pixelated micro-polarizer arraySatoru Yoneyama∗,Shuichi Arikawa
- Visualizing surface strain distribution of facial skin using stereovisionNagisa Miura,Tsubasa Sakamoto,Yuichi Aoyagi,Satoru Yoneyama∗
- Fabrication of micro-scale gratings for moiré method with a femtosecond laserGaosheng Yana,Jianguo Zhua,∗,Yanlong Huanga,Wenfen Haoa,Yanjie Lib
