我国主要麦区小麦氮素吸收及其产量效应
2016-08-24车升国李燕婷林治安胡树文赵秉强
车升国, 袁 亮, 李燕婷, 林治安, 沈 兵, 胡树文, 赵秉强*
(1农业部植物营养与肥料重点实验室,中国农业科学院农业资源与农业区划研究所,北京 100081;2中海石油化学股份有限公司,北京 100029; 3 中国农业大学资源与环境学院,北京 100193)
我国主要麦区小麦氮素吸收及其产量效应
车升国1, 袁 亮1, 李燕婷1, 林治安1, 沈 兵2, 胡树文3, 赵秉强1*
(1农业部植物营养与肥料重点实验室,中国农业科学院农业资源与农业区划研究所,北京 100081;2中海石油化学股份有限公司,北京 100029; 3 中国农业大学资源与环境学院,北京 100193)

小麦产量; 氮素吸收; 需氮量; 响应特征
近年来在小麦产量、品质、氮效率、氮平衡等方面已开展了大量的研究工作[13-16]。曹承富等[13]在安徽砂浆黑土的研究表明,施氮量为225 kg/hm2时皖麦38和皖麦44产量最高,分别为5.91 t/hm2和6.22 t/hm2,再增施氮肥(75 kg/hm2)小麦产量不升反降。徐凤娇等[14]研究表明,小麦产量与蛋白质产量在施氮量为N 270 kg/hm2时达最高,再增施氮肥N 90 kg/hm2,小麦产量和蛋白质产量均下降。党廷辉等[15]在陕西黑垆土上的研究表明,麦田土壤中硝态氮数量、氮素盈余值与氮肥用量成正比。目前的研究主要集中于田块尺度,或小样本数的氮吸收规律,尚缺乏区域间大尺度、大样本数量的深入探索[17]。因此,本文在收集2000年以后大量文献数据和田间试验数据的基础上,系统分析我国黄淮海冬麦区、长江中下游冬麦区和西北冬春兼播麦区小麦主产区的小麦产量、籽粒氮含量、秸秆氮含量、地上部吸氮总量和生产100 kg小麦籽粒需氮量的区域差异,探索不同小麦产量水平下籽粒氮含量、秸秆氮含量和100 kg籽粒需氮量的变化特征,以期为我国小麦推荐施肥模型等提供科学的区域参数,为指导小麦区域合理施肥提供理论依据与科学参考,实现我国小麦增产高产,提高氮肥利用效率。
1 材料与方法
1.1研究区域概况
在参考我国小麦种植业区划、中国化肥区划等资料的基础上[18-19],根据2013年我国小麦区域生产布局和产量情况,选择3个主要的小麦生产区作为研究对象,分别为黄淮海冬(秋播)麦区(HH)、长江中下游冬(秋播)麦区(YR)和西北冬春兼播麦区(NW)。2013年3个小麦产区小麦的播种面积为21783千公顷,占我国小麦总播种面积的90.32%; 小麦产量11485万吨,占我国小麦总产量的94.20%[2]。
黄淮海冬(秋播)麦区主要包括山东、河南、河北、北京、天津及江苏和安徽北部。本区地处暖温带,气候温和,属半湿润性或半干旱季风气候,土壤类型以褐土和潮土为主,小麦主要为冬小麦(冬小麦—夏玉米轮作)。2013年本区小麦播种面积和产量占全国的57.44%和66.64%[2]。
长江中下游冬(秋播)麦区包括浙江、湖北、湖南、江西及安徽和江苏南部等。本区位于北亚热带季风区,气候温暖湿润,热量丰富,土壤类型主要为水稻土、棕壤等,小麦主要为冬小麦(冬小麦—水稻或其他作物轮作)。2013年本区小麦播种面积和产量占全国的14.53%和13.74%[2]。
西北冬春兼播麦区包括陕西、山西、新疆、宁夏、甘肃和内蒙古东部区域。本区处于中温带内陆地区,属大陆性气候,冬季寒冷,夏季炎热,土壤以棕钙土、灰钙土、灌漠土、灰漠土等为主。小麦有冬小麦和春小麦。2013年本区小麦播种面积和产量占全国的18.35%和13.82%[2]。
1.2数据来源
本研究所涉及数据包括小麦产量、籽粒氮吸收量、秸秆氮吸收量、地上部氮吸收总量、籽粒含氮量、秸秆含氮量等。数据来自于课题组“十一五”、“十二五”国家科技支撑计划课题的试验数据等,以及2000年后公开发表的文献资料,包括期刊文献、硕博毕业论文、书籍等。选择研究区域的样点数,其中产量数据为5484组、籽粒氮含量3456组、秸秆氮含量2460组、植株氮积累量4962组和生产100 kg籽粒需氮量数据5073组。详细样点分布见图1和表1。
1.3数据处理
利用Excel (2003) 进行数据的预处理; 应用Sigmplot10.0软件制作小麦籽粒氮含量、小麦秸秆氮含量、100 kg籽粒需氮量与产量变化的关系图,同时分析小麦产量与地上部吸收氮总量的相互关系并制图。黄淮海冬麦区、长江中下游冬麦区、西北冬春兼播麦区及全国样点的小麦产量与小麦吸收氮总量进行模拟分析时,模型选试指数函数、线性函数、多项式、乘幂函数等,经多次调试选用R2最高、显著性最好的乘幂函数Y=aXb(a、b为常数)。
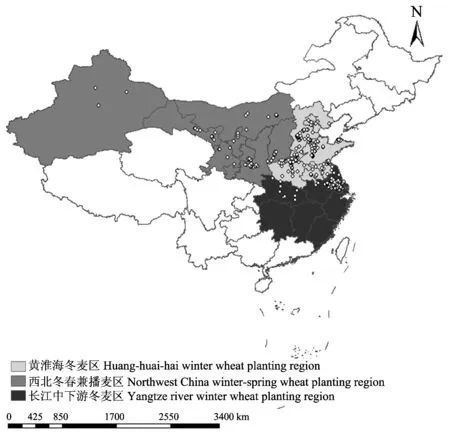
图1 我国小麦产区数据样点分布图Fig.1 Distribution map of the sample points for wheat in China
2 结果与分析
2.1小麦主产区的氮素吸收规律
黄淮海冬麦区小麦产量最高,达7.06 t/hm2(n=3027),西北冬春兼播麦区最低,仅为4.71 t/hm2(n=1398),长江中下游冬麦区居中,为5.60 t/hm2(n=1059)。区域间小麦产量水平的不同,氮素吸收量也存在差异。黄淮海冬麦区籽粒氮含量、秸秆氮含量、地上部吸氮总量较高,分别为2.24%、0.56%、211.1 kg/hm2; 长江中下游冬麦区籽粒氮含量、秸秆氮含量、地上部吸氮总量分别为1.92%、0.5%、146.7 kg/hm2; 西北冬春兼播麦区籽粒氮含量、秸秆氮含量、地上部吸氮总量分别为2.14%、0.53%、138.0 kg/hm2(表1)。
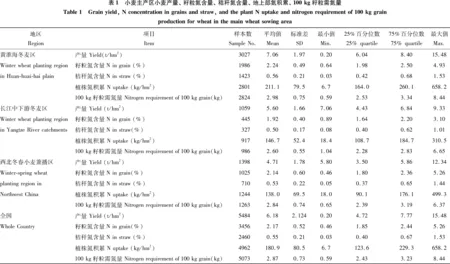
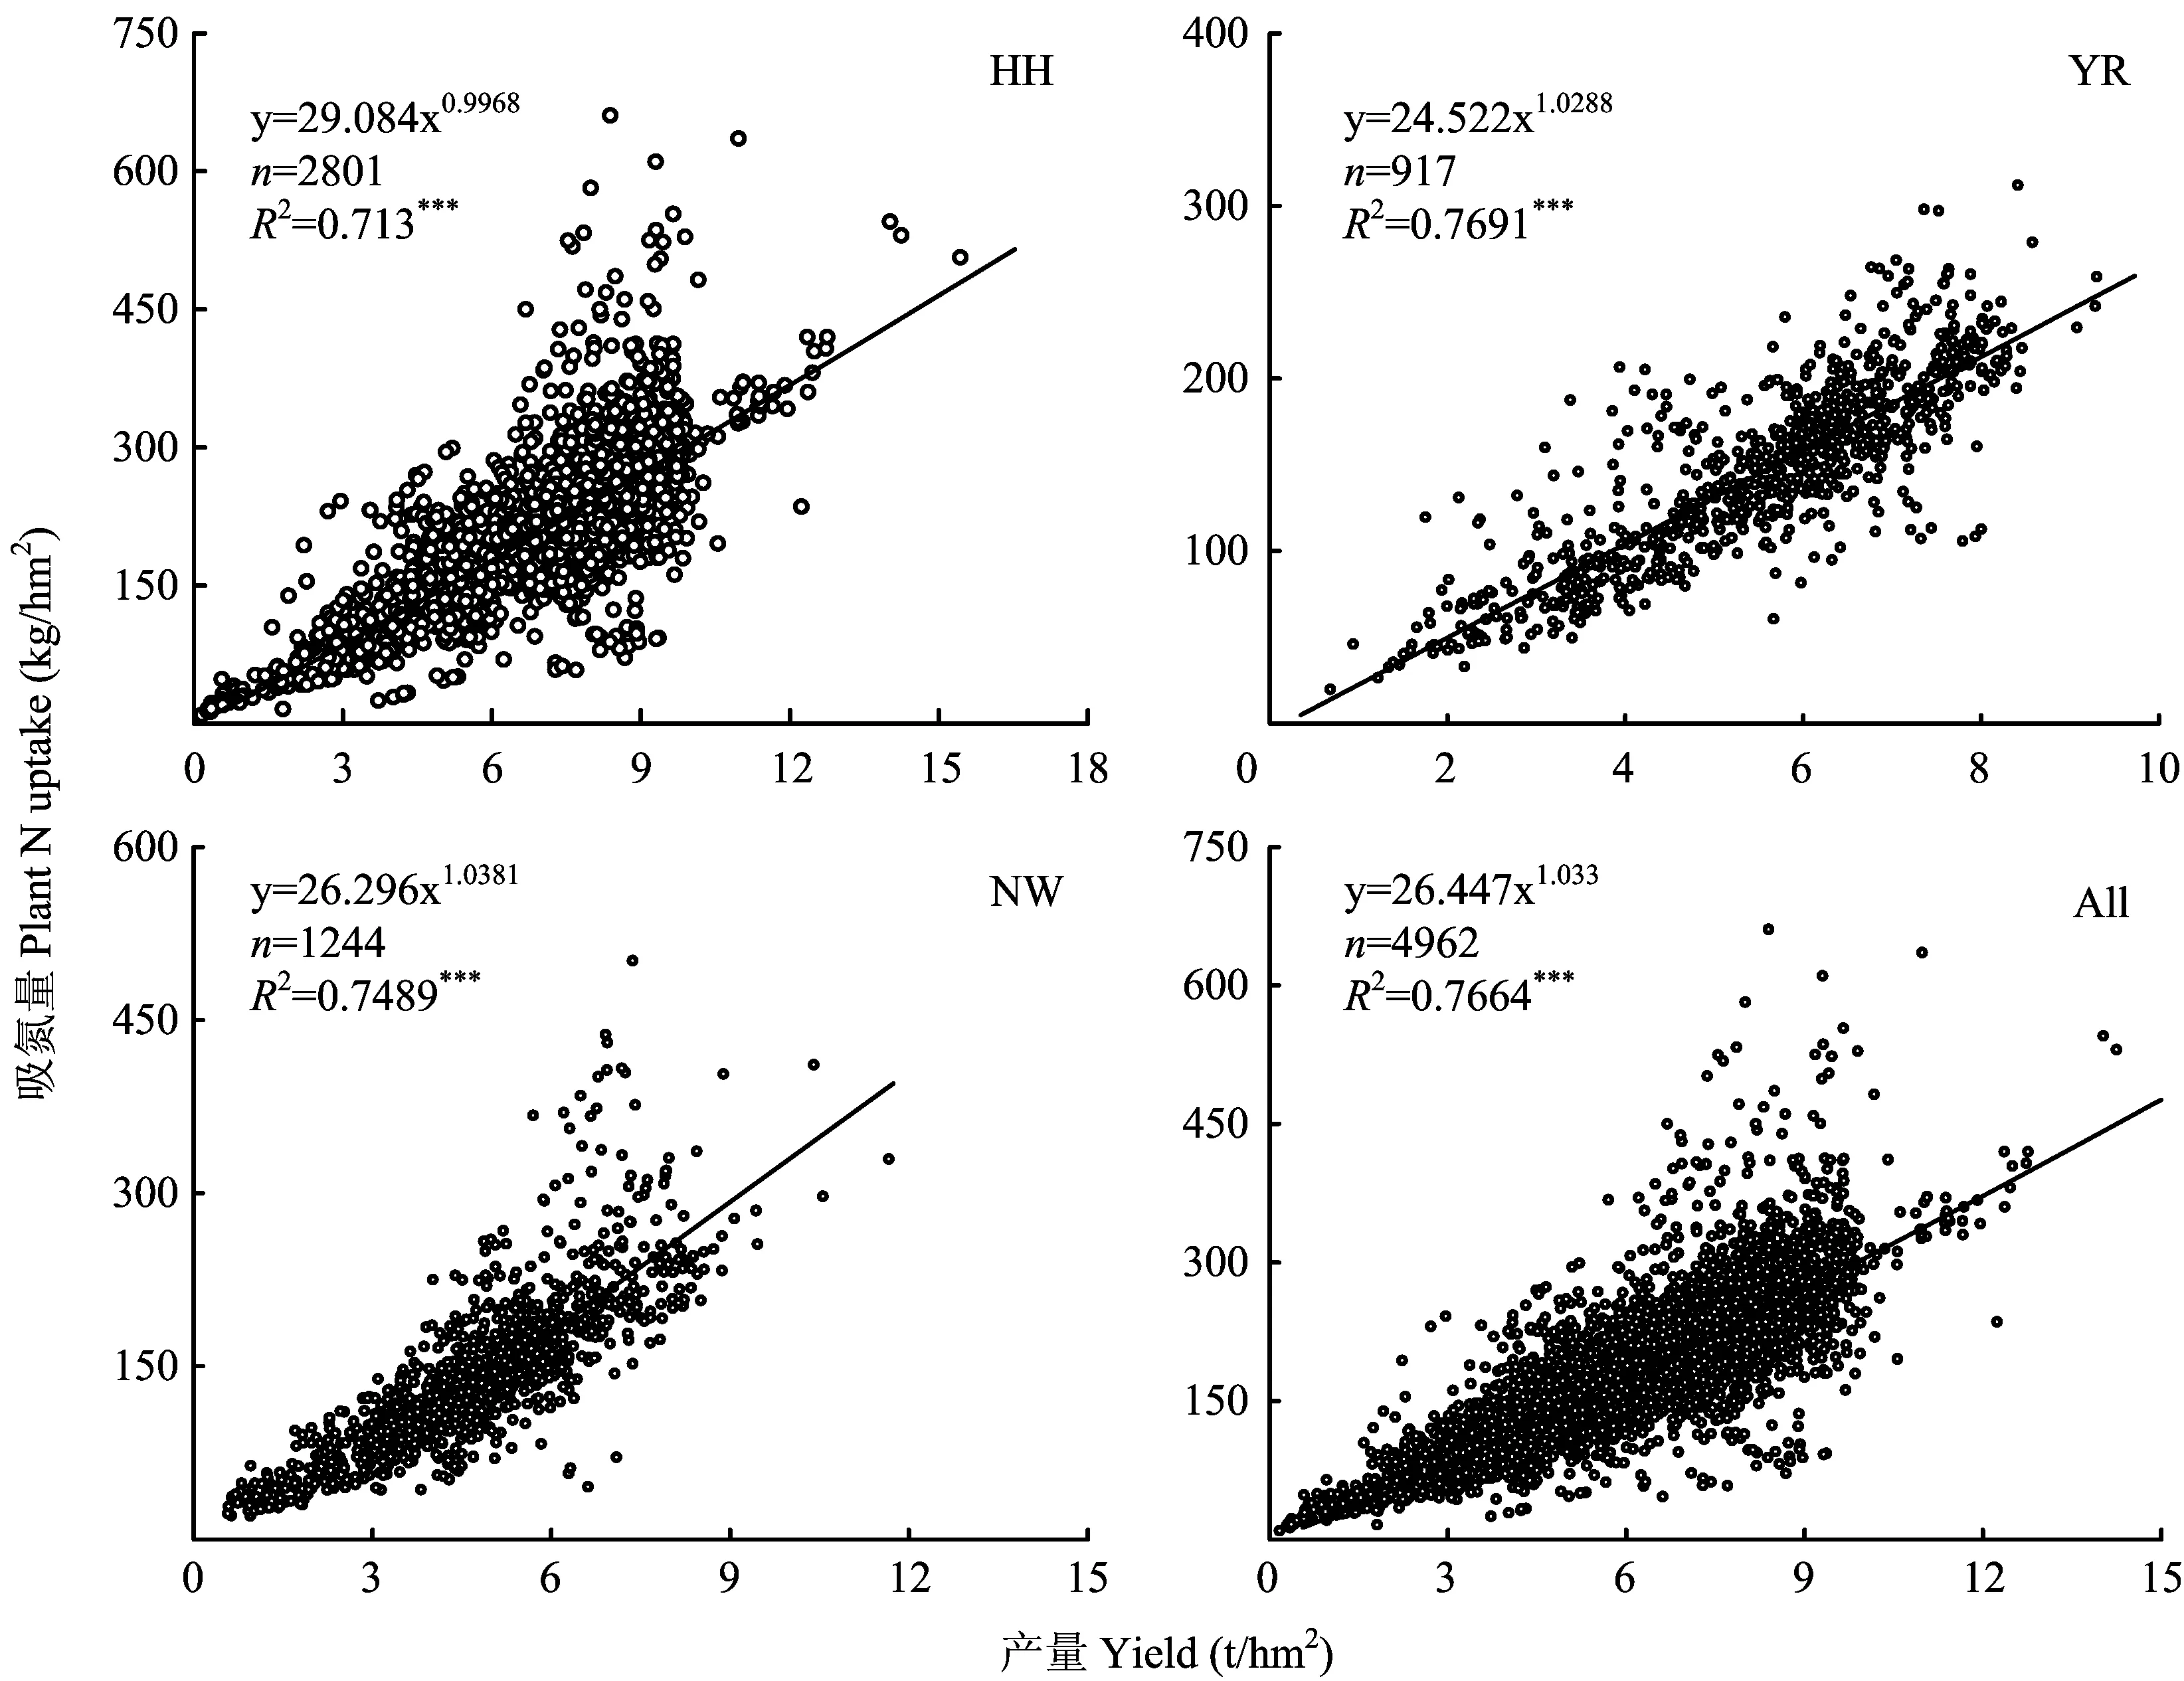
图2 黄淮海冬麦区(HH)、长江中下游冬麦区(YR)、西北冬春兼播麦区(NW)及全国(All)小麦产量与地上部氮吸收总量的相关关系Fig.2 Relations between the aboveground plant N uptakes and wheat yields for Huang-Huai-Hai winter wheat planting region(HH), Yangtze River winter wheat planting region(YR), Northwest China winter-spring wheat planting region(NW) and the whole China(All)
2.2小麦氮素吸收特征及其产量效应
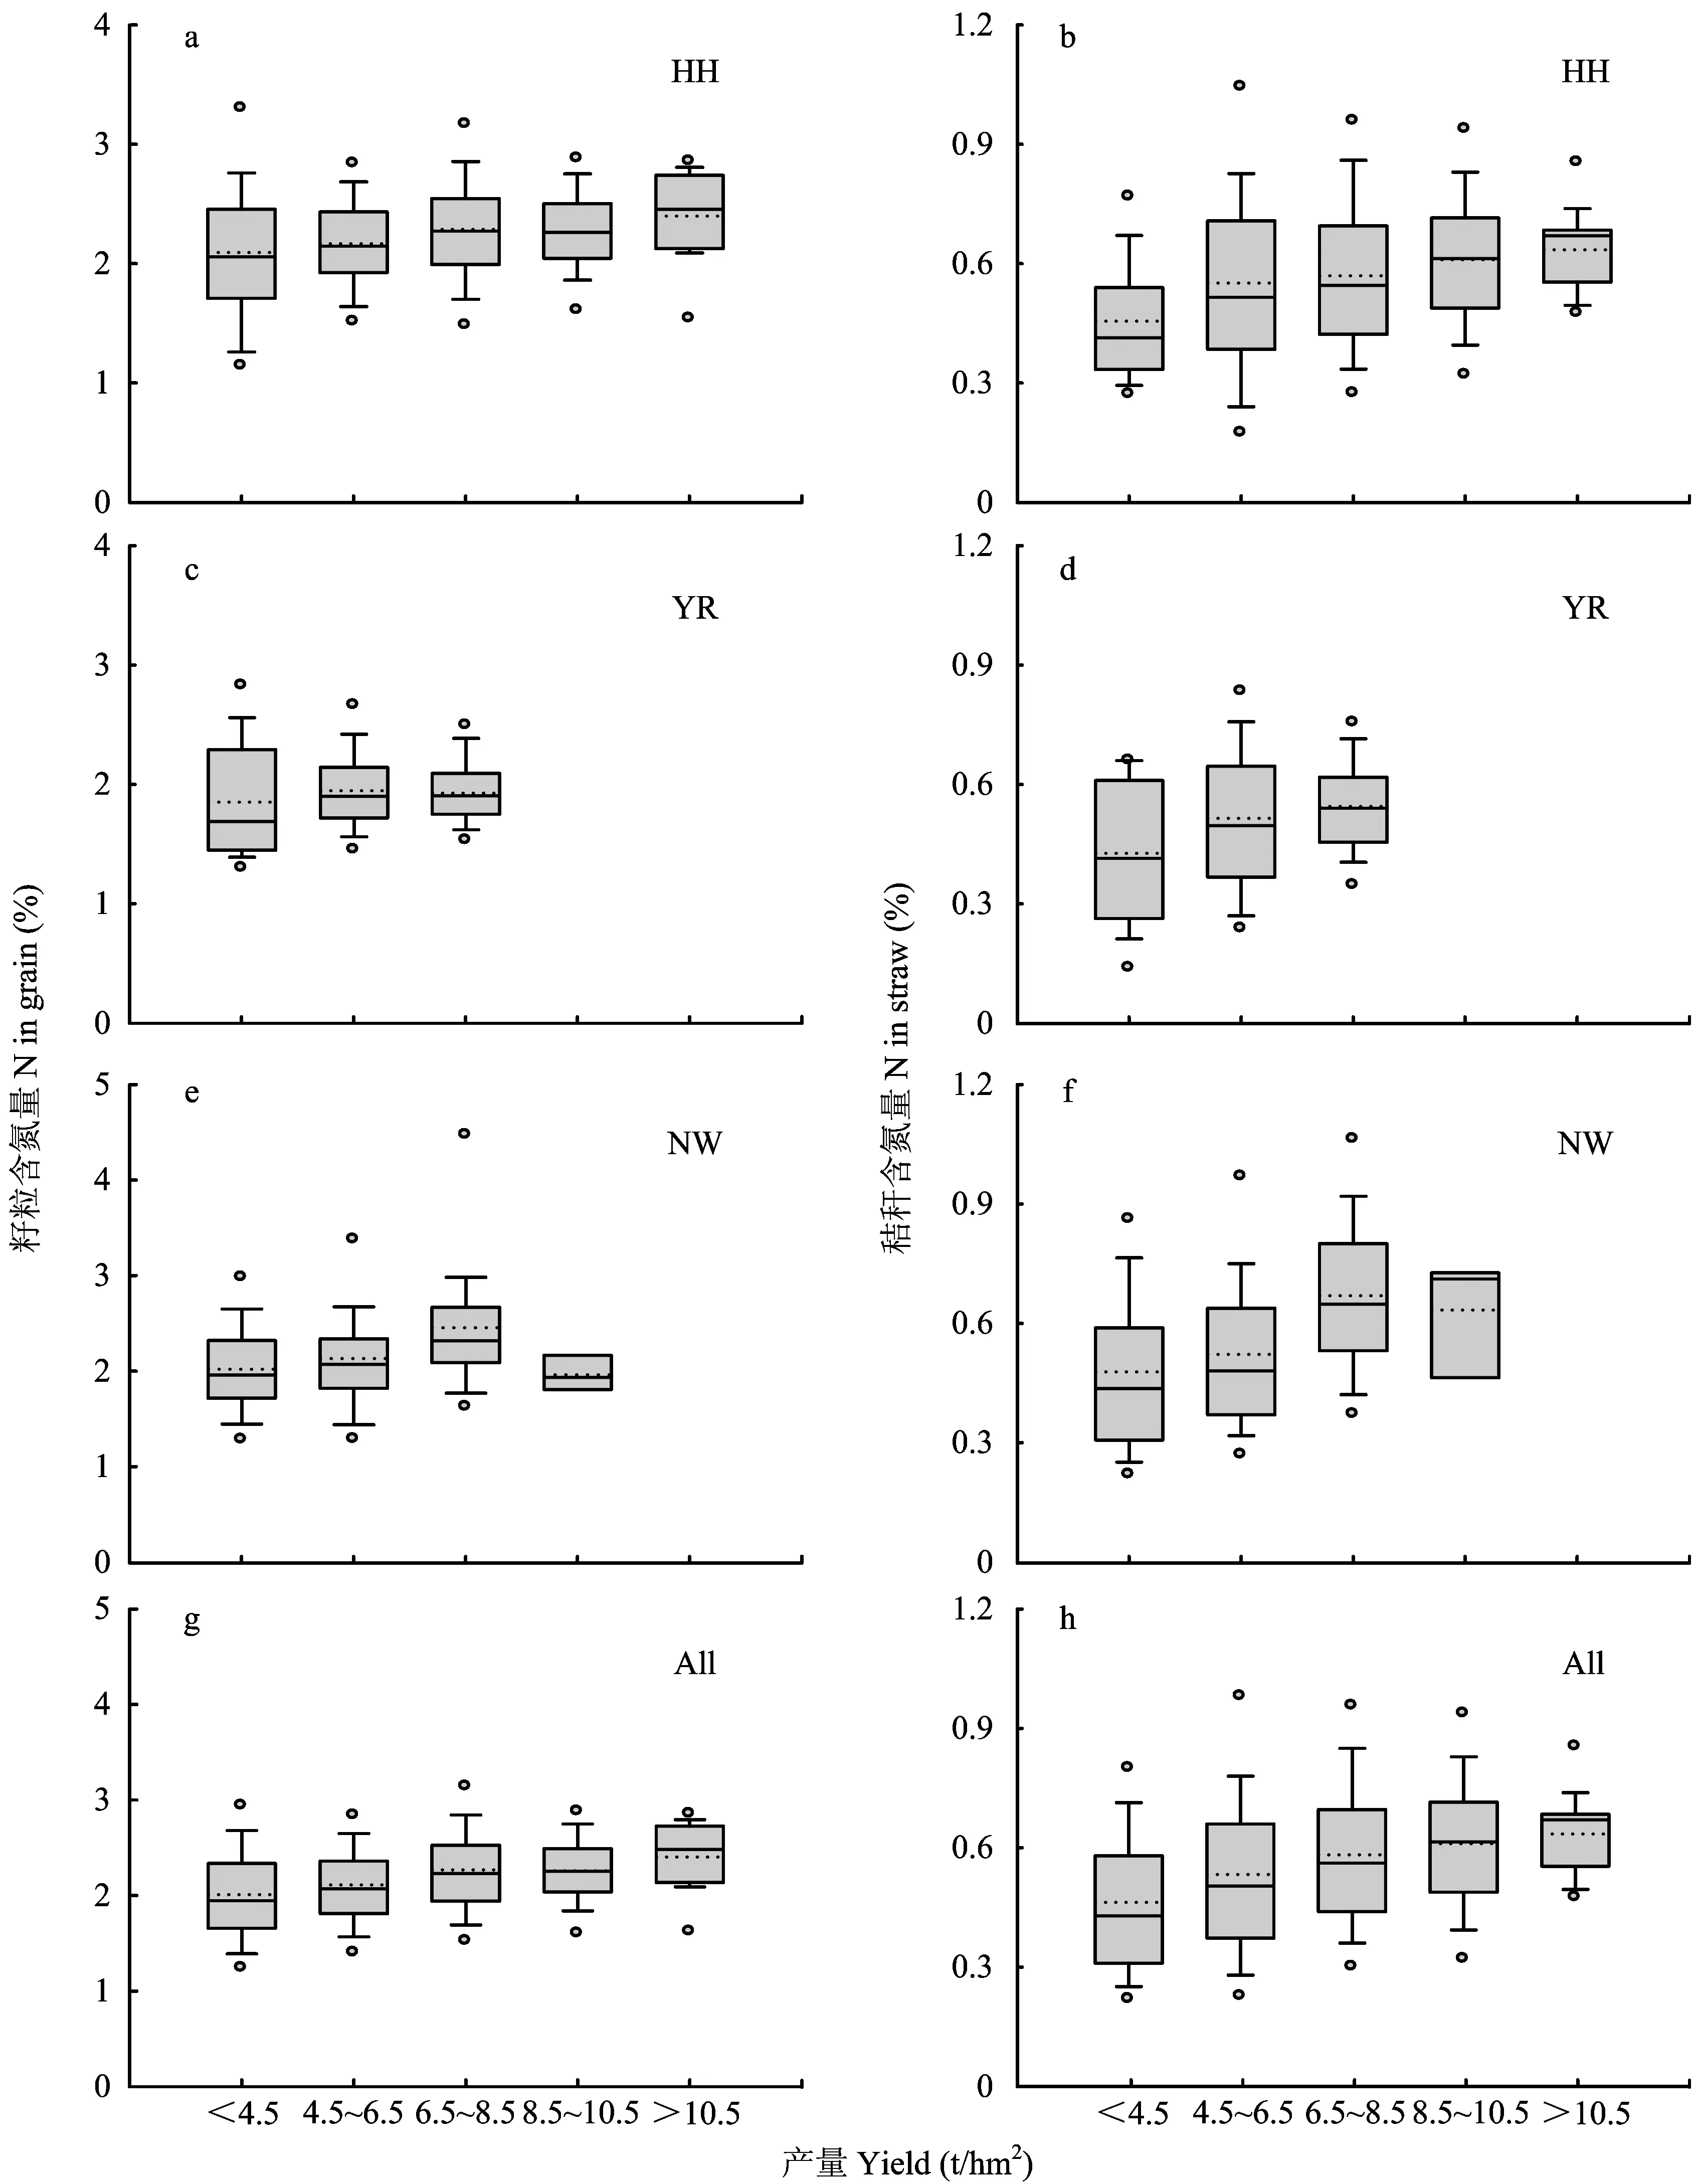
图3 黄淮海冬麦区(HH)、长江中下游冬麦区(YR)、西北冬春兼播麦区(NW)及全国(All)小麦籽粒与秸秆氮素含量Fig.3 The N concentrations in grains and straw in Huang-huai-hai winter wheat planting region(HH), Yangtze River winter wheat planting region(YR), Northwest China spring-winter wheat planting region(NW) and the whole China(All)
[注(Note): 盒状图中箱体中部的实线和虚线分别代表中值和平均值,箱体上下边代表75%和25%位点,上下横线代表90%和10%位点,上下圆点代表95%和5%位点Solid and dashed lines in this box figure indicate median and mean, respectively. The box boundaries indicate the 75th quartiles and 25th quartiles, the whisker caps indicate 90th and 10th percentiles, and the circles represent the 95th and 5th percentiles.]

图4 黄淮海冬麦区(HH)、长江中下游冬麦区(YR)、西北冬春兼播麦区(NW)及全国(All)100 kg小麦籽粒需氮量Fig.4 The N requirement amounts per 100 kg grains in Huang-huai-hai winter wheat planting region(HH), Yangtze River winter wheat planting region(YR), Northwest China spring-winter wheat planting region and the whole China(All)
[注(Note): 盒状图中箱体中部的实线和虚线分别代表中值和平均值,箱体上下边代表75%和25%位点,上下横线代表90%和10%位点,上下圆点代表95%和5%位点Solid and dashed lines in this box figure indicate median and mean, respectively. The box boundaries indicate the 75th quartiles and 25th quartiles, the whisker caps indicate 90th and 10th percentiles, and the circles represent the 95th and 5th percentiles.]
3 讨论与结论
[1]Zhang J. China’s success in increasing per capita food production[J]. Journal of Experimental Botany, 2011, 62: 3707-3711.
[2]中华人民共和国国家统计局. 中国统计年鉴(2014)[M]. 北京: 中国统计出版社, 2014.
National Bureau of Statistics of the People’s Republic of China. China statistical yearbook (2014)[M]. Beijing: China Statistics Press, 2014.
[3]赵秉强. 新型肥料[M]. 北京: 科学出版社, 2014.
Zhao B Q. New fertilizer[M]. Beijing: Science Press, 2004.
[4]闫湘. 我国化肥利用现状与养分资源高效利用研究[D]. 北京: 中国农业科学院博士学位论文, 2008.
Yan X. Study on present status of chemical fertilizer application and high efficient utilization of nutrition in China[D]. PhD Dissertation of Chinese Academy of Agricultural Sciences, 2008.
[5]李絮花, 赵秉强. 山东省作物专用复混肥料农艺配方[M]. 北京: 中国农业出版社, 2014.
Li X H, Zhao B Q. Agronomic formula of crops-special compound fertilizer at Shandong province[M]. Beijing: China Agriculture Press, 2014.
[6]唐慎欣. 小麦-玉米种植体系中养分资源利用规律及平衡研究[D]. 泰安: 山东农业大学硕士学位论文, 2012.
Tang S X. Study on soil nutrient resource and nutrient balance of wheat-maize rotation[D]. Taian: MS Thesis of Shandong Agricultural University, 2012.
[7]彭雪松. 河南省小麦玉米化肥施用状况与应用效果研究[D]. 郑州: 河南农业大学硕士学位论文, 2012.
Peng X S. Study on chemical fertilizer consumption and application effect on wheat and maize in Henan[D]. Zhengzhou: MS Thesis of Henan Agricultural University, 2012.
[8]戴相林. 关中中西部地区农田土壤养分平衡状况演变研究[D]. 杨陵: 西北农林科技大学硕士学位论文, 2012.
Dai X L. Changes of nutrient balances in soil in Midwest region of Guanzhong plain[D]. Yangling: MS Thesis of Northwest A & F University, 2012.
[9]张福锁,王激情,张卫峰,等. 中国主要粮食作物肥料利用率现状与提高途径[J]. 土壤学报, 2008, 45(5): 915-924.
Zhang F S, Wang J Q, Zhang W F,etal. Nutrient use efficiencies of major cereal crops in China and measures for improvement[J]. Acta Pedologica Sinica, 2008, 45(5): 915-924.
[10]Guo J H, Liu X J, Zhang Y,etal. Significant acidification in major Chinese croplands[J]. Science, 2010, 327: 1008-1010.
[11]Zhao B Q, Li X Y, Li H,etal. Results from long-term fertilizer experiments in China: The risk of groundwater pollution by nitrate[J]. NJAS-Wageningen Journal of Life Sciences, 2011, 58: 177-183.
[12]Bouwman A F. Direct emissions of nitrous oxide from agricultural soils[J]. Nutrient Cycling in Agroecosystems, 1996, 46: 53-70.
[13]曹承富, 孔令聪, 汪建来, 等. 施氮量对强筋和中筋小麦产量和品质及养分吸收的影响[J]. 植物营养与肥料学报, 2005, 11(1): 46-50.
Cao C F, Kong L C, Wang J L,etal. Effects of nitrogen on yield, quality and nutritive absorption of middle and strong gluten wheat[J]. Plant Nutrition and Fertilizer Science, 2005, 11(1): 46-50.
[14]徐凤娇, 赵广才, 田奇卓, 等. 施氮量对不同品质类型小麦产量和加工品质的影响[J]. 植物营养与肥料学报, 2012, 18(2): 300-306.
Xu F J, Zhao G C, Tian Q Z,etal. Effects of nitrogen fertilization on grain yield and processing quality of different wheat genotypes[J]. Plant Nutrition and Fertilizer Science, 2012, 18(2): 300-306.
[15]党廷辉, 戚龙海, 郭胜利, 郝明德. 旱地土壤硝态氮与氮素平衡、氮肥利用的关系[J]. 植物营养与肥料学报, 2009, 15 (3): 573-577.
Dang T H, Qi L H, Guo S L, Hao M D. Relationship between soil nitrate, nitrogen balance and utilization in rainfed land[J]. Plant Nutrition and Fertilizer Science, 2009, 15 (3): 573-577.
[16]高会议, 郭胜利, 刘文兆, 车升国. 施肥措施对黄土旱塬区小麦产量和土壤有机碳积累的影响[J]. 植物营养与肥料学报, 2009, 15 (6): 1333-1338.
Gao H Y, Guo S L, Liu W Z, Che S G. Effect of fertilization on wheat yield and soil organic carbon accumulation in rainfed loessial tablelands[J]. Plant Nutrition and Fertilizer Science, 2009, 15 (6): 1333-1338.
[17]串丽敏. 基于产量反应和农学效率的小麦推荐施肥方法研究[D]. 北京: 中国农业科学院博士学位论文,2013.
Chuan L M. Methodology of fertilizer recommendation based on yield response and agronomic efficiency for wheat[D]. Beijing: PhD Dissertation of Chinese Academy of Agricultural Sciences,
2013.[18]赵广才. 中国小麦种植区划研究(一)[J]. 麦类作物学报, 2010, 30(5): 886-895.
Zhao G C. Study on Chinese wheat planting regionalization (1)[J]. Journal of Triticeae Crops, 2010, 30(5): 886-895.
[19]中国农业科学院土壤肥料研究所. 中国化肥区划[M]. 北京: 中国农业科技出版社, 1986.
Soil and Fertilizer Institute, Chinese Academy of Agricultural Sciences. Zone of fertilizer in China[M]. Beijing: China Agricultural Science and Technology Press, 1986.
[20]Liu M Q, Yu Z R, Liu Y H, Konijn N T. Fertilizer requirements for wheat and maize in China: The QUEFTS approach[J]. Nutrient Cycling in Agroecosystems, 2006, 74: 245-258.
[21]田中伟. 小麦产量和氮素吸收利用特性的改良特征及生理基础[D]. 南京: 南京农业大学博士学位论文,2012.
Tian Z W. Genetic improvement of grain yield and characteristics of nitrogen uptake and utilization in winter wheat and its physiological basis[D]. Nanjing: PhD Dissertation of Nanjing Agricultural University, 2012.
[22]Foulkes M J, Snape J W, Shearman V Jetal. Genetic progress in yield potential in wheat: recent advances and future prospects[J]. Journal of Agricultural Science, 2007, 145: 17-29.
[23]Zhu Z L, Chen D L. Nitrogen fertilizer use in China-contributionsto food production, impacts on the environment and best management strategies[J]. Nutrient Cycling in Agrocosystems, 2002, 63: 117-127.
[24]Zhao B, Li X, Li X,etal. Long-term fertilizer experimentnetwork in China: crop yields and soil nutrient trends[J]. Agronomy Journal, 2010, 102 (1): 216-230.
[25]Xu X P, He P, Pampolino M F,etal. Nutrient requirements for maize in China based on QUEFTS analysis[J]. Field Crops Research, 2013, 150: 115-125.
[26]Witt C, Dobermann A, Abdulrachman S,etal. Internal nutrient efficiencies of irrigated lowland rice in tropical and subtropical Asia[J]. Field Crops Research, 1999, 63: 113-138.
[27]Yue S C, Meng Q F, Zhao R F,etal. Change in nitrogenrequirement with increasing grain yield for winter wheat[J]. Agronomy Journal, 2012, 104: 1687-1693.
N uptake and yield response of wheat in main wheat production regions of China
CHE Sheng-guo1, YUAN Liang1, LI Yan-ting1, LIN Zhi-an1, SHEN Bing2, HU Shu-wen3, ZHAO Bing-qiang1*
(1KeyLaboratoryofPlantNutritionandFertilizer,MinistryofAgriculture/InstituteofAgriculturalResourcesandRegionalPlanning,ChineseAcademyofAgriculturalSciences,Beijing100081,China; 2ChinaBlueChemicalLtd.,Beijing100029,China;3CollegeofResourcesandEnvironmentalSciences,ChinaAgriculturalUniversity,Beijing100193,China)
【Objectives】 Investigating the regional variation in N use efficiency and yield is helpful to guild regional fertilization and planning of wheat all over the country. This differences of N absorption among wheat-planting regions and their grain yields response of wheat were compared in this paper. 【Methods】 Based on mass data published in journals and field experiments in China after 2000, the wheat yield, N concentrations in grains and straw, and N uptake among Huang-huai-hai winter wheat planting region (HH), Northwest China winter-spring wheat planting region (NW) and Yangtze River winter wheat planting region (YR) were summerized, and 100 kg grain N absorption by wheat under different yield levels was proposed. 【Results】The results show that wheat grain yield, N contents in grains and straw, above-ground N uptake and N needed per 100 kg-grains have significant regional variations. The mean grain yield in China is 6.18 t/hm2with a variable coefficients of 34.37%. The highest grain yield is 7.05 t/hm2in whinter wheat area in HH and the lowest is 4.71 t/hm2in mixed spring and wheat area in NW, and the yield in whinter wheat area in midle and lower area of YR is 5.60 t/hm2. The N needed per 100 kg grain in China is 2.87 kg with a variable coefficient of 25.43%. The highest N needed per 100 kg-grains production is 2.98 kg in HH and the lowest is 2.60 kg in YR, and mid is 2.84 kg in NW. The mean N concentrations in grains and straws and the plant N uptake are 2.17%, 0.55% and 180.9 kg/hm2, with the corresponding variable coefficients of 23.96%, 38.18% and 44.50%, respectively. The N concentrations in grains and straw and the plant N uptake are all the highest in HH with values of 2.24%, 0.56% and 211.1 kg/hm2, following is in YR with values of 1.92%, 0.5% and 146.7 kg/hm2and in NW 2.14%, 0.53% and 138.0 kg/hm2, respectively. The N requirement per 100 kg grain, N concentrations in grains and straw increase with increasing wheat yields. The N requirement amounts are 2.79 kg, 2.80 kg, 2.91 kg, 3.03 kg and 3.05 kg for wheat yields <4.5 t/hm2, 4.5-6.5 t/hm2, 6.5-8.5 t/hm2, 8.5-10.5 t/hm2, and >10.5 t/hm2, respectively. The N concentrations in grains are 2.01%, 2.11%, 2.27%, 2.26% and 2.40% and the N concentrations in straw are 0.46%, 0.53%, 0.58%, 0.61% and 0.63% for the corresponding wheat yields, respectively. 【Conclusions】 The differences of temperature, water and soil among the wheat-planting regions cause the differences of N absorption characteristics. The difference should be taken into account for improving wheat yield and N use efficiency, and wheat grain yield and N absorption for special regions.
wheat yield; N uptake; N requirement; response characteristic
2015-01-26接受日期: 2015-04-01
国家“十二五”科技支撑计划项目(2011BAD11B05, 2013BAD05B04) 资助。
车升国(1983—),男,山东临沂人,博士生,助理研究员,主要从事农田土壤肥力研究。
Tel: 010-82108664, E-mail: cheshengguo@caas.cn。*通信作者 Tel: 010-82108658, E-mail: zhaobingqiang@caas.cn
S512.1.01
A
1008-505X(2016)02-0287-09